Thursday, April 10, 2025

ALMA Reveals Hydrogen Glow Around Planet-Forming Disks in Orion

Orion Nebula Cluster

The Orion Nebula Cluster, as seen with Hubble Space Telescope/Advanced Camera for Surveys (Ricci et al. 2008). The white dashed line depicts the field of view of the 3.1 mm ALMA mosaic. Blue circles indicate proplyds detected in H41α. The red circle marks the proplyd that is also detected in He41α. Gray circles indicate the positions of 3.1 mm continuum detections that are not detected in H41α or He41α. The cyan star indicates the position of the ionizing source θ1 Ori C. Credits: Boyden et al. (2025).

3.1 mm continuum images of H41α-detected proplyds in the ONC. Each image is generated as a sub-image from the larger 3.1 mm continuum mosaic from Ballering et al. (2023). The synthesized beam is shown in the botton left corner of each panel. The arrow in each panel points to the direction of θ1 Ori C. Credits: Boyden et al. (2025).

The Milky Way Galaxy stretches over ALMA and the Chajnantor plateau of the Chilean Andes. The Large and Small Magellanic Clouds can also be seen in this panorama that was stitched together from multiple photos. Credit: NSF/ AUI/ NSF NRAO/ B.Foott


Most stars form in molecular clusters, with specific environmental conditions dictating how planetary systems develop. Nearby massive stars can also influence by intense ionizing radiation, which can create a shell of ionized gas around a protoplanetary disk and emit unique hydrogen recombination spectral lines.

Recently a scientific team led by Ryan Boyden (University of Virginia) has used archive Atacama Large Millimeter/submillimeter Array (ALMA) data to identify for the first time the characteristic radio recombination lines associated with these ionized shells surrounding Solar System-sized protoplanetary disks in the Orion Nebula Cluster, at 1000 light-years from us.

ALMA has long been used to identify recombination lines from large astrophysical objects and to study various features of protoplanetary disks. Now, this research has proven ALMA's interferometers are powerful enough to detect the specific radio-wavelength hydrogen recombination lines of individual ionized protoplanetary disks (proplyds), even in dense stellar clusters. Boyden says, "This discovery was serendipitous, and sometimes those are the most exciting science projects to work on—coming across a new finding somewhat by accident."

Whereas a protoplanetary disk is defined as the disk of dust and gas around a young star, a proplyd carries the added distinction that the disk is being ionized by intense radiation from nearby, external massive stars. Thus, a cocoon-like shell of ionized gas surrounds the system beyond the disk. The energetic boundary of this shell appears like a comet, as the neighboring star drives photoevaporation across the disk, signaling to astronomers that these proplyd disks evolve quite differently.

Boyden and his team used data from prior ALMA observations to probe the ionized gas surrounding 200 protoplanetary disks of stars in the Orion Nebula Cluster. Of these, 17 proplyds were uniquely identified by a particular hydrogen recombination line.

Although ionized hydrogen is common in energetic environments such as these star-forming regions, Boyden and his team searched for the specific energy signature released when a free electron combines with a hydrogen ion and "falls" from hydrogen's 42nd energy level to its 41st. That fall, called the H41α recombination line, is distinctly recognizable within the 3.1-mm radio wavelengths observed by ALMA.

"Lines at longer or shorter wavelengths will each tell us something different about the ionized gas shell," Boyden explains. "H41α is the line that we are fortunate to already have in our observations. It's the sweet spot of accurately telling us the temperature and density of the ionized gas and also being a lucky match to ALMA's sensitivity. ALMA is the most powerful array of radio telescopes in the world, at the best angular resolution, and it's uniquely sensitive at these wavelengths to find the H41α lines. That's what ALMA is good at doing, and doing it efficiently," Boyden says.

Embedded within this spectral line data, the scientific team used the hydrogen recombination line flux to calculate an average temperature of 6000 – 10,000 K across the shells. "They're quite warm. And this is now one of our most accurate temperature measurements for that ionized gas," Boyden says. In addition, the spectral line width reveals a trove of kinematic information about the disk, as the spread can indicate Doppler effect motions pushing the light to longer or shorter wavelengths. Finally, Boyden adds, "We studied the width of those recombination lines to ask, 'What is causing that spread?' Is it just the gases randomly shaking around, or is some more ordered flow associated with photoevaporation from these stars shaping the disk's evolution? We think it's the latter."

In addition to the H41α recombination lines, Boyden and his team also identified intriguing He41α lines, indicating a potential difference from the expected abundance of helium in the region. Boyden acknowledges that adjacent carbon emissions may contaminate these helium lines, and he speculates on the next steps in the technological development of radio telescope interferometry. "With the upgrades coming to ALMA and ngVLA in the future, they will be able to excel at longer wavelengths for even more radio recombination lines. This project is a steppingstone for future work."

Scientific Paper


Additional information

The results of the study are published in the following scientific paper:


Boyden et al. "Discovery of Radio Recombination Line Emission from Proplyds in the Orion Nebula Cluster".

The original press release was published by the National Radioastronomy Observatory (NRAO) of the United States, an ALMA partner on behalf of North America.

The Atacama Large Millimeter/submillimeter Array (ALMA), an international astronomy facility, is a partnership of the European Southern Observatory (ESO), the U.S. National Science Foundation (NSF), and the National Institutes of Natural Sciences (NINS) of Japan in cooperation with the Republic of Chile. ALMA is funded by ESO on behalf of its Member States, by NSF in cooperation with the National Research Council of Canada (NRC) and the National Science and Technology Council (NSTC) in Taiwan, and by NINS in cooperation with the Academia Sinica (AS) in Taiwan and the Korea Astronomy and Space Science Institute (KASI).

ALMA construction and operations are led by ESO on behalf of its Member States; by the National Radio Astronomy Observatory (NRAO), managed by Associated Universities, Inc. (AUI), on behalf of North America; and by the National Astronomical Observatory of Japan (NAOJ) on behalf of East Asia. The Joint ALMA Observatory (JAO) provides the unified leadership and management of ALMA's construction, commissioning, and operation.


Contacts:

Nicolás Lira
Education and Public Outreach Coordinator
ALMA Observatory, Santiago - Chile
Phone:
+56 2 2467 6519
Cel: +56 9 9445 7726
Email: nicolas.lira@alma.cl

Jill Malusky
Public Information Officer
NRAO
Phone:
+1 304-456-2236
Email: jmalusky@nrao.edu

Bárbara Ferreira
ESO Media Manager
Garching bei München, Germany
Phone:
+49 89 3200 6670
Garching bei München, Germany
Email:
press@eso.org

Yuichi Matsuda
ALMA EA-ARC Staff Member
NAOJ
Email:
yuichi.matsuda@nao.ac.jp


Shedding Light on Candles That Burn a Bit Too Bright

Kepler's Supernova, the remnant of which is shown here in X-ray observations from the Chandra X-ray Observatory, is the most recent known Type Ia supernova in the Milky Way. It was discovered in 1604.  Credit:
NASA/CXC/Univ of Texas at Arlington/M. Millard et al.


Title: 1991T-Like Type Ia Supernovae as an Extension of the Normal Population
Authors: John T. O’Brien et al.
First Author’s Institution: Michigan State University
Status: Published in ApJ

Figure 1: Example of a “Branch classification” diagram for Type Ia supernovae. This figure compares the width of two silicon lines in Type Ia supernovae. Four groups are shown: shallow silicons (SS), broad lines (BL), cools (CL), and core normals (CN). Event SN 1991T is a member of the shallow silicons group (green triangles), indicating that the widths of the minor and major silicon lines are smaller than normal Type Ia supernovae (core normals). Credit:
Burrow et al. 2020

Figure 2: A plot showing the fraction of intermediate-mass elements (IME) as a function of the ionization ratio of the authors’ simulations. Moving to the right on the bottom axis indicates higher ionization states, whereas moving up on the left axis indicates more intermediate-mass elements for a given total ejecta mass. The break between blue stars (normal Type Ia supernovae) and orange stars (1991T-like supernovae) is called the “turnover.” Because the turnover is fairly smooth, it suggests that the progenitor, or stellar origin, of 1991T-like events might be similar to normal events. Credit: O’Brien et al. 2024


Famously, Type Ia supernovae have been used to measure the local Hubble constant, or the rate at which our universe expands. These objects earned the nickname “standard candles” since their near-constant intrinsic luminosities allow us to measure distances in space. Slowly but surely, however, we’ve learned that some of our standard candles aren’t that “standard” after all…

Historically, Type Ia supernovae were proposed to develop from the transfer of mass between two stars, where the star receiving the mass was a carbon–oxygen white dwarf — the core of a low-mass to intermediate-mass star that’s reached the end of its life. After the white dwarf accretes a certain amount of mass, it explodes as a Type Ia supernova. Spectroscopic studies of these supernovae over the decades have shown a wide range of absorption features, one major absorption line being silicon, a key element produced in the explosion. In fact, a subclassification scheme of Type Ia supernovae — often referred to as the Branch classification — emerged based on the relative strengths of particular absorption features commonly identified in the spectra of these events (see Figure 1). One of these subclassifications is “shallow silicon,” which signifies a lack of silicon produced in the explosion. This subclassification (compared to other subclassifications in Figure 1) shows how Type Ia supernovae are like snowflakes: they have very similar structures yet vary in detail.

The supernova SN 1991T was the first observed event of its kind. What was so special about it? This event was considered over-luminous, or more luminous than the typical “near-intrinsic luminosity” of the average Type Ia supernova. Later, as observations improved, more events like SN 1991T were detected, contributing to the growing class of aptly named “1991T-like” events. The spectra of these events have shallow silicon lines compared to the normal range of Type Ia supernovae. The peculiarity of these absorption lines hints at something unique about these events, and the answer lies in studying the ejecta, or the ejected material in which chemical elements are produced. This article is a step toward understanding what differentiates these events from the norm and what we can infer about their origins.

Outside of this work, recent hydrodynamic simulations of various progenitor models, or stellar origins, have successfully recreated some of the observable signatures of Type Ia supernovae, including synthetic, or computed, optical spectra of theoretical events. Except, as previously mentioned, the observable signatures of Type Ia supernovae can vary quite a bit amongst all these subtypes and classifications! Instead of hydrodynamic simulations, the authors of this article chose to reconstruct the supernova ejecta using Bayesian inference and active learning conducted on early-time (within a few days after explosion) optical spectra of already observed normal and 1991T-like events.

This is the time when 1991T-like events show their features! After training the model on this data, the authors developed a model to link the optical spectra and the ejecta properties corresponding to normal and 1991T-like events.
The team’s emulator successfully recreated both normal and 1991T-like events, at least with 68% confidence (think one sigma!). Furthermore, the authors discovered that the variety in the parameters used in their model illuminates some differences between these 1991T-like events and normal Type Ia supernovae. Remember those silicon features? They recreated those pesky absorption lines, particularly the major iron and silicon features experts look for. Their model successfully recreated silicon absorption features that were suppressed, or not as deep. This indicates a low fraction of intermediate-mass elements, which range from lithium to iron, produced in the explosion compared to the total mass. They also matched the deep, major iron line seen in 1991T-like events. Fewer intermediate-mass elements in 1991T-like supernovae suggest that these elements exist at higher ionization states than in normal Type Ia supernovae (see Figure 2). This suggests that there isn’t just a single mechanism that produces a 1991T-like supernova; it’s likely a combination of different physical processes.

The question now becomes: what can we learn about 1991T-like origins from this? Can a single progenitor model lead to different pathways? Or do we need different progenitor models to explain these differences in spectroscopic features? The authors believe fewer intermediate-mass elements and higher ionization states hint at normal and 1991T-like events sharing similar progenitor systems. In other words, 1991T-like events might just be an extension, or extreme, of the normal population. Perhaps the candle just burned a bit too bright!

Aside from this work, in addition to these over-luminous 1991T-like events, there also exists another interesting class of Type Ia supernovae dubbed “super-luminous,” which are roughly one, maybe two, magnitudes brighter than normal Type Ia supernovae. (Only in astronomy could the words over-luminous and super-luminous mean different things, right?) Because of this, researchers advocate for Type Ia supernovae to be called “standardizable” candles instead because, as you now know, their intrinsic luminosities really aren’t that uniform after all.

Original astrobite edited by Ansh Gupta and Dee Dunne.


About the author, Mckenzie Ferrari:

I’m a grad student at the University of Chicago. Most of my research focuses on simulations of Type Ia supernovae and galaxy formation and evolution.


Editor’s Note: Astrobites is a graduate-student-run organization that digests astrophysical literature for undergraduate students. As part of the partnership between the AAS and astrobites, we occasionally repost astrobites content here at AAS Nova. We hope you enjoy this post from astrobites; the original can be viewed at astrobites.org.


Wednesday, April 09, 2025

Gemini South Observes Shape and Origin of Near-Earth Asteroid 2024 YR4

PR Image noirlab2514a
Gemini South Captures Asteroid 2024 YR4

PR Image noirlab2514c
Asteroid 2024 YR4 Flyby Still


Videos

Asteroid 2024 YR4 Flyby
PR Video noirlab2514a
Asteroid 2024 YR4 Flyby


Astronomers have determined 3D shape and likely origins of house-sized asteroid that could potentially impact the Moon

Using observations from the Gemini South telescope in Chile, one half of the International Gemini Observatory, partly funded by the U.S. National Science Foundation and operated by NSF NOIRLab, astronomers have constructed a 3D representation of the newly discovered near-Earth asteroid 2024 YR4. The team determined that the unusually-shaped rock is one of the largest objects in recent history that could impact the Moon, and that it likely originated from the main asteroid belt.

2024 YR4 was first detected on 27 December 2024 by the Asteroid Terrestrial-impact Last Alert System (ATLAS). At the time, the asteroid made a close approach to Earth, passing at a distance of just 0.017 astronomical units (approximately 2.5 million kilometers, or 1.5 million miles). Initial uncertainty regarding its trajectory warranted further investigation, leading astronomers to secure critical special Director's Discretionary Time on Gemini South for follow-up observations using the Gemini Multi-Object Spectrograph (GMOS) on 7 February 2025.

In late January 2025, one month after its discovery, 2024 YR4 rose above the International Asteroid Warning Network (IAWN) notification threshold of 1% probability of a future impact with Earth, projected for 22 December 2032. This potential threat gained international attention among the public and the media. With further analysis, the Earth impact probability then dropped below 1% in late February. While the asteroid will miss Earth during this encounter, there remains a few percent chance it could hit the Moon instead.

Interested in characterizing the now famous asteroid, the team of astronomers, led by Bryce Bolin of Eureka Scientific, used the Gemini South telescope in Chile, one half of the International Gemini Observatory, partly funded by the U.S. National Science Foundation and operated by NSF NOIRLab, to capture images of it in multiple different wavelengths. Detailed analysis of the asteroid's lightcurve (pattern of light output in time) allowed the team to determine its composition, orbital characteristics and 3D shape.

“Our observations with Gemini South provided a crucial piece of the puzzle in determining 2024 YR4’s characteristics,” says Bolin, lead author of the paper to appear in The Astrophysical Journal Letters. “Studying this asteroid was vitally important in understanding the population of Earth crossers that have the potential to be Earth impactors and are poorly understood.”

This 3D render of asteroid 2024 YR4 was made based on data obtained on 7 February 2025 with the Gemini South telescope. The surface features are artistic interpretation.

The information gathered from the lightcurves indicates that 2024 YR4 is likely an S-type asteroid, meaning it has a composition rich in silicates. The reflective pattern also suggests a diameter of about 30–65 meters (98–213 feet) [1], making it one of the largest objects in recent history that could impact the Moon. While it remains unlikely, if it does impact the Moon the asteroid will provide an unprecedented opportunity to study the relationship between the size of an asteroid and the size of its resulting impact crater — a previously unknown quantity.

The analysis also revealed that the asteroid has a rapid rotation period of approximately one rotation per 20 minutes, as well as an unusual hockey-puck-like shape. “This find was rather unexpected since most asteroids are thought to be shaped like potatoes or toy tops rather than flat disks,” says Bolin.

Based on these orbital characteristics, the team determined that 2024 YR4 most likely originated from the main asteroid belt, with a high probability of being perturbed into its current near-Earth orbit by gravitational interactions with Jupiter. Its retrograde spin direction suggests it may have migrated inward from the central Main Belt region, adding to our understanding of how small asteroids evolve and reach Earth-crossing trajectories.

“We are a bit surprised about its origin in the central main asteroid belt, which is a location in the asteroid belt that we did not think many Earth-crossing asteroids could originate from,” says Bolin.

The results of this study demonstrate the power of rapid-response follow-up with ground-based facilities like Gemini South in planetary defense efforts [2], allowing astronomers to quickly assess and categorize newly discovered near-Earth objects

“Understanding the properties and origins of near-Earth asteroids is proving critical for understanding the risk of collisions between our planet and major bodies in crossing orbits,” says Martin Still, NSF program director for the International Gemini Observatory. “The Gemini telescopes and other astronomical observatories are vital tools for planetary defense.”


Notes

[1] A recent study conducted with the James Webb Space Telescope estimates the diameter of asteroid 2024 YR4 to be about 60 meters (197 feet). This measurement falls within the estimate range of the study discussed here and demonstrates the importance of independent measurements for improving our understanding of astronomical objects.

[2] The year 2029 has been proclaimed by the United Nations as the International Year of Asteroid Awareness and Planetary Defense.


More information

This research is presented in a paper titled “The discovery and characterization of Earth-crossing asteroid 2024 YR4” to appear in The Astrophysical Journal Letters.

The team is composed of Bryce T. Bolin (Eureka Scientific), Josef Hanuš (Charles University), Larry Denneau (University of Hawai‘i at Mānoa), Roberto Bonamico (BSA Osservatorio), Laura-May Abron (Griffith Observatory), Marco Delbo (Université Côte d'Azur; University of Leicester), Josef Ďurech (Charles University), Robert Jedicke (University of Hawai‘i at Mānoa), Leo Y. Alcorn (W. M. Keck Observatory), Aleksandar Cikota (International Gemini Observatory/NSF NOIRLab), Swayamtrupta Panda (International Gemini Observatory/NSF NOIRLab), and Henrique Reggiani (International Gemini Observatory/NSF NOIRLab).


NSF NOIRLab, the U.S. National Science Foundation center for ground-based optical-infrared astronomy, operates the International Gemini Observatory (a facility of NSF, NRC–Canada, ANID–Chile, MCTIC–Brazil, MINCyT–Argentina, and KASI–Republic of Korea), NSF Kitt Peak National Observatory (KPNO), NSF Cerro Tololo Inter-American Observatory (CTIO), the Community Science and Data Center (CSDC), and NSF–DOE Vera C. Rubin Observatory (in cooperation with DOE’s SLAC National Accelerator Laboratory). It is managed by the Association of Universities for Research in Astronomy (AURA) under a cooperative agreement with NSF and is headquartered in Tucson, Arizona.

The scientific community is honored to have the opportunity to conduct astronomical research on I’oligam Du’ag (Kitt Peak) in Arizona, on Maunakea in Hawai‘i, and on Cerro Tololo and Cerro Pachón in Chile. We recognize and acknowledge the very significant cultural role and reverence of I’oligam Du’ag to the Tohono O’odham Nation, and Maunakea to the Kanaka Maoli (Native Hawaiians) community.


Links


Contacts:

Bryce Bolin
Research Scientist
Eureka Scientific, Inc
Email:
bolin.astro@gmail.com

Josie Fenske
Jr. Public Information Officer
NSF NOIRLab
Email:
josie.fenske@noirlab.edu


Tuesday, April 08, 2025

How stars stay young and spin slowly

Growth of density (top row) and magnetic field strength (bottom row) as a function of time in the collision between two stars of 0.7 and 0.6 solar masses. After the first contact at t = 0 h (not shown), the two stars pass each other (t = 5 h) and get disrupted (t = 12 h). The magnetic fields begin to grow due to instabilities and compression.© MPA

Computer simulations suggest that the amplification of magnetic fields in stellar collisions may play an important role in the formation of a particular subset of stars in clusters. Blue straggler stars in clusters appear not only bluer, but also younger than other cluster members. One proposed explanation for their apparently different ages is that they are the result of stellar collisions. However, this would require the resulting star to spin down efficiently without losing too much mass. Scientists at the Max Planck Institute for Astrophysics have now shown, using sophisticated 3D simulations, that the energy of the magnetic field is greatly amplified in the collisions of low-mass stars, providing a potentially efficient spin-down mechanism.

Clusters of stars, containing hundreds of thousands of stars that formed around the same time and from the same molecular cloud, provide astronomers with an excellent laboratory for studying how stars of similar age, composition and mass evolve over time. However, one particular subset, the 'blue stragglers', pose a challenge: they appear bluer and brighter than the other cluster members, and therefore appear to be younger. Why don't they age like typical cluster stars?

The answer could be that they actually formed later than the other stars in stellar collisions and thus gained mass. However, since most collisions between two low-mass stars are off-axis (rather than perfectly head-on), the resulting massive star would rotate rapidly and lose most of its mass during the spin-down to a stable state – unless the spin-down is efficient. While many proposed spin-down mechanisms require magnetic fields, it has remained unclear for more than two decades whether they actually exist and whether they have the strength to play a significant role.

A team at the Max Planck Institute for Astrophysics (MPA) has now presented sophisticated 3D moving-mesh magnetohydrodynamical simulations of collisions between low-mass main-sequence stars, which show that the magnetic field energy is amplified by a factor of up to 10 billion during collisions. At the core of the merged star, the magnetic field can reach 100 million Gauss (for comparison, the magnetic field in sunspots can reach up to 5000 Gauss). "Our simulations showed that the magnetic field in stellar collisions can be amplified, which is a promising sign for an effective spin-down mechanism," says MPA postdoctoral researcher Taeho Ryu, who led the study. "This amplification is independent of collision parameters, so it could happen every time two stars collide in a cluster."

The simulations also show a flattened, rotating gas structure around the collision, which could indicate the formation of a disk. Magnetic braking and an effect called "disk locking" could further facilitate the spin-down. "Our next step will be to actually follow the long-term evolution after the collision to see how these stars evolve over millions or billions of years and whether they really end up as the blue straggler stars that we observe," adds Ryu.

This animation shows the same simulation as the figure above. The left panel shows the evolution of the density, the right panel the evolution of the magnetic field strength as two stars of 0.7 and 0.6 solar masses collide.


Contact:

Taeho Ryu
Postdoc
2358

tryu@mpa-garching.mpg.de


Original publication

Ryu, Taeho; Sills, Alison; Pakmor, Ruediger; de Mink, Selma; Mathieu, Robert
Magnetic Field Amplification during Stellar Collisions between Low-mass Stars
ApJ, Volume 980, Issue 2, id.L38, 11 pp.


Source | DOI


Monday, April 07, 2025

Swan song for stars and cameras

PN K 4-55 (Kohoutek 4-55)
A planetary nebula, a glowing shell of material thrown off by a star. A small central region of greenish clouds is encircled by a glowing, jagged ring, like a hole torn in fabric. A band of silvery-blue clouds outside this is again encircled by a larger, fainter yellow ring of gas. Puffy, smoky clouds of orange and red gas billow out from there into a large oval nebula, fading into the dark background of space. Credit: ESA/Hubble & NASA, K. Noll

Planetary nebulae are the spectacular final display at the end of a giant star’s life. Once a red giant star has exhausted its available fuel and shed its last layers of gas, its compact core will contract further, enabling a final burst of nuclear fusion. The exposed core reaches extremely hot temperatures, radiating very energetic ultraviolet light that energises the enormous clouds of cast-off gas. Molecules in the gas are ionised and glow brightly; here, red and orange indicate nitrogen molecules, green is hydrogen and blue shows oxygen in the nebula. Kohoutek 4-55 has an uncommon, multi-layered form: a bright inner ring is surrounded by a fainter layer of gas, all wrapped in a broad halo of ionised nitrogen. The spectacle is bittersweet, as the brief phase of fusion in the core will end after mere tens of thousands of years, leaving a white dwarf that will never illuminate the clouds around it again.

This image itself is also a swan song, the final work of one of Hubble’s instruments: the Wide Field and Planetary Camera 2 (WFPC2). Installed in 1993 to replace the original Wide Field and Planetary Camera, WFPC2 was responsible for some of Hubble’s most enduring images and fascinating discoveries. It in turn was replaced by the Wide Field Camera 3 in 2009, during Hubble’s final servicing mission. The data for this image were taken a mere ten days before the instrument was removed from the telescope, as a fitting send-off for WFPC2 after 16 years’ work. The latest and most advanced processing techniques have been used to bring the data to life one more time, producing this breathtaking new view of Kohoutek 4-55.


Sunday, April 06, 2025

20-Year Hubble Study of Uranus Yields New Atmospheric Insights

The image columns show the change of Uranus for the four years that STIS observed Uranus across a 20-year period. Over that span of time, the researchers watched the seasons of Uranus as the south polar region darkened going into winter shadow while the north polar region brightened as northern summer approaches. Credits/Image: NASA, ESA, Erich Karkoschka (LPL)


The ice-giant planet Uranus, which travels around the Sun tipped on its side, is a weird and mysterious world. Now, in an unprecedented study spanning two decades, researchers using NASA’s Hubble Space Telescope have uncovered new insights into the planet's atmospheric composition and dynamics. This was possible only because of Hubble’s sharp resolution, spectral capabilities, and longevity.

The team’s results will help astronomers to better understand how the atmosphere of Uranus works and responds to changing sunlight. These long-term observations provide valuable data for understanding the atmospheric dynamics of this distant ice giant, which can serve as a proxy for studying exoplanets of similar size and composition.

When Voyager 2 flew past Uranus in 1986, it provided a close-up snapshot of the sideways planet. What it saw resembled a bland, blue-green billiard ball. By comparison, Hubble chronicled a 20-year story of seasonal changes from 2002 to 2022. Over that period, a team led by Erich Karkoschka of the University of Arizona, and Larry Sromovsky and Pat Fry from the University of Wisconsin used the same Hubble instrument, STIS (the Space Telescope Imaging Spectrograph), to paint an accurate picture of the atmospheric structure of Uranus.

Uranus' atmosphere is mostly hydrogen and helium, with a small amount of methane and traces of water and ammonia. The methane gives Uranus its cyan color by absorbing the red wavelengths of sunlight.

The Hubble team observed Uranus four times in the 20-year period: in 2002, 2012, 2015, and 2022. They found that, unlike conditions on the gas giants Saturn and Jupiter, methane is not uniformly distributed across Uranus. Instead, it is strongly depleted near the poles. This depletion remained relatively constant over the two decades. However, the aerosol and haze structure changed dramatically, brightening significantly in the northern polar region as the planet approaches its northern summer solstice in 2030.

Uranus takes a little over 84 Earth years to complete a single orbit of the Sun. So, over two decades, the Hubble team has only seen mostly northern spring as the Sun moves from shining directly over Uranus’ equator toward shining almost directly over its north pole in 2030. Hubble observations suggest complex atmospheric circulation patterns on Uranus during this period. The data that are most sensitive to the methane distribution indicate a downwelling in the polar regions and upwelling in other regions.

The team analyzed their results in several ways. The image columns show the change of Uranus for the four years that STIS observed Uranus across a 20-year period. Over that span of time, the researchers watched the seasons of Uranus as the south polar region (left) darkened going into winter shadow while the north polar region (right) brightened as it began to come into a more direct view as northern summer approaches.

The top row, in visible light, shows how the color of Uranus appears to the human eye as seen through even an amateur telescope.

In the second row, the false-color image of the planet is assembled from visible and near-infrared light observations. The color and brightness correspond to the amounts of methane and aerosols. Both of these quantities could not be distinguished before Hubble's STIS was first aimed at Uranus in 2002. Generally, green areas indicate less methane than blue areas, and red areas show no methane. The red areas are at the limb, where the stratosphere of Uranus is almost completely devoid of methane.

The two bottom rows show the latitude structure of aerosols and methane inferred from 1,000 different wavelengths (colors) from visible to near infrared. In the third row, bright areas indicate cloudier conditions, while the dark areas represent clearer conditions. In the fourth row, bright areas indicate depleted methane, while dark areas show the full amount of methane.

At middle and low latitudes, aerosols and methane depletion have their own latitudinal structure that mostly did not change much over the two decades of observation. However, in the polar regions, aerosols and methane depletion behave very differently.

In the third row, the aerosols near the north pole display a dramatic increase, showing up as very dark during early northern spring, turning very bright in recent years. Aerosols also seem to disappear at the left limb as the solar radiation disappeared. This is evidence that solar radiation changes the aerosol haze in the atmosphere of Uranus. On the other hand, methane depletion seems to stay quite high in both polar regions throughout the observing period.

Astronomers will continue to observe Uranus as the planet approaches northern summer.

The Hubble Space Telescope has been operating for over three decades and continues to make ground-breaking discoveries that shape our fundamental understanding of the universe. Hubble is a project of international cooperation between NASA and ESA (European Space Agency). NASA's Goddard Space Flight Center in Greenbelt, Maryland, manages the telescope and mission operations. Lockheed Martin Space, based in Denver, also supports mission operations at Goddard. The Space Telescope Science Institute in Baltimore, which is operated by the Association of Universities for Research in Astronomy, conducts Hubble science operations for NASA.


aaa

Saturday, April 05, 2025

Monthly Roundup: News from the High-Energy Universe

The star-forming region 30 Doradus shines in this multiwavelength image from the Chandra X-ray Observatory, the Hubble Space Telescope, the Spitzer Space Telescope, and the Atacama Large Millimeter/submillimeter Array. This is the deepest X-ray image ever made of this region. Credit:
X-ray: NASA/CXC/Penn State Univ./L. Townsley et al.; Infrared: NASA/JPL-CalTech/SST; Optical: NASA/STScI/HST; Radio: ESO/NAOJ/NRAO/ALMA; Image Processing: NASA/CXC/SAO/J. Schmidt, N. Wolk, K. Arcand

Gamma-ray flux as a function of time since the neutrino’s arrival for different intergalactic magnetic field strengths. Stronger magnetic fields lead to lower flux and later arrival times. The gray lines show the five-sigma detection limits of different instruments. Credit: Fang et al. 2025

This Monthly Roundup covers three investigations of the high-energy universe, from a hunt for a cosmic particle accelerator in the Milky Way to an examination of a fading quasar in the distant past.

Investigating the Most Energetic Neutrino Ever Detected

In February 2023, the Cubic Kilometre Neutrino Telescope (KM3NeT) — a neutrino telescope at the bottom of the Mediterranean Sea — detected a particle called a muon with an energy of roughly 100 petaelectronvolts (a hundred quadrillion electronvolts). The muon was likely produced by an incoming neutrino with an energy of 220 petaelectronvolts — the highest-energy neutrino ever observed.

The orientation of the event suggests an astrophysical origin, but the source of this neutrino is unknown. One possibility is that the neutrino arose in a transient event that produced extremely high-energy cosmic rays: relativistic charged particles like protons, electrons, and atomic nuclei. Cosmic rays could produce neutrinos and gamma rays through interactions with photons of the cosmic microwave background. The neutrinos zip off into space, unhindered by intervening gas or magnetic fields, while the cosmic rays can be waylaid for thousands of years, caught up in the magnetic fields that lace the space between galaxies. Gamma rays fall in between the two extremes, slowed slightly by interactions with the photons of the extragalactic background. Repeated interactions between the gamma rays and background photons create a cascade of gamma rays across a range of energies.

Detecting this gamma-ray cascade would provide a valuable clue in the search for the origin of the ultra-high-energy neutrino detected in 2023. In a recent research article, Ke Fang (Wisconsin IceCube Particle Astrophysics Center) and collaborators estimated the flux of gamma rays that would be associated with this high-energy neutrino. The team’s estimates accounted for varying distances to the source as well as different strengths of the intergalactic magnetic field. The stronger the magnetic field, the weaker the gamma-ray flux when it arrives at Earth, and the later the arrival time at Earth.

For weak magnetic fields, the gamma-ray cascade should have arrived at Earth hours or days after the neutrino was detected in 2023. These gamma rays are potentially detectable as long as the magnetic field is weaker than 3 × 10-13 Gauss. For magnetic field strengths greater than 3 × 10-13 Gauss, the gamma rays wouldn’t arrive until more than a decade later, and they would likely be too faint to detect. If no gamma rays are detected, the non-detection could be used to place a lower limit on the strength of the intergalactic magnetic field.

LHAASO’s Water Cherenkov Detector Array (left) and Kilometer Square Array (right) observations of the region around the gamma-ray source HESS J1858+020. Black solid circles and black crosses represent extended and pointlike sources, respectively, resolved in this work. Dashed circles show sources resolved by LHAASO in previous work. The cyan symbols show the locations of gamma-ray sources identified by other facilities. Credit: LHAASO Collaboration 2025

The Hunt for a Galactic PeVatron

Across the universe, charged particles are being accelerated to near the speed of light, achieving energies in the petaelectronvolt, or PeV, range. The sources of these particles are called PeVatrons, and observations have revealed that these cosmic particle accelerators exist in the Milky Way. Supernovae, massive stars, pulsars, and pulsar wind nebulae are all candidate PeVatrons. To find out more, astronomers look to gamma rays, which can be produced when cosmic rays interact with dense matter.

Recently, the Large High Altitude Air Shower Observatory (LHAASO) collaboration investigated a possible galactic PeVatron called G35.6−0.4. G35.6−0.4 is a radio source that is thought to be associated with the gamma-ray source HESS J1858+020. Observations of this region show a supernova remnant and an H II region containing multiple X-ray point sources.

To learn more about the origins of the gamma rays from this complex region, the collaboration used data from LHAASO, a ground-based gamma-ray and cosmic-ray observatory. Data from two of LHAASO’s detectors show five gamma-ray sources throughout the region, one of which may be associated with the previously detected gamma-ray source HESS J1858+020. The team also amassed data from other sources, pulling together a picture of the molecular and atomic gas and massive stars present in the region.

Because of the crowded nature of this area, this investigation wasn’t able to clearly point to the source of the gamma rays. The authors outlined three possible sources for the gamma rays: 1) winds from hidden massive stars or outflows from protostars within the H II region, 2) particles escaping from the supernova remnant and interacting with nearby molecular clouds, and 3) an as-yet-undetected pulsar wind nebula. While none of these scenarios is a clear front-runner, neither could any of them be ruled out (though the supernova remnant scenario faces the greatest feasibility challenges). Future searches for massive stars or pulsar wind nebulae in this region may provide further clues.

JWST spectrum of the quasar HSC J2239+0207 (blue line)
Credit: Lyu et al. 2025

Fading Light from a Quasar at Cosmic Dawn

For the third and final article, we’re looking back into the distant past at one of the most powerful objects in the universe: a quasar. Quasars are extraordinarily luminous galactic centers in the early universe, powered by accretion of gas onto a growing black hole. Because of their extreme brightness, quasars are visible from billions of light-years away, giving researchers a glimpse into the early evolution of supermassive black holes.

Jianwei Lyu (吕建伟; University of Arizona) and collaborators investigated HSC J2239+0207, a quasar located at a redshift of z = 6.2498, when the universe was roughly 900 million years old. This redshift places the quasar near the end of the epoch of reionization, when the formation of the first stars and galaxies ionized the universe’s abundant neutral hydrogen gas. This quasar is an intriguing target because previous observations have shown that the black hole that powers it is roughly 15 times more massive than expected for the stellar mass of its host galaxy. The quasar’s accretion rate is low, indicating that the black hole may be nearing the end of its growth spurt.

Lyu’s team analyzed JWST spectra of this quasar, estimating the black hole’s mass to be roughly 300 million solar masses (about 75 times more massive than the Milky Way’s supermassive black hole) and its accretion rate to be just 40% of the theoretical limit. This is unusual, since quasars at this point in the universe’s history typically have accretion rates at or above the theoretical limit. The unexpectedly low accretion rate for HSC J2239+0207 could mean that the black hole’s growth is slowing down. However, the authors caution that it could be a temporary slowdown caused by a lack of fuel rather than a permanent shutdown.

The team also investigated a gas cloud located one arcsecond from the quasar. This object could be several things: an isolated high-redshift galaxy, a galaxy falling toward the quasar host galaxy, tidally disrupted material stripped from a galaxy passing nearby, or material blown out of the quasar host galaxy by the quasar itself. The authors favor this final scenario, which is indicative of black hole feedback at work.

Feedback may be the reason that this black hole is so massive compared to the stellar mass of its host galaxy. Powerful radiation and winds from the black hole could have suppressed the rate of star formation as the black hole grew. With the black hole’s activity winding down, star formation should have a chance to ramp up, bringing the galaxy into alignment with the expected stellar mass–black hole mass relation.

By Kerry Hensley

Citation

“Cascaded Gamma-Ray Emission Associated with the KM3NeT Ultrahigh-Energy Event KM3-230213A,” Ke Fang et al 2025 ApJL 982 L16. doi:10.3847/2041-8213/adbbec

“An Enigmatic PeVatron in an Area Around H II Region G35.6−0.5,” Zhen Cao et al 2025 ApJ 979 70. doi:10.3847/1538-4357/ad991d

“Fading Light, Fierce Winds: JWST Snapshot of a Sub-Eddington Quasar at Cosmic Dawn,” Jianwei Lyu et al 2025 ApJL 981 L20. doi:10.3847/2041-8213/adb613


Friday, April 04, 2025

Astronomers Find Giant Dinosaur of a Galaxy

This JWST image shows the Big Wheel galaxy (in the center) and its cosmic environment. The galaxy is a gigantic rotating disk lying 11.7 billion light-years away. Its spiral disk stretches across 100,000 light-years, making it larger than any other galaxy disk confirmed at this epoch of the universe. The blue blob and some of the other larger objects in the image are galaxies in the nearby universe. The smaller objects tend to be distant galaxies; however, the larger galaxy to the lower left of Big Wheel is part of the same remote galactic structure as Big Wheel. Credit: NASA/ESA


Newfound galaxy is one of the biggest ever found in distant universe

A team of astronomers has stumbled upon a humungous spiral galaxy, about five times more massive than our Milky Way galaxy and covering an area two times as big, making it among the largest known galaxies. The most surprising trait of the galaxy, however, is not its colossal size but the fact it existed in the early cosmos when the universe was only 2 billion years old.

"This galaxy is spectacular for being among the largest spiral galaxies ever found, which is unprecedented for this early era of the universe," says Charles (Chuck) Steidel (PhD '90), the Lee A. DuBridge Professor of Astronomy at Caltech. "Ultimately, this galaxy would have been stripped of gas and would not have survived to the modern day. It is like finding a live dinosaur, before it became extinct."

Steidel was part of an international team of astronomers, led by the University of Milano-Bicocca, that made the discovery and published its findings on March 17 in Nature Astronomy. The team's observations were made using James Webb Space Telescope (JWST), a partnership between NASA, the European Space Agency, and the Canadian Space Agency.

The researchers serendipitously noticed the large anomalous galaxy in JWST images taken of a nearby quasar—a powerful, active supermassive black hole. The team then followed up with JWST to learn more about the object's size, precise distance, rotation speed, and mass. Because the speed of light is finite, observations made of objects in the distant universe capture light from a bygone era. The JWST data revealed that the colossal specimen is not only surprisingly large, but also spins at great speeds. This led the team to nickname the galaxy "Big Wheel."

Prior to the discovery, it was thought that disk-shaped galaxies in the early universe were considerably smaller. (Disk galaxies include spiral galaxies as well as other flat, circular galaxies without spiral arms). Big Wheel is about three times larger than any previously discovered galaxies with similar masses at similar cosmic times, and it is also at least three times larger than what is predicted by current cosmological simulations. The galaxy's radius stretches across 100,00 light-years.

The finding begs the question: How did the galaxy get this big so fast? The team is not sure but suspects the answer has to do with the fact that it lives in a very dense area of space packed with a lot of young galaxies that will eventually coalesce into a giant cluster of gravitationally bound galaxies.

"Exceptionally dense environments such as the one hosting the Big Wheel are still a relatively unexplored territory," concludes co-author Sebastiano Cantalupo of the University of Milano-Bicocca. "Further targeted observations are needed to build a statistical sample of giant disks in the early universe and thus open a new window on the early stages of galaxy formation."

The Nature Astronomy study titled "A giant disk galaxy two billion years after the Big Bang," was funded by the European Research Council, the Fondazione Cariplo foundation, NASA, and the Australian Research Council.

Source: Caltech/News


Thursday, April 03, 2025

NASA Webb Explores Effect of Strong Magnetic Fields on Star Formation

Credits/Image: NASA, ESA, CSA, STScI, SARAO, Samuel Crowe (UVA), John Bally (CU), Ruben Fedriani (IAA-CSIC), Ian Heywood (Oxford)

Credits/Image: NASA, ESA, CSA, STScI, SARAO, Samuel Crowe (UVA), John Bally (CU), Ruben Fedriani (IAA-CSIC), Ian Heywood (Oxford)


Follow-up research on a 2023 image of the Sagittarius C stellar nursery in the heart of our Milky Way galaxy, captured by NASA’s James Webb Space Telescope, has revealed ejections from still-forming protostars and insights into the impact of strong magnetic fields on interstellar gas and the life cycle of stars.

“A big question in the Central Molecular Zone of our galaxy has been, if there is so much dense gas and cosmic dust here, and we know that stars form in such clouds, why are so few stars born here?” said astrophysicist John Bally of the University of Colorado Boulder, one of the principal investigators. “Now, for the first time, we are seeing directly that strong magnetic fields may play an important role in suppressing star formation, even at small scales.”

Detailed study of stars in this crowded, dusty region has been limited, but Webb’s advanced near-infrared instruments have allowed astronomers to see through the clouds to study young stars like never before.

“The extreme environment of the galactic center is a fascinating place to put star formation theories to the test, and the infrared capabilities of NASA’s James Webb Space Telescope provide the opportunity to build on past important observations from ground-based telescopes like ALMA and MeerKAT,” said Samuel Crowe, another principal investigator on the research, a senior undergraduate at the University of Virginia and a 2025 Rhodes Scholar.

Bally and Crowe each led a paper published in The Astrophysical Journal.

Using Infrared to Reveal Forming Stars

In Sagittarius C’s brightest cluster, the researchers confirmed the tentative finding from the Atacama Large Millimeter Array (ALMA) that two massive stars are forming there. Along with infrared data from NASA’s retired Spitzer Space Telescope and SOFIA (Stratospheric Observatory for Infrared Astronomy) mission, as well as the Herschel Space Observatory, they used Webb to determine that each of the massive protostars is already more than 20 times the mass of the Sun. Webb also revealed the bright outflows powered by each protostar.

Even more challenging is finding low-mass protostars, still shrouded in cocoons of cosmic dust. Researchers compared Webb’s data with ALMA’s past observations to identify five likely low-mass protostar candidates.

The team also identified 88 features that appear to be shocked hydrogen gas, where material being blasted out in jets from young stars impacts the surrounding gas cloud. Analysis of these features led to the discovery of a new star-forming cloud, distinct from the main Sagittarius C cloud, hosting at least two protostars powering their own jets.

“Outflows from forming stars in Sagittarius C have been hinted at in past observations, but this is the first time we’ve been able to confirm them in infrared light. It’s very exciting to see, because there is still a lot we don’t know about star formation, especially in the Central Molecular Zone, and it’s so important to how the universe works,” said Crowe.

Magnetic Fields and Star Formation

Webb’s 2023 image of Sagittarius C showed dozens of distinctive filaments in a region of hot hydrogen plasma surrounding the main star-forming cloud. New analysis by Bally and his team has led them to hypothesize that the filaments are shaped by magnetic fields, which have also been observed in the past by the ground-based observatories ALMA and MeerKAT (formerly the Karoo Array Telescope).

“The motion of gas swirling in the extreme tidal forces of the Milky Way’s supermassive black hole, Sagittarius A*, can stretch and amplify the surrounding magnetic fields. Those fields, in turn, are shaping the plasma in Sagittarius C,” said Bally.

The researchers think that the magnetic forces in the galactic center may be strong enough to keep the plasma from spreading, instead confining it into the concentrated filaments seen in the Webb image. These strong magnetic fields may also resist the gravity that would typically cause dense clouds of gas and dust to collapse and forge stars, explaining Sagittarius C’s lower-than-expected star formation rate.

“This is an exciting area for future research, as the influence of strong magnetic fields, in the center of our galaxy or other galaxies, on stellar ecology has not been fully considered,” said Crowe.

The James Webb Space Telescope is the world’s premier space science observatory. Webb is solving mysteries in our solar system, looking beyond to distant worlds around other stars, and probing the mysterious structures and origins of our universe and our place in it. Webb is an international program led by NASA with its partners, ESA (European Space Agency) and CSA (Canadian Space Agency).


About This Release

Credits:

Media Contact:

Leah Ramsay
Space Telescope Science Institute, Baltimore, Maryland

Christine Pulliam
Space Telescope Science Institute, Baltimore, Maryland

Permissions: Content Use Policy

Related Links and Documents


Wednesday, April 02, 2025

A galaxy that gives great feedback

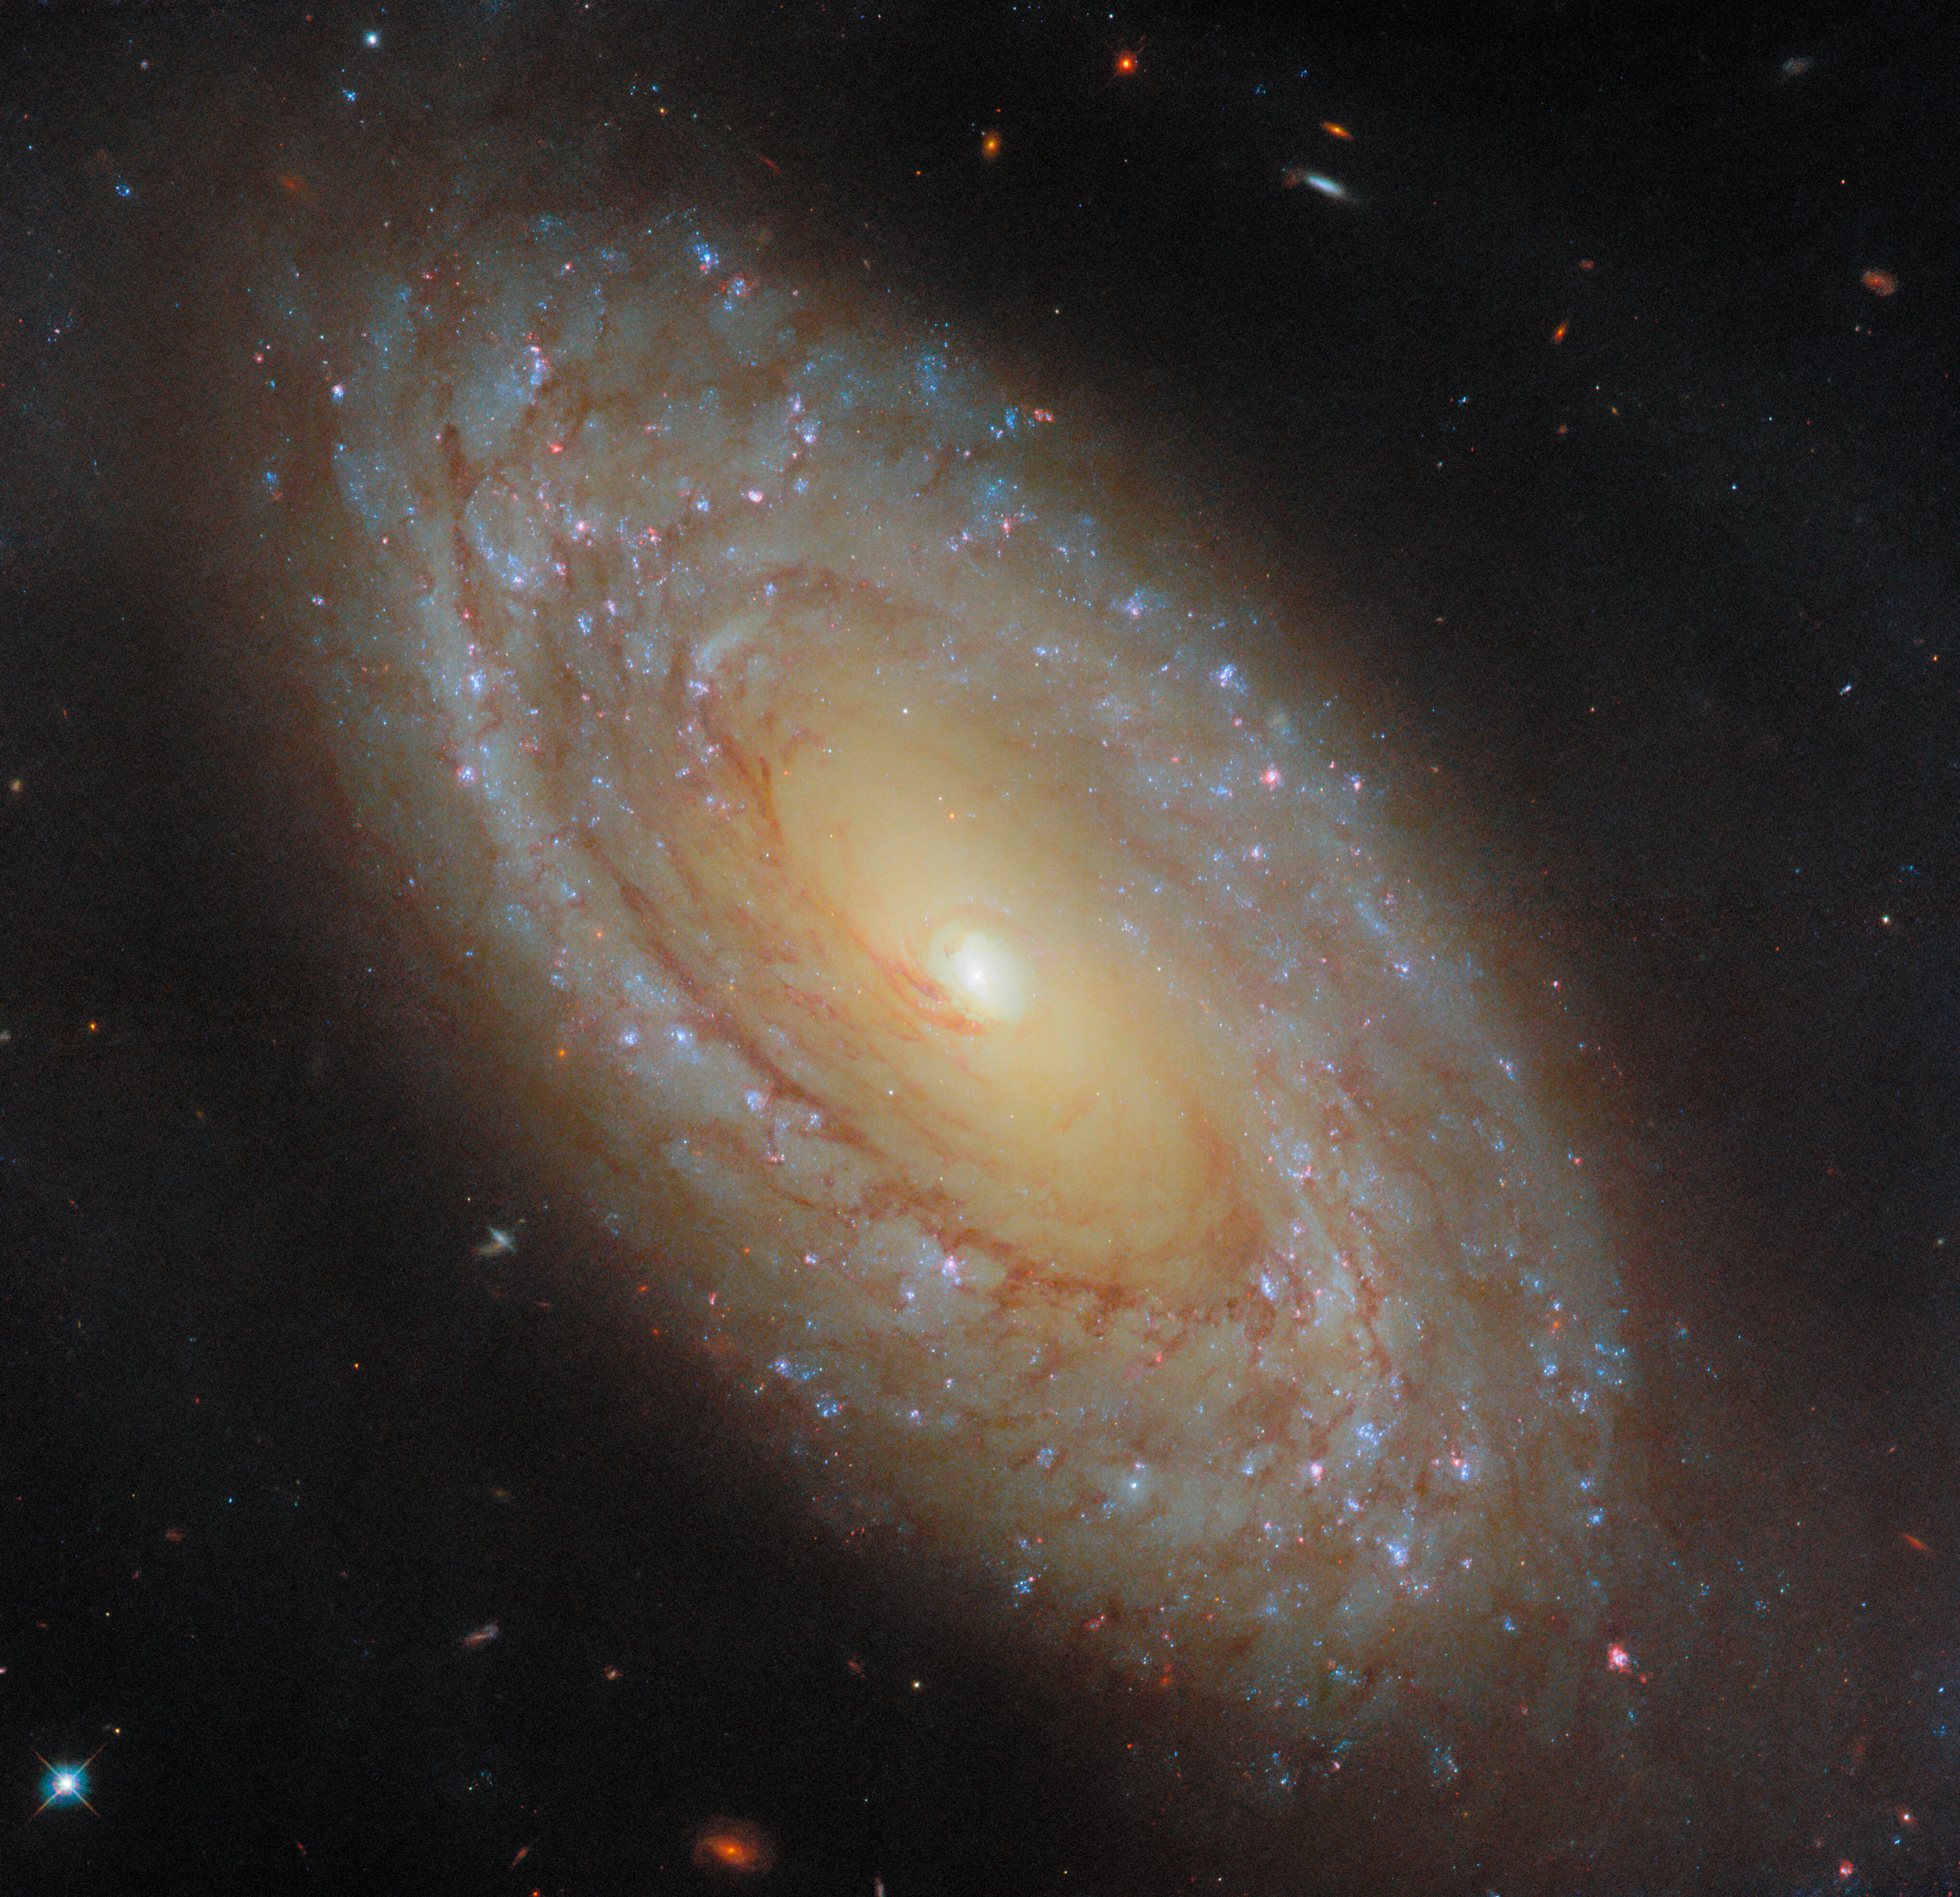
A spiral galaxy seen at a diagonal angle. Its very centre is a bright white glowing orb, surrounded by an inner disc of golden light. This is wrapped in a broad outer disc that glows more dimly, with patchy, broken spiral arms swirling around it, filled with small blue and pink star clusters. Dark reddish threads of dust also spiral through the disc, with some strands reaching into the core. Credit: ESA/Hubble & NASA, D. Thilker

This NASA/ESA Hubble Space Telescope Picture of the Week features the picturesque spiral galaxy NGC 4941, which lies about 67 million light-years from Earth in the constellation Virgo (The Maiden). Because this galaxy is nearby, cosmically speaking, Hubble’s keen instruments are able to pick out exquisite details such as individual star clusters and filamentary clouds of gas and dust.

The data used to construct this image were collected as part of an observing programme that investigates the star formation and stellar feedback cycle in nearby galaxies. As stars form in dense, cold clumps of gas, they begin to influence their surroundings. Stars heat and stir up the gas clouds in which they are born through winds, starlight, and — eventually, for massive stars — by exploding as supernovae. These processes are collectively called stellar feedback, and they impact the rate at which a galaxy can form new stars.

As it turns out, stars aren’t the only entities providing feedback in NGC 4941. At the heart of this galaxy lies an active galactic nucleus: a supermassive black hole feasting on gas. As the black hole amasses gas from its surroundings, the gas swirls into a superheated disc that glows brightly at wavelengths across the electromagnetic spectrum. Similar to stars — but on a much, much larger scale — active galactic nuclei shape their surroundings through winds, radiation, and powerful jets, altering not only star formation but also the evolution of the galaxy as a whole.


Spying a spiral through a cosmic lens


In the centre is an elliptical galaxy, seen as an oval-shaped glow around a small bright core. Around this is wrapped a broad band of light, appearing like a spiral galaxy stretched and warped into a ring, with bright blue lines drawn through it where the spiral arms have been stretched into circles. A few distant objects are visible around the ring on a black background. Credit: ESA/Webb, NASA & CSA, G. Mahler. Acknowledgement: M. A. McDonald

This new NASA/ESA/CSA James Webb Space Telescope Picture of the Month features a rare cosmic phenomenon called an Einstein ring. What at first appears to be a single, strangely shaped galaxy is actually two galaxies that are separated by a large distance. The closer foreground galaxy sits at the center of the image, while the more distant background galaxy appears to be wrapped around the closer galaxy, forming a ring.

Einstein rings occur when light from a very distant object is bent (or ‘lensed’) about a massive intermediate (or ‘lensing’) object. This is possible because spacetime, the fabric of the Universe itself, is bent by mass, and therefore light travelling through space and time is bent as well. This effect is much too subtle to be observed on a local level, but it sometimes becomes clearly observable when dealing with curvatures of light on enormous, astronomical scales, such as when the light from one galaxy is bent around another galaxy or galaxy cluster.

When the lensed object and the lensing object line up just so, the result is the distinctive Einstein ring shape, which appears as a full circle (as seen here) or a partial circle of light around the lensing object, depending on the precision of the alignment. Objects like these are the ideal laboratory in which to research galaxies too faint and distant to otherwise see.

The lensing galaxy at the center of this Einstein ring is an elliptical galaxy, as can be seen from the galaxy’s bright core and smooth, featureless body. This galaxy belongs to a galaxy cluster named SMACSJ0028.2-7537. The lensed galaxy wrapped around the elliptical galaxy is a spiral galaxy. Even though its image has been warped as its light travelled around the galaxy in its path, individual star clusters and gas structures are clearly visible.

The Webb data used in this image were taken as part of the Strong Lensing and Cluster Evolution (SLICE) survey (programme 5594), which is led by Guillaume Mahler at University of Liège in Belgium, and consists of a team of international astronomers. This survey aims to trace 8 billion years of galaxy cluster evolution by targeting 182 galaxy clusters with Webb’s Near-InfraRed Camera instrument. This image also incorporates data from two of the NASA/ESA Hubble Space Telescope’s instruments, the Wide Field Camera 3 and the Advanced Camera for Surveys.

Links


Tuesday, April 01, 2025

A New Cosmic Ruler: Measuring the Hubble Constant with Type II Supernovae

Figure 1: Type II supernova sample used for the Hubble constant measurement. The images show the host galaxies of the ten supernovae, with the explosion sites marked by red star symbols. The images are aligned with a redshift scale reflecting the relative distances of the supernovae from Earth. © MPA

Figure 2: Spectral fitting and the Hubble diagram for Type II supernovae. The top panels show two examples of spectral fits used to determine the supernova distances. By comparing observed spectra (black) with model predictions (colour), researchers can extract key physical properties and infer the intrinsic brightness, enabling a direct distance measurement. The bottom panel presents a Hubble diagram, where the measured luminosity distances of the supernovae are plotted against their redshifts. The data points represent individual spectral observations, meaning multiple measurements can exist for each supernova. The dashed black line represents the best-fit relationship between distance and redshift, and its slope is determined by the Hubble constant. The grey-shaded regions indicate the uncertainties for this fit (68% and 95% confidence intervals). The best-fit value for the Hubble constant and its 68% confidence interval are H₀ = 74.9 ± 1.9 km/s/Mpc. © MPA

Figure 3: Artist’s impression of the Hubble tension, showing the two different approaches to measuring the Hubble constant as two bridges that do not quite connect. The depicted early-Universe measurements yield an average value of 67.4 km/s/Mpc, the local measurements an average value of 73.0 km/s/Mpc. The new measurement from this study, based on Type II supernovae (orange), is completely independent of all other measurements and provides compelling support for the Hubble tension. The local route also includes results from various incarnations of the cosmic distance ladder, as well as other direct methods such as gravitational lensing and water masers. Image Credit: Original image by NOIRLab/NSF/AURA/J. da Silva, sourced from NOIRLab (CC BY 4.0), modified by S. Taubenberger.


The expansion rate of the Universe, quantified by the Hubble constant (H₀), remains one of the most debated quantities in cosmology. Measurements based on nearby objects yield a higher value than those inferred from observations of the early Universe—a discrepancy known as the "Hubble tension". Researchers at the Max Planck Institute for Astrophysics and their collaborators have now presented a new, independent determination of H₀ using Type II supernovae. By modeling the light from these exploding stars with advanced radiation transport techniques, they were able to directly measure distances without relying on the traditional distance ladder. The resulting H₀ value agrees with other local measurements and adds to the growing body of evidence for the Hubble tension, offering an important cross-check and a promising path toward resolving this cosmic puzzle.

One of the biggest puzzles in modern cosmology is the ongoing discrepancy in measurements of the Hubble constant (H₀) between local and early Universe probes, known as the “Hubble tension”. Since H₀ describes the current expansion rate of the Universe, it is a local quantity and can only be directly measured using nearby objects. In contrast, methods based on the early Universe, such as those using the cosmic microwave background (CMB), do not measure H₀ directly. Instead, they infer its value by assuming a cosmological model to extrapolate from the conditions 13 billion years ago to today. The fact that these two approaches yield conflicting values—with local distance-ladder measurements giving a higher H₀ than early-Universe methods—suggests that our standard cosmological model may be incomplete, potentially pointing to new physics.

Researchers at the Max Planck Institute for Astrophysics (MPA) and their collaborators have explored an independent way of measuring H₀ using Type II supernovae (SNe II). Unlike traditional approaches, this method does not rely on the cosmic distance ladder, making it a powerful cross-check against existing techniques. Their results provide a new, highly precise measurement of H₀ and further contribute to the debate over the expansion rate of the Universe.

Determining the Hubble constant requires accurate measurements of distances to astronomical objects at different redshifts. The most widely used technique, the cosmic distance ladder, relies on several interconnected steps: distances to nearby objects (such as Cepheid variable stars) are used to calibrate further reaching indicators such as Type Ia supernovae (SNe Ia), which then serve as standard candles to measure distances to faraway galaxies.

However, the reliance on multiple steps introduces possible systematic uncertainties, and different teams report slightly different results. A direct measurement based on known physics offers a valuable complementary approach, as it is affected by different systematics and does not depend on empirical calibrations. This is where Type II supernovae provide an exciting alternative.

Type II supernovae occur when massive, hydrogen-rich stars explode at the end of their lives. While their brightness varies depending on factors such as temperature, expansion velocity, and chemical composition, it can be accurately predicted using radiation transport models. This allows researchers to determine their intrinsic luminosity and use them as distance indicators, independent of empirical calibration methods.

A critical step in this process is identifying the best-fitting model for each observed supernova. Key physical properties leave distinct imprints on the supernova spectrum: temperature shapes the overall continuum, expansion velocity sets the width of spectral lines via Doppler broadening, and chemical composition determines the strength of specific absorption and emission features. By systematically comparing observed spectra to simulated spectra from radiative transfer models, researchers can find the model that most accurately describes the supernova’s physical conditions. With such a well-matched model the intrinsic brightness—and thus the distance—can be precisely determined.

To make this process efficient, the team used a spectral emulator, an advanced machine-learning tool trained on precomputed simulations. Instead of running time-intensive radiation transport calculations for every supernova, the emulator rapidly interpolates between models, allowing for fast and accurate spectral fitting.

The research team applied their spectral modeling approach to a sample of ten Type II supernovae at redshifts between 0.01 and 0.04, using publicly available data not specifically designed for distance measurements (Fig. 1). Despite the limitations of the dataset, their method yielded reliable distances. By constructing a Hubble diagram from these measurements (Fig. 2), they obtained an independent estimate of H₀: H₀ = 74.9 ± 1.9 km/s/Mpc

This value is consistent with most other local measurements, such as those from Cepheid-calibrated supernovae and supports the tension with early-Universe probes. The achieved precision is comparable to the most competitive techniques, demonstrating that Type II supernovae are a promising tool for cosmology (Fig. 3).

This study serves as a proof of concept, showing that Type II supernovae can provide precise and reliable distance measurements in the Hubble flow. Future work will focus on increasing the sample size and improving the accuracy of the technique by using dedicated observations. To this end, the researchers have assembled the adH0cc dataset (https://adh0cc.github.io/), a collection of Type II supernova observations from the ESO Very Large Telescope, specifically designed for precise distance measurements. This dataset will serve as a key resource for refining the method. By providing an independent check on the local determination of H₀, Type II supernovae help astrophysicists tackle one of the most pressing questions in cosmology today: Is the Hubble tension real, and if so, what does it tell us about the fundamental nature of the Universe?


Authors:

Christian Vogl
Postdoc
2297

cvogl@mpa-garching.mpg.de

Stefan Taubenberger
2019

tauben@mpa-garching.mpg.de

Wolfgang Hillebrandt
Emeritus Director


Original publication

Vogl, Christian; Taubenberger, Stefan; et al.
No rungs attached: A distance-ladder free determination of the Hubble constant through type II supernova spectral modelling
submitted to A&A