Tuesday, April 30, 2019

Scientists get to the bottom of a spitting black hole

Black hole spitting out ‘bullets’ of plasma
Copyright: ICRAR - Hi-res Image
Data from ESA’s Integral high-energy observatory have helped shed light on the workings of a mysterious black hole found spitting out ‘bullets’ of plasma while rotating through space.

The black hole is part of a binary system known as V404 Cygni and is sucking in material from a companion star. It is located in our Milky Way, some 8000 light-years away from Earth, and was first identified in 1989, when it caused a huge outburst of high-energy radiation and material.

After 26 years of dormancy, it woke up again in 2015, becoming for a short period of time the brightest object in the sky observable in high-energy X-rays.

Astronomers from all over the world pointed their ground and space-based telescopes towards the celestial object, and discovered that the black hole was behaving somewhat strangely.

A new study, based on data collected during the 2015 outburst, has now revealed the inner workings of this cosmic monster. The results are reported today in the journal Nature.

Black hole and companion star
Copyright: ICRAR - Hi-res Image

“During the outburst we observed details of the jet emissions when material is ejected at a very high speed from the vicinity of the black hole,” says Simone Migliari, an astrophysicist at ESA who is a co-author on the paper.

“We can see the jets shooting out in different directions on a timescale of less than an hour, which means that the inner regions of the system are rotating quite fast.”

Usually astronomers see the jets shooting straight out from the poles of black holes, perpendicular to the surrounding disc of material that is accreted from the companion star.

Previously, there had only been one black hole observed with a rotating jet. It was, however, rotating much slower, completing one cycle in about six months.

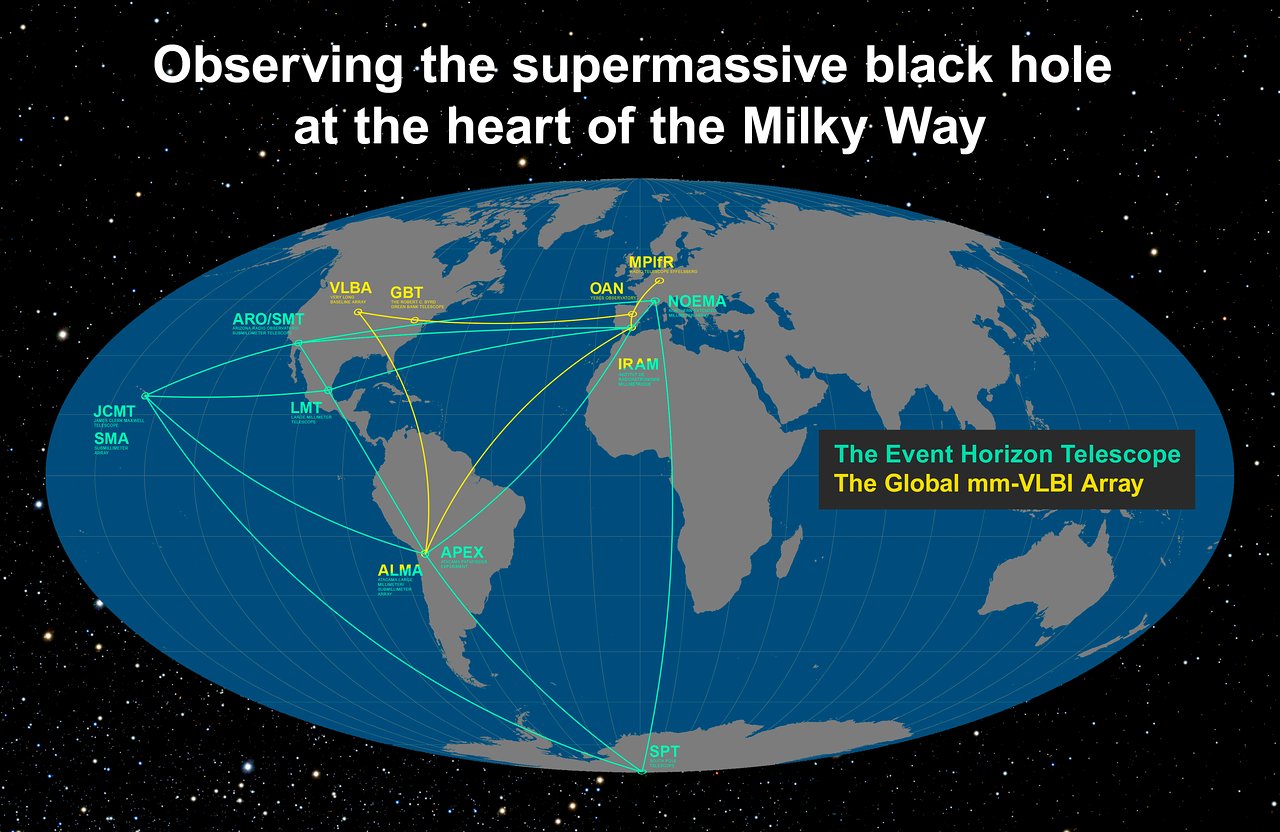
The astronomers could observe the V404 Cygni jets in radio waves using telescopes like those of the Very Long Baseline Array in the US.

Meanwhile, high-energy X-ray data from Integral and other space observatories helped them decode what was happening at the same time inside the inner region of the 10 million kilometre-wide accretion disc. This was important since it is the mechanics of the disc that causes the jet’s strange behaviour.

“What’s different in V404 Cygni is that we think the disc of material and the black hole are misaligned,” says Associate Professor James Miller-Jones, from the International Centre for Radio Astronomy Research (ICRAR) at Curtin University, Australia, who is the lead author of the new paper.

“This appears to be causing the inner part of the disc to wobble like a spinning top that is slowing down, and fire jets out in different directions as it changes orientation.”

Tilted accretion disc
Copyright: ICRAR - Hi-res Image

During the outburst, a large amount of the surrounding material was falling into the black hole at once, temporarily increasing the accretion rate of disc material towards the black hole and resulting in a sudden surge of energy. This was seen by Integral as an abrupt increase of the X-ray emission.

Integral’s observations were used to estimate the energy and geometry of the accretion onto the black hole, which in turn were crucial to understand the link between the incoming and outflowing material to create a complete picture of the situation. “With Integral, we were able to keep looking at V404 Cygni continuously for four weeks, while other high-energy satellites could only take shorter snapshots,” says Erik Kuulkers, Integral Project Scientist at ESA.

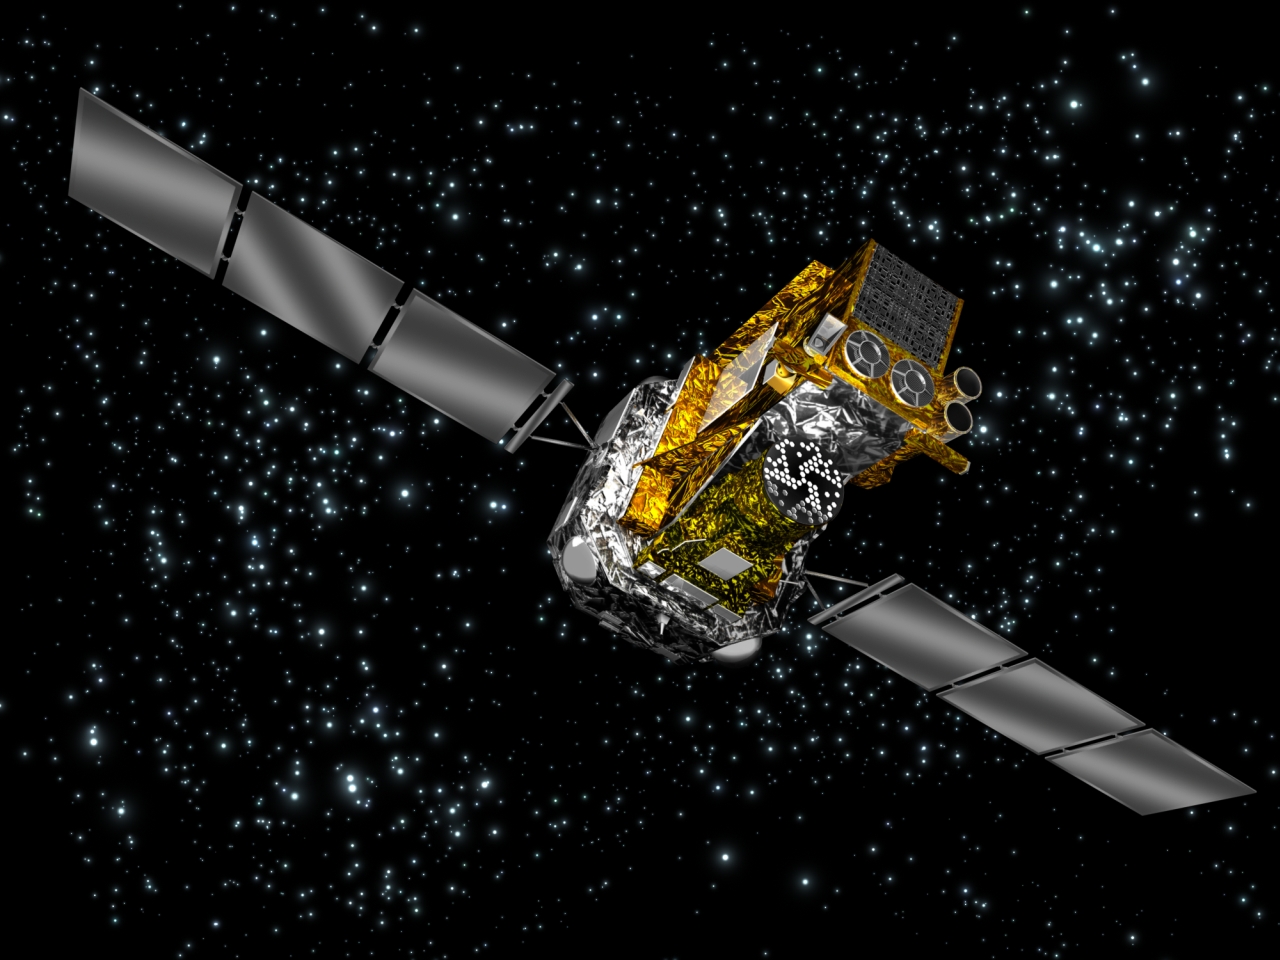
ESA’s Integral observatory is able to detect gamma-ray bursts, the most energetic phenomena in the Universe.

Integral high-energy observatory 
Copyright: ESA/Medialab -  Hi-res image

“The X-ray data support a model where the inner part of the accretion disc is tilted with respect to the rest of the system, most likely due to the spin of the black hole being inclined with respect to the orbit of the companion star,” explains Simone.

Scientists have been studying what caused this strange misalignment. One possibility is that the black hole spin axis may have been tilted by the ‘kick’ received during the supernova explosion that created it.

“The results would fit in a scenario, also studied in recent computer simulations, where the accretion flow in the vicinity of the black hole and the jets can rotate together,” says Erik.

“We should expect similar dynamics in any strongly-accreting black hole whose spin is misaligned with the inflowing gas, and we will have to take into account varying jet inclination angles when interpreting observations of black holes across the Universe.”  


Notes for editors

A rapidly-changing jet orientation in the stellar-mass black hole V404 Cygni” by J. C. A. Miller-Jones et al is published in Nature.

Integral, the International Gamma-ray Astrophysics Laboratory, was launched on 17 October 2002. It is an ESA project with instruments and a science data centre funded by ESA Member States (especially the Principal Investigator countries: Denmark, France, Germany, Italy, Spain and Switzerland), and with the participation of Russia and the USA. The mission is dedicated to spectroscopy and imaging of celestial gamma-ray sources in the energy range 15 keV to 10 MeV with concurrent source monitoring in X-ray (3–35 keV) and optical (V-band, 550 nm) wavelengths.


For further information, please contact:

Simone Migliari
Aurora Technology for ESA
European Space Agency
Email: smigliari@sciops.esa.int

Erik Kuulkers
Integral Project Scientist
European Space Agency
Email: ekuulker@sciops.esa.int

James Miller-Jones
Associate Professor
International Centre for Radio Astronomy Research (ICRAR)
Curtin University, Australia
Email: james.miller-jones@icrar.org

Pete Wheeler
Outreach, Education and Communications Manager
International Centre for Radio Astronomy Research (ICRAR)
Email: pete.wheeler@icrar.org

Markus Bauer


ESA Science Programme Communication Officer
Tel: +31 71 565 6799


Mob: +31 61 594 3 954


Email: markus.bauer@esa.int


Monday, April 29, 2019

Science Public/Images About Careers Contact Change page style: Making Good Use of Bad Weather: Finding Metal-poor Stars Through the Clouds

Figure 1. Equatorial and Galactic coordinate distribution of the stars observed with Gemini North and Gemini South in poor weather conditions.

The Gemini telescopes helped identify low-metallicity stars by gathering medium-resolution spectroscopic GMOS data for 666 bright stars under poor weather conditions. These data provide a unique opportunity to explore the chemical evolution of the Milky Way and look at the enrichment of star-forming gas clouds in the early Universe. 
 
Note: Below are highlights from an article published in the April 2019 issue of GeminiFocus by Principal Investigator Vinicius Placco of the University of Notre Dame. The original papers were published in The Astrophysical Journal and The Astronomical Journal

Low-metallicity stars (stars with less than 1% of the elements heavier than Hydrogen and Helium than the Sun contains) are the Rosetta Stones of stellar astrophysics. Encoded in the atmosphere of these low-mass, long-lived relics are the signatures of the processes by which the first chemical elements were cooked up, perhaps as early as a few tens of millions of years after the Big Bang. These stars are believed to be the direct descendants of the first stars to be born in the Universe, which were massive and short-lived. Hence, second-generation, low-metallicity stars are the artifacts which help us write the ancient chemical history of the Universe.

In particular, the Extremely Metal-Poor stars (EMP - with iron abundances of 1/1,000 of the solar value) are believed to carry in their atmospheres the chemical fingerprints of the evolution of as few as one first-generation massive star. EMP stars are intrinsically rare (less than 30 stars identified to date with iron abundances of 1/10,000 of the solar value) and the majority (more than 60%) show a very strong molecular carbon signature in their optical spectrum. The low-metallicity and strong carbon also affect the colors of these stars in optical wavelengths. Taking advantage of this, we were able to preselect bright candidates from two public stellar databases — the RAdial Velocity Experiment (RAVE) and the Best & Brightest Survey (B&B). We then used the Gemini Multi-Object Spectrograph (GMOS; North and South) with the B600 gratings and 1-arcsecond slits to obtain the spectra of 666 stars (see Figure 1).

In total, seven GMOS Poor Weather programs were executed (three in the North and four in the South) spanning four semesters (from 2015A to 2016B). Those programs had 310 hours of allocated time, and, assuming the 666 targets took 222 hours of observing time, the efficiency was around 72%, meaning that only 28% of the already poor weather was lost, which is a great accomplishment for the program and the Observatory.

The spectra gathered at Gemini/GMOS are of sufficient quality (signal-to-noise ratios and spectral resolution) to allow for the determination of stellar atmospheric parameters: effective temperature, surface gravity, metallicity, and carbon abundance. A subset of these stars were then re-observed in higher-resolution, so it was possible to determine their full chemical abundance pattern. There is already a study published based on the extremely metal-poor star J2005-3057, first identified at Gemini (Cain et al., 2018). We are also gathering high-resolution data for the most carbon-enhanced stars identified by Gemini and the results are also promising. In the near future, such bright stars will be perfect targets for high-resolution spectroscopic follow-up with GHOST, which will be a great asset in pushing these efforts forward.


Friday, April 26, 2019

The Giant Galaxy Around the Giant Black Hole

The galaxy M87, imaged here by NASA's Spitzer Space Telescope, is home to a supermassive black hole that spews two jets of material out into space at nearly the speed of light. The inset shows a close-up view of the shockwaves created by the two jets.Credit: NASA/JPL-Caltech/IPAC. Full image and caption

The galaxy M87 looks like a hazy, blue space-puff in this image from NASA's Spitzer Space Telescope. At the galaxy's center is a supermassive black hole that spews two jets of material out into space. Credit: NASA/JPL-Caltech/IPAC. Hi-res image

This wide-field image of the galaxy M87 was taken by NASA's Spitzer Space Telescope. The top inset shows a close-up of two shockwaves, created by a jet emanating from the galaxy's supermassive black hole. The Event Horizon Telescope recently took a close-up image of the silhouette of that black hole, show in the second inset.Credit: NASA/JPL-Caltech/Event Horizon Telescope Collaboration. Hi-res image


On April 10, 2019, the Event Horizon Telescope (EHT) unveiled the first-ever image of a black hole's event horizon, the area beyond which light cannot escape the immense gravity of the black hole. That giant black hole, with a mass of 6.5 billion Suns, is located in the elliptical galaxy Messier 87 (M87). EHT is an international collaboration whose support in the U.S. includes the National Science Foundation.

This image from NASA's Spitzer Space Telescope shows the entire M87 galaxy in infrared light. The EHT image, by contrast, relied on light in radio wavelengths and showed the black hole's shadow against the backdrop of high-energy material around it.

Located about 55 million light-years from Earth, M87 has been a subject of astronomical study for more than 100 years and has been imaged by many NASA observatories, including the Hubble Space Telescope, the Chandra X-ray Observatory and NuSTAR. In 1918, astronomer Heber Curtis first noticed "a curious straight ray" extending from the galaxy's center. This bright jet of high-energy material, produced by a disk of material spinning rapidly around the black hole, is visible in multiple wavelengths of light, from radio waves through X-rays. When the particles in the jet impact the interstellar medium (the sparse material filling the space between stars in M87), they create a shockwave that radiates in infrared and radio wavelengths of light but not visible light. In the Spitzer image, the shockwave is more prominent than the jet itself.

The brighter jet, located to the right of the galaxy's center, is traveling almost directly toward Earth. Its brightness is amplified due to its high speed in our direction, but even more so because of what scientists call "relativistic effects," which arise because the material in the jet is traveling near the speed of light. The jet's trajectory is just slightly offset from our line of sight with respect to the galaxy, so we can still see some of the length of the jet. The shockwave begins around the point where the jet appears to curve down, highlighting the regions where the fast-moving particles are colliding with gas in the galaxy and slowing down.

The second jet, by contrast, is moving so rapidly away from us that the relativistic effects render it invisible at all wavelengths. But the shockwave it creates in the interstellar medium can still be seen here.

Located on the left side of the galaxy's center, the shockwave looks like an inverted letter "C." While not visible in optical images, the lobe can also be seen in radio waves, as in this image from the National Radio Astronomy Observatory's Very Large Array.

By combining observations in the infrared, radio waves, visible light, X-rays and extremely energetic gamma rays, scientists can study the physics of these powerful jets. Scientists are still striving for a solid theoretical understanding of how gas being pulled into black holes creates outflowing jets.

Infrared light at wavelengths of 3.4 and 4.5 microns are rendered in blue and green, showing the distribution of stars, while dust features that glow brightly at 8.0 microns are shown in red. The image was taken during Spitzer's initial "cold" mission.

The Jet Propulsion Laboratory in Pasadena, California, manages the Spitzer Space Telescope mission for NASA's Science Mission Directorate in Washington. Science operations are conducted at the Spitzer Science Center at Caltech in Pasadena. Space operations are based at Lockheed Martin Space Systems in Littleton, Colorado. Data are archived at the Infrared Science Archive housed at IPAC at Caltech. Caltech manages JPL for NASA.


More information on Spitzer can be found at its website:  http://www.spitzer.caltech.edu/

News Media Contact

Calla Cofield
Jet Propulsion Laboratory, Pasadena, Calif.
626-808-2469

calla.e.cofield@jpl.nasa.gov


Thursday, April 25, 2019

Mystery of the Universe’s Expansion Rate Widens With New Hubble Data

This is a ground-based telescope's view of the Large Magellanic Cloud, a satellite galaxy of our Milky Way. The inset image, taken by the Hubble Space Telescope, reveals one of many star clusters scattered throughout the dwarf galaxy. The cluster members include a special class of pulsating star called a Cepheid variable, which brightens and dims at a predictable rate that corresponds to its intrinsic brightness. Once astronomers determine that value, they can measure the light from these stars to calculate an accurate distance to the galaxy. When the new Hubble observations are correlated with an independent distance measurement technique to the Large Magellanic Cloud (using straightforward trigonometry), the researchers were able to strengthen the foundation of the so-called "cosmic distance ladder." This "fine-tuning" has significantly improved the accuracy of the rate at which the universe is expanding, called the Hubble constant. Credits: NASA, ESA, A. Riess (STScI/JHU) and Palomar Digitized Sky Survey. Hi-res image

Astronomers using NASA's Hubble Space Telescope say they have crossed an important threshold in revealing a discrepancy between the two key techniques for measuring the universe's expansion rate. The recent study strengthens the case that new theories may be needed to explain the forces that have shaped the cosmos.

A brief recap: The universe is getting bigger every second. The space between galaxies is stretching, like dough rising in the oven. But how fast is the universe expanding? As Hubble and other telescopes seek to answer this question, they have run into an intriguing difference between what scientists predict and what they observe.

Hubble measurements suggest a faster expansion rate in the modern universe than expected, based on how the universe appeared more than 13 billion years ago. These measurements of the early universe come from the European Space Agency's Planck satellite. This discrepancy has been identified in scientific papers over the last several years, but it has been unclear whether differences in measurement techniques are to blame, or whether the difference could result from unlucky measurements.

The latest Hubble data lower the possibility that the discrepancy is only a fluke to 1 in 100,000. This is a significant gain from an earlier estimate, less than a year ago, of a chance of 1 in 3,000.

These most precise Hubble measurements to date bolster the idea that new physics may be needed to explain the mismatch.

"The Hubble tension between the early and late universe may be the most exciting development in cosmology in decades," said lead researcher and Nobel laureate Adam Riess of the Space Telescope Science Institute (STScI) and Johns Hopkins University, in Baltimore, Maryland. "This mismatch has been growing and has now reached a point that is really impossible to dismiss as a fluke. This disparity could not plausibly occur just by chance."

Tightening the bolts on the 'cosmic distance ladder'

Scientists use a "cosmic distance ladder" to determine how far away things are in the universe. This method depends on making accurate measurements of distances to nearby galaxies and then moving to galaxies farther and farther away, using their stars as milepost markers. Astronomers use these values, along with other measurements of the galaxies' light that reddens as it passes through a stretching universe, to calculate how fast the cosmos expands with time, a value known as the Hubble constant. Riess and his SH0ES (Supernovae H0 for the Equation of State) team have been on a quest since 2005 to refine those distance measurements with Hubble and fine-tune the Hubble constant.

In this new study, astronomers used Hubble to observe 70 pulsating stars called Cepheid variables in the Large Magellanic Cloud. The observations helped the astronomers "rebuild" the distance ladder by improving the comparison between those Cepheids and their more distant cousins in the galactic hosts of supernovas. Riess's team reduced the uncertainty in their Hubble constant value to 1.9% from an earlier estimate of 2.2%.

As the team's measurements have become more precise, their calculation of the Hubble constant has remained at odds with the expected value derived from observations of the early universe's expansion. Those measurements were made by Planck, which maps the cosmic microwave background, a relic afterglow from 380,000 years after the big bang.

The measurements have been thoroughly vetted, so astronomers cannot currently dismiss the gap between the two results as due to an error in any single measurement or method. Both values have been tested multiple ways.

"This is not just two experiments disagreeing," Riess explained. "We are measuring something fundamentally different. One is a measurement of how fast the universe is expanding today, as we see it. The other is a prediction based on the physics of the early universe and on measurements of how fast it ought to be expanding. If these values don't agree, there becomes a very strong likelihood that we're missing something in the cosmological model that connects the two eras."

How the new study was done

Astronomers have been using Cepheid variables as cosmic yardsticks to gauge nearby intergalactic distances for more than a century. But trying to harvest a bunch of these stars was so time-consuming as to be nearly unachievable. So, the team employed a clever new method, called DASH (Drift And Shift), using Hubble as a "point-and-shoot" camera to snap quick images of the extremely bright pulsating stars, which eliminates the time-consuming need for precise pointing.

This illustration shows the three basic steps astronomers use to calculate how fast the universe expands over time, a value called the Hubble constant. All the steps involve building a strong "cosmic distance ladder," by starting with measuring accurate distances to nearby galaxies and then moving to galaxies farther and farther away. This "ladder" is a series of measurements of different kinds of astronomical objects with an intrinsic brightness that researchers can use to calculate distances. Among the most reliable for shorter distances are Cepheid variables, stars that pulsate at predictable rates that indicate their intrinsic brightness. Astronomers recently used the Hubble Space Telescope to observe 70 Cepheid variables in the nearby Large Magellanic Cloud to make the most precise distance measurement to that galaxy. Astronomers compare the measurements of nearby Cepheids to those in galaxies farther away that also include another cosmic yardstick, exploding stars called Type Ia supernovas. These supernovas are much brighter than Cepheid variables. Astronomers use them as "milepost markers" to gauge the distance from Earth to far-flung galaxies. Each of these markers build upon the previous step in the "ladder." By extending the ladder using different kinds of reliable milepost markers, astronomers can reach very large distances in the universe. Astronomers compare these distance values to measurements of an entire galaxy's light, which increasingly reddens with distance, due to the uniform expansion of space. Astronomers can then calculate how fast the cosmos is expanding: the Hubble constant. Credits: NASA, ESA and A. Feild (STScI). Hi-res image

Download Hubble Constant Infographic as PDF

"When Hubble uses precise pointing by locking onto guide stars, it can only observe one Cepheid per each 90-minute Hubble orbit around Earth. So, it would be very costly for the telescope to observe each Cepheid," explained team member Stefano Casertano, also of STScI and Johns Hopkins. "Instead, we searched for groups of Cepheids close enough to each other that we could move between them without recalibrating the telescope pointing. These Cepheids are so bright, we only need to observe them for two seconds. This technique is allowing us to observe a dozen Cepheids for the duration of one orbit. So, we stay on gyroscope control and keep 'DASHing' around very fast."

The Hubble astronomers then combined their result with another set of observations, made by the Araucaria Project, a collaboration between astronomers from institutions in Chile, the U.S., and Europe. This group made distance measurements to the Large Magellanic Cloud by observing the dimming of light as one star passes in front of its partner in eclipsing binary-star systems.

The combined measurements helped the SH0ES Team refine the Cepheids' true brightness. With this more accurate result, the team could then "tighten the bolts" of the rest of the distance ladder that extends deeper into space.

The new estimate of the Hubble constant is 74 kilometers (46 miles) per second per megaparsec. This means that for every 3.3 million light-years farther away a galaxy is from us, it appears to be moving 74 kilometers (46 miles) per second faster, as a result of the expansion of the universe. The number indicates that the universe is expanding at a 9% faster rate than the prediction of 67 kilometers (41.6 miles) per second per megaparsec, which comes from Planck's observations of the early universe, coupled with our present understanding of the universe.

So, what could explain this discrepancy?

One explanation for the mismatch involves an unexpected appearance of dark energy in the young universe, which is thought to now comprise 70% of the universe's contents. Proposed by astronomers at Johns Hopkins, the theory is dubbed "early dark energy," and suggests that the universe evolved like a three-act play.

Astronomers have already hypothesized that dark energy existed during the first seconds after the big bang and pushed matter throughout space, starting the initial expansion. Dark energy may also be the reason for the universe's accelerated expansion today. The new theory suggests that there was a third dark-energy episode not long after the big bang, which expanded the universe faster than astronomers had predicted. The existence of this "early dark energy" could account for the tension between the two Hubble constant values, Riess said.

Another idea is that the universe contains a new subatomic particle that travels close to the speed of light. Such speedy particles are collectively called "dark radiation" and include previously known particles like neutrinos, which are created in nuclear reactions and radioactive decays.

Yet another attractive possibility is that dark matter (an invisible form of matter not made up of protons, neutrons, and electrons) interacts more strongly with normal matter or radiation than previously assumed.

But the true explanation is still a mystery.

Riess doesn't have an answer to this vexing problem, but his team will continue to use Hubble to reduce the uncertainties in the Hubble constant. Their goal is to decrease the uncertainty to 1%, which should help astronomers identify the cause of the discrepancy.

The team's results have been accepted for publication in The Astrophysical Journal.

The Hubble Space Telescope is a project of international cooperation between NASA and ESA (European Space Agency). NASA's Goddard Space Flight Center in Greenbelt, Maryland, manages the telescope. The Space Telescope Science Institute (STScI) in Baltimore, Maryland, conducts Hubble science operations. STScI is operated for NASA by the Association of Universities for Research in Astronomy in Washington, D.C.

Donna Weaver / Ray Villard
Space Telescope Science Institute, Baltimore, Md.
410-338-4493 / 410-338-4514
dweaver@stsci.edu / villard@stsci.edu

Adam Riess
Space Telescope Science Institute, Baltimore, Md.
and Johns Hopkins University, Baltimore, Md.
410-338-6707
ariess@stsci.edu

Claire Andreoli
NASA's Goddard Space Flight Center, Greenbelt, Md.
301-286-1940
claire.andreoli@nasa.gov

Editor: Rob Garner

Source: NASA/Hubble


Wednesday, April 24, 2019

The Giant In Our Backyard

Artist impression of the heart of galaxy NGC 1068, which harbors an actively feeding supermassive black hole.
Credit: NRAO/AUI/NSF; D. Berry / Skyworks

The center of our Milky Way Galaxy is only clearly visible to radio telescopes. The supermassive black hole in its core is glaring in radio waves, surrounded by the smoke rings of supernova remnants and the arcs of material caught in the core's strong magnetic fields. This gigantic image was pieced together by multiple observations taken by the Very Large Array (VLA). Credit: NRAO/AUI/NSF. Hi-Res File

Top left: Simulation of Sgr A* at 86 GHz. Top right: Simulation with added effects of scattering. Bottom right: Scattered image from the observations, this is how we see Sgr A* on the sky. Bottom left: The unscattered image, after removing the effects of scattering along our line of sight, this is how Sgr A* really looks like. Credit: S. Issaoun, M. Mościbrodzka, Radboud University/ M. D. Johnson, CfA. Hi-Res File

This infographic details the locations of the participating telescopes of the Event Horizon Telescope (EHT) and the Global mm-VLBI Array (GMVA). Their goal is to image, for the very first time, the shadow of the event horizon of the supermassive black hole at the center of the Milky Way, as well as to study the properties of the accretion and outflow around the Galactic Centre. Credit: ESO/O. Furtak. Hi-Res File


Synopsis: Recently, a collection of radio observatories combined to form the GMVA, a powerful tool that probed the region near our galaxy’s supermassive black hole. This produced curious images of this region, glowing brightly in millimeter-wavelength radio light. These observations, which involved three U.S. radio telescopes – VLA, VLBA, and GBT – are an important step toward observing the event horizon of a supermassive black hole. Here is this story of this quest so far:

There is a giant in our backyard. We know it’s there, but no one has ever seen it. It’s a supermassive black hole , and it lurks in the center of our galaxy.

In 1931, engineer Karl Jansky first observed a strong cosmic radio signal emanating from the constellation Sagittarius, which lies in the direction to the center of our galaxy. Jansky assumed that the radio signals originated from the center of our galaxy, but he had no idea what that source could be and his telescope was incapable pinpointing the location of the exact source. That happened in 1974, when Bruce Balick and Robert Brown used three radio dishes at Green Bank Observatory and a fourth smaller dish about 35 km away to form a vastly more precise radio telescope called an interferometer.

An interferometer is a way to use multiple radio telescopes or antennas as a single virtual telescope. When two antenna dishes are pointed at the same object in the sky they receive the same signal, but the signals are out of sync because it takes a bit longer to reach one antenna than the other. The time difference depends upon the direction of the antennas and their spacing apart from each other. By correlating the two signals you can determine the location of the source very precisely. With the Green Bank Interferometer, Balick and Brown confirmed the radio source as a small region near the galactic center. Brown later named the source Sagittarius A*, or Sgr A* for short.

The Green Bank Interferometer was a precursor to NRAO’s Very Large Array (VLA). The VLA has an array of 28 antennas capable of both widely separated and closely spaced configurations, making it the perfect tool for studying Sgr A*. In 1983, a team led by Ron Ekers used the VLA to make the first radio image of the Galactic Center, which revealed a mini-spiral of hot gas. Later observations showed not only the spiral of gas, but also a distinct and bright radio source at the exact center of the Milky Way.

By this time it was strongly suspected that this radio source was a massive black hole. From 1982 to 1998, Don Backer and Dick Sramek at the VLA measured the position of Sgr A* and found that it had almost no apparent motion. This meant it must be extremely massive since the gravitational tugs of nearby stars weren’t moving it about. They estimated it must have a mass at least two million times larger than the Sun. Long-term observations of stars orbiting the Galactic Center

have found Sgr A* to be about 3.6 million solar masses, and precise radio imaging has confirmed it can be no larger than the orbit of Mercury. We now know it is indeed a supermassive black hole.

Knowing a black hole is there isn’t the same as seeing it directly. Astronomers have long dreamed of directly observing a black hole, and perhaps even glimpsing its event horizon . Sagittarius A* is the closest supermassive black hole to Earth, so there have been various efforts to observe it directly. But there are two big challenges to be overcome. The first is that the center of our galaxy is surrounded by dense gas and dust. Almost all the visible light from the region is obscured, so we can’t observe the black hole with an optical telescope. Fortunately, the gas and dust are relatively transparent to radio light, so radio telescopes can see to the heart of our galaxy. But this leads to the second major challenge: resolution.

Although the Sgr A* black hole is massive, it is only about the size of a large star. According to Einstein’s theory of general relativity, a black hole of 3.6 million solar masses would have an event horizon only 15 times wider than the Sun. Since the Galactic Center is about 26,000 light years away from Earth, the black hole appears very small in the sky, about the same apparent size as a baseball sitting on the surface of the Moon. To see a radio object that small, you’d need a telescope the size of Earth itself.

Obviously, we can’t build a radio telescope the size of our planet, but with radio interferometry we can build a virtual Earth-sized telescope. NRAO observatories are currently working with two projects trying to observe a black hole, the Event Horizon Telescope (EHT) and the Global mm-VLBI Array (GMVA). The Atacama Large Millimeter/submillimeter Array (ALMA) is participating in both projects, while the Green Bank Telescope (GBT) and the Very Long Baseline Array (VLBA)

are part of GMVA. Just like the Very Large Array, these projects combine signals from multiple antennas. Since the antennas are located all over the world, this virtual telescope is about the size of the Earth. But unlike the VLA antennas, they all have different sizes and sensitivities. This diversity of antennas makes it more difficult to combine signals, but it also gives the projects a big advantage.

In the VLA, for example, all the antennas of the array are identical. Each antenna contributes equally, and the sensitivity of the array depends upon the size of a single antenna. But when telescopes, or antennas of different sizes, are combined, the sensitivity of the larger antennas helps boost the sensitivity of the smaller ones. The Green Bank Telescope, for example, has a diameter of 100 meters. When combined with smaller telescopes in a large interferometer, the total sensitivity depends upon the average size of all the antennas. This makes the ALMA array — connected to the EHT and the GMVA — and the GBT — linked to the GMVA — much more sensitive to signals from the Milky Way’s black hole, and we’ll need all the sensitivity we can get to capture the image of a black hole.

In January of 2019, GMVA captured an image of Sagittarius A* at 3mm wavelengths, but the scattering of 3mm light by the plasma between us and Sgr A* made it impossible to see the shadow of its event horizon. The first clear image of a black hole was announced by the Event Horizon Telescope in April 2019. It was an image of the black hole in the galaxy M87. While M87 is more than 2,000 times more distant than the black hole in the center of our galaxy, its black hole is also 1,500 times more massive. It’s a very active black hole, and not obscured by the gas and dust in our galaxy, making it easier to observe. Observing our smaller, quieter black hole is a bigger challenge. But by working with observatories all over the world, ALMA and the GBT will soon catch the first clear glimpse of the giant in our backyard.

Contact:

Brian Koberlein
bkoberle@nrao.edu

Tuesday, April 23, 2019

Omega Centauri’s lost stars

The Milky Way, as seen by the Gaia satellite. Streams of co-moving stars are shown colored according to their motions as measured by Gaia. The “Fimbulthul” stream which is due to stars lost from the omega Centauri globular cluster (white box) has been highlighted. Credit R. Ibata. Hi-res image

A team of researchers from the Strasbourg Astronomical Observatory, Bologna Observatory and the University of Stockholm has identified a stream of stars that was torn off the globular cluster Omega Centauri. Searching through the 1.7 billion stars observed by the ESA Gaia mission, they have identified 309 stars that suggest that this globular cluster may actually be the remnant of a dwarf galaxy that is being torn apart by the gravitational forces of our Galaxy.

In 1677, Edmond Halley gave the name “Omega Centauri” (ω Cen) to what he thought was a star in the Centaurus constellation. Later in 1830 John Herschel realized that it was in fact a globular cluster that could be resolved into individual stars. We now know that Omega Centauri is the most massive globular cluster in the Milky Way: it is about 18,000 light years from us and contains several million stars that are about 12 billion years old. The nature of this object has been the subject of much debate: is it really a globular cluster, or could it be the heart of a dwarf galaxy whose periphery has been dispersed by the Milky Way?

This last hypothesis is based on the fact that ω Cen contains several stellar populations, with a large range of metallicities (i.e. heavy element content) that betray a formation over an extended period of time. An additional argument in favor of this hypothesis would be to find debris from the cluster scattered along its orbit in the Milky Way. Indeed, when a dwarf galaxy interacts with a massive galaxy like our own, stars are torn off by gravitational tidal forces, and these stars remain visible for a time as stellar streams, before becoming dispersed in the vast volumes of interstellar space surrounding the massive galaxy.

By analyzing the motions of stars measured by the Gaia satellite with an algorithm called STREAMFINDER developed by the team, the researchers identified several star streams. One of them, named “Fimbulthul” (after one of the rivers in Norse mythology that existed at the beginning of the world), contains 309 stars stretching over 18° in the sky. By modeling the trajectories of the stars, the team showed that the Fimbulthul structure is a stellar tidal stream torn off ω Cen, extending up to 28° from the cluster. Spectroscopic observations of 5 stars of this stream with the Canada-France Hawaii Telescope show that their velocities are very similar, and that they have metallicities comparable to the stars of ω Cen itself, which reinforces the idea that the tidal stream is linked to ω Cen.

“The stars that the team observed were quite faint for the instrument we were using,” says Dr. Nadine Manset, instrument scientist for Espadons and CFHT’s astronomy group manager. “It is great to see such challenging observations reinforce the Fimbulthul structure’s link to ω Cen.”

The researchers were then able to show that the stream is also present in the very crowded area of sky in the immediate vicinity of the cluster. Further modeling of the tidal stream will constrain the dynamical history of the dwarf galaxy that was the progenitor of ω Cen, and allow us to find even more stars lost by this system into the halo of the Milky Way.

The team’s paper appeared in the April 22nd edition of Nature.


Additional information:

Nature paper (Subscription required.)
arXiv preprint (no login required)


Contact Information:


Media contact:

Mary Beth Laychak, Outreach manager
Canada-France-Hawaii Telescope
 

laychak@cfht.hawaii.edu

Science contacts:  

Rodrigo Ibata, +33 3 68 85 23 91
Michele Bellazzini, +39 051 635 73 26  
Khyati Malhan, +46 72 085 22 05  
Nicolas Martin, +33 3 68 85 24 67  
Paolo Bianchini, +33 3 68 85 24 02


Saturday, April 20, 2019

Lithium Detected in an Ancient Star Gives New Clues for Big Bang Nucleosynthesis

ISIS spectrum of J0023+0307, and J1029+1729, one of the most metal-poor stars known and shown for comparison. In red, the best model fit. Figure taken from Aguado et al., 2018. Large format: [PNG]

Researchers from the Instituto de Astrofísica de Canarias (Spain) and the University of Cambridge (UK) have detected lithium (Li) in the ancient star J0023+0307, a main-sequence extremely iron-poor dwarf star about 9,450 light years away in the Galactic halo.

The study of the most ancient stars in the Milky Way allows us to infer the early properties of the Galaxy, its chemical composition, and its assembly history. Metal-poor stars are invaluable messengers that carry information from early epochs, and are an important key to understand the primordial production of Li and the processes responsible for the possible "meltdown" of the Li plateau (a typical Li abundance of a metal-poor dwarf star which is related to the primordial lithium abundance). All stars with low metallicities and low Li abundances, significantly below A(Li)~2.2, are considered to have been likely affected by destruction of the Li in the stars.

New or poorly measured nuclear reaction resonances could affect the Li production predicted by the Standard Big Bang Nucleosynthesis (SBBN). Processes injecting neutrons at the relevant temperatures of the primordial plasma can also alter the primordial Li abundance. In addition, time-varying fundamental constants may lead to a significant Li lower value. Li observations in stars at the lowest metallicities are especially important to bring an insight into the processes of potential Li depletion in stars and, ultimately, to establish if any non-standard physics may have played a role during or after SBBN.

Stars that formed in the first or second generation are extremely rare objects, and only a few are known. The lack of metals in the gas available in the mini-halos, where the first stars formed, limits radiative cooling, increasing the Jeans mass and shifting the initial mass function to large masses, to the point that perhaps no low-mass stars were formed in the first generation. This picture has been challenged in recent years by the discovery of low-mass stars which show extremely low metallicity and low carbon and nitrogen abundances, suggesting that low-mass stars can form even at such low metallicities.

A year ago, astronomers using the ISIS spectrograph at the William Herschel Telescope (WHT) discovered the star J0023+0307, one of the most metal-poor stars known, with about a million times less iron than the Sun. J0023+0307 also shows very little carbon, an important element for the formation of low-mass stars in the low metallicity regime.

New data obtained using UVES, a high-resolution spectrograph at the Very Large Telescope (VLT) in Paranal Observatory (Chile), revealed a Li abundance with values consistent with the extended Li plateau at these low metallicities. However, the predicted Li abundance from the SBBN theory remains a factor of 3 higher than that of the Li plateau.

The presence of Li in this extremely iron-poor star has implications for the production of Li at the Big Bang, and strongly constrains any theory aiming at explaining the cosmological Li problem. The fact that no star in this large low-metallicity regime has been detected showing a Li abundance between that inferred from SBBN and the Li plateau, makes this upper boundary of Li abundance at low metallicities difficult to explain by destruction in the stars, and may support a lower primordial Li production, driven by non-standard nucleosynthesis processes.

More information:

D. S. Aguado, C. Allende Prieto, J. I. González Hernández, 2018, "J0023+0307: A mega metal-poor dwarf star from SDSS/BOSS", ApJ, 854, L34 [ ADS ]

D. S. Aguado, J. I. González Hernández, C. Allende Prieto, R. Rebolo, 2019, "Back to the Lithium Plateau with the [Fe/H] < -6 Star J0023+0307", ApJL, 874, L21 [ ADS ]

"Journey to the Big Bang through the lithium of a Milky Way star", IAC press release, 2 Apr 2019

Contact:  Javier Méndez  (Public Relations Officer) 


Friday, April 19, 2019

Hubble Celebrates its 29th Birthday with Unrivaled View of the Southern Crab Nebula

The Crab of the Southern Sky

Southern Crab Nebula

Formation of the Southern Crab Nebula (artist's impression)


Videos

Hubblecast 119: Hubble’s 29th anniversary

Zooming in on the Southern Crab Nebula

Formation of the Southern Crab Nebula


This incredible image of the hourglass-shaped Southern Crab Nebula was taken to mark the NASA/ESA Hubble Space Telescope’s 29th anniversary in space. The nebula, created by a binary star system, is one of the many objects that Hubble has demystified throughout its productive life. This new image adds to our understanding of the nebula and demonstrates the telescope’s continued capabilities.

On 24 April 1990, the NASA/ESA Hubble Space Telescope was launched on the space shuttle Discovery. It has since revolutionised how astronomers and the general public see the Universe. The images it provides are spectacular from both a scientific and a purely aesthetic point of view.

Each year the telescope dedicates a small portion of its precious observing time to take a special anniversary image, focused on capturing particularly beautiful and meaningful objects. This year’s image is the Southern Crab Nebula, and it is no exception [1].

This peculiar nebula, which exhibits nested hourglass-shaped structures, has been created by the interaction between a pair of stars at its centre. The unequal pair consists of a red giant and a white dwarf. The red giant is shedding its outer layers in the last phase of its life before it too lives out its final years as a white dwarf. Some of the red giant’s ejected material is attracted by the gravity of its companion.

When enough of this cast-off material is pulled onto the white dwarf, it too ejects the material outwards in an eruption, creating the structures we see in the nebula. Eventually, the red giant will finish throwing off its outer layers, and stop feeding its white dwarf companion. Prior to this, there may also be more eruptions, creating even more intricate structures
Astronomers did not always know this, however. The object was first written about in 1967, but was assumed to be an ordinary star until 1989, when it was observed using telescopes at the European Southern Observatory’s La Silla Observatory. The resulting image showed a roughly crab-shaped extended nebula, formed by symmetrical bubbles of gas and dust.

These observations only showed the outer hourglass emanating from a bright central region that could not be resolved. It was not until Hubble observed the Southern Crab in 1999 that the entire structure came into view. This image revealed the inner nested structures, suggesting that the phenomenon that created the outer bubbles had occurred twice in the (astronomically) recent past.

It is fitting that Hubble has returned to this object twenty years after its first observation. This new image adds to the story of an active and evolving object and contributes to the story of Hubble’s role in our evolving understanding of the Universe.


Notes

[1] The Southern Crab Nebula is so named to distinguish it from the better-known Crab Nebula, a supernova remnant visible in the constellation of Taurus.


More Information

  • The Hubble Space Telescope is a project of international cooperation between ESA and NASA.
  • Image credit: NASA, ESA, and STScI


Links


Contacts

Bethany Downer
ESA/Hubble, Public Information Officer
Garching, Germany
Email: bethany.downer@partner.eso.org


Thursday, April 18, 2019

A “Jellyfish” Galaxy Swims Into View of NASA’s Upcoming Webb Telescope

Galaxy ESO 137-001 (Visible)
The spiral galaxy ESO 137-001 is an example of a “jellyfish” galaxy, because blue tendrils of star formation stream away from it like jellyfish tentacles. NASA’s Webb Space Telescope will study those sites of star formation to learn more about conditions there. Credits: NASA, ESA

Galaxy ESO 137-001 (Visible and X-ray) 
This composite view of ESO 137-001 includes visible light from Hubble and X-ray light from the Chandra X-ray Observatory (in blue). It reveals a tail of hot gas that has been stripped from the galaxy.  Credits: NASA, ESA, CXC


Webb will examine clumps of newly formed stars in the galaxy’s tail

As the spiral galaxy ESO 137-001 plunges into a galaxy cluster, gas is being pulled off of it as though it faced a cosmic headwind. Within that gas, stars are forming to create the appearance of giant, blue tentacle-like streamers. Astronomers, puzzled that stars could form within such tumult, plan to use Webb to study this galaxy and its stellar offspring.

If you look at the galaxy ESO 137-001 in visible light, you can see why it’s considered an example of a “jellyfish” galaxy. Blue ribbons of young stars dangle from the galaxy’s disk like cosmic tentacles. If you look at the galaxy in X-ray light, however, you will find a giant tail of hot gas streaming behind the galaxy. After launch, NASA’s James Webb Space Telescope will study ESO 137-001 to learn how the gas is being removed from the galaxy, and why stars are forming within that gaseous tail.

The newly forming stars in the tail are mysterious because processes common in large groups of galaxies should make it difficult for new stars to emerge. Most galaxies live in groups — for example, the Milky Way is a member of the Local Group, which also contains galaxies like Andromeda and the Triangulum spiral. Some galaxies reside in much larger gatherings of hundreds or even thousands of galaxies known as a galaxy cluster. The “jellyfish” galaxy ESO 137-001 is part of a cluster called Abell 3627.

A galaxy cluster isn’t just galaxies surrounded by empty space. The realm between the galaxies is filled with hot, tenuous gas. For galaxies living in the cluster or a wandering galaxy that gets pulled in by the cluster’s gravity, that gas acts like a headwind. That wind can remove gas and dust from the hapless galaxy in a process known as “ram pressure stripping.”

As a result, ram pressure stripping can slow star formation in the affected galaxy. Galaxies need gas to form stars. Eventually, all galaxies run out of gas and star formation stops. Ram pressure stripping can hasten that end.

This is one reason why galaxies in clusters stop forming new stars sooner than their relatives outside of clusters. But, the mechanisms involved are still mysterious.

“Both gas and dust are getting stripped off, but how much and what happens to the stripped material and the galaxy itself are still open questions,” said Stacey Alberts of the University of Arizona, a co-investigator on the project.

A star formation mystery

ESO 137-001 is a spiral galaxy similar in size to the Milky Way, and slightly less massive. Its tail extends across 260,000 light-years of space, almost three times the galaxy’s width. Galactic tails like this are difficult to spot because they are so tenuous. Surprisingly, stars seem to be forming in this tail.

Webb will target sites of star formation at different points along the tail: close to the galaxy, in the middle, and near the end of the tail. Since material at the tail’s end was removed before material close to the galaxy, astronomers can learn how the stripping process changed over time and how that affected conditions to form new stars.

Researchers aren’t sure how stars are able to form at all within the tail since the stripping process should have heated the gas. “We think it’s hard to strip off a molecular cloud that’s already forming stars because it should be tightly bound to the galaxy by gravity. Which means either we’re wrong, or this gas got stripped off and heated up, but then had to cool again so that it could condense and form stars,” explained Alberts.

“Telling these two scenarios apart is one of the things we want to get at,” she added.

Mid-infrared completes the puzzle

The team will examine ESO 137-001 using Webb’s Mid-Infrared Instrument (MIRI). MIRI observes infrared light at wavelengths of 5 to 28 microns, a range known as the mid-infrared. MIRI’s observations will provide 50 times more spatial detail and 20 times better spectral detail than previous work by other infrared observatories.

MIRI is sensitive to light emitted from hydrogen molecules as well as chemical elements like sulfur and oxygen. MIRI also will detect more complex, sooty molecules of carbon and hydrogen known as polycyclic aromatic hydrocarbons (PAHs), which are signposts of star formation. In addition to learning about the composition of gas and dust within these star-forming regions, astronomers will measure the physical conditions of the gas like temperature and density.

The team will combine the new Webb observations with existing data in visible light, X-rays, and at longer far-infrared wavelengths to get a more complete picture of ESO 137-001 and its environment. “Each different wavelength gives you a piece of the puzzle,” said Alberts.

Ultimately, astronomers want to learn more about how stars came to form in the tail. They also want to understand how gas is being stripped from the galaxy, how much is being stripped, and how efficiently it’s being removed. This will provide clues to the eventual fate of ESO 137-001 and the question of whether ram pressure stripping will shut down star formation, leaving behind a dead relic filled with aging, red stars.

The observations described here will be taken as part of Webb’s Guaranteed Time Observation (GTO) program. The GTO program provides dedicated time to the scientists who have worked with NASA to craft the science and instrument capabilities of Webb throughout its development.

The James Webb Space Telescope will be the world's premier space science observatory when it launches in 2021. Webb will solve mysteries of our solar system, look beyond to distant worlds around other stars, and probe the mysterious structures and origins of our universe and our place in it. Webb is an international project led by NASA with its partners, ESA (European Space Agency) and the Canadian Space Agency.

Galaxies are concentrations of stars, gas, dust, and dark matter. They come in a variety of shapes and sizes. Some are fated to collide, like the Milky Way and Andromeda. Credits: NASA, and J. Olmsted (STScI). Youtube


Wednesday, April 17, 2019

A New Signal for a Neutron Star Collision Discovered

XT2
Credit: X-ray: NASA/CXC/Uni. of Science and Technology of China/Y. Xue et al; 
Optical: NASA/STScI

JPEG (134.1 kb) - Large JPEG (1.8 MB) - Tiff (29 MB) - More Images

A Tour of XT2 - More Animations


These images show the location of an event, discovered by NASA's Chandra X-ray Observatory, that likely signals the merger of two neutron stars. A bright burst of X-rays in this source, dubbed XT2, could give astronomers fresh insight into how neutron stars — dense stellar objects packed mainly with neutrons — are built.

XT2 is located in a galaxy about 6.6 billion light years from Earth. The source is located in the Chandra Deep Field South (CDF-S), a small patch of sky in the Fornax constellation. The CDF-S is the deepest X-ray image ever taken, containing almost 12 weeks of Chandra observing time. The wider field of view shows an optical image from the Hubble Space Telescope of a portion of the CDF-S field, while the inset shows a Chandra image focusing only on XT2. The location of XT2, which was not detected in optical images, is shown by the rectangle, and its host galaxy is the small, oval-shaped object located slightly to the upper left. 

On March 22, 2015, astronomers saw XT2 suddenly appear in the Chandra data and then fade away after about seven hours. By combing through the Chandra archive, they were able to piece together the history of the source's behavior. The researchers compared the data from XT2 to theoretical predictions made in 2013 of what the X-ray signature from two colliding neutron stars without a corresponding gamma ray bursts would look like.

When two neutron stars merge they produce jets of high energy particles and radiation fired in opposite directions. If the jet is pointed along the line of sight to the Earth, a flash, or burst, of gamma rays can be detected. If the jet is not pointed in our direction, a different signal is needed to identify the merger. This result provides scientists with an opportunity to study just such a case.

X-rays from XT2 showed a characteristic signature that matched those predicted for a newly-formed magnetar, that is, a neutron star spinning around hundreds of times per second and possessing a tremendously strong magnetic field about a quadrillion times that of Earth's.

The team think that the magnetar lost energy in the form of an X-ray-emitting wind, slowing down its rate of spin as the source faded. The amount of X-ray emission stayed roughly constant in X-ray brightness for about 30 minutes, then decreased in brightness by more than a factor of 300 over 6.5 hours before becoming undetectable. This showed that the neutron star merger produced a new, larger neutron star and not a black hole.

XT2's bright flare of X-rays gives astronomers another signal — in addition to the detection of gravitational waves — to probe neutron star mergers.

A paper describing these results appeared in the April 11th issue of Nature, led by Yongquan Xue (University of Science and Technology in China). NASA's Marshall Space Flight Center in Huntsville, Alabama, manages the Chandra program for NASA's Science Mission Directorate in Washington. The Smithsonian Astrophysical Observatory in Cambridge, Massachusetts, controls Chandra's science and flight operations.

Timelapse
Credit: NASA/CXC/Uni. of Science and Technology of China/Y. Xue et al.

When two neutron stars merge they produce jets of high energy particles and radiation fired in opposite directions. If the jet is pointed along the line of sight to the Earth, a flash, or burst, of gamma rays can be detected. If the jet is not pointed in our direction, a different signal is needed to identify the merger. This result provides scientists with an opportunity to study just such a case.

X-rays from XT2 showed a characteristic signature that matched those predicted for a newly-formed magnetar, that is, a neutron star spinning around hundreds of times per second and possessing a tremendously strong magnetic field about a quadrillion times that of Earth's.

The team think that the magnetar lost energy in the form of an X-ray-emitting wind, slowing down its rate of spin as the source faded. The amount of X-ray emission stayed roughly constant in X-ray brightness for about 30 minutes, then decreased in brightness by more than a factor of 300 over 6.5 hours before becoming undetectable. This showed that the neutron star merger produced a new, larger neutron star and not a black hole.

XT2's bright flare of X-rays gives astronomers another signal — in addition to the detection of gravitational waves — to probe neutron star mergers.

A paper describing these results appeared in the April 11th issue of Nature, led by Yongquan Xue (University of Science and Technology in China). NASA's Marshall Space Flight Center in Huntsville, Alabama, manages the Chandra program for NASA's Science Mission Directorate in Washington. The Smithsonian Astrophysical Observatory in Cambridge, Massachusetts, controls Chandra's science and flight operations.


Fast Facts for CDF-S XT2:

Scale: Chandra images are about 15 arcsec (360,000 light years) across.
Category: Neutron Stars/X-ray Binaries
Coordinates (J2000): RA 3h 32m 18.38s | Dec -27° 52´ 24.2"
Constellation: Fornax
Observation Date: Mar 22, 2015
Observation Time: 19 hours 27 minutes
Obs. ID: 16453
Instrument: ACIS
References: Xue,Y.Q et al, 2019, Nature.  arXiv:1904.05368
Color Code: X-ray: Orange; Optical: Red
Distance Estimate: About 6.6 billion light years