Saturday, February 28, 2015

The galaxies NGC 2623 in the final stages of their titanic merger. The violent encounter has produced widespread star formation. A systematic new study of galaxy simulations examines where in merging systems the star formation activity tends to take place. Hubble Legacy Archive, ESA, NASA, APOD; Processing - Martin Pugh


Collisions between galaxies, and even less dramatic gravitational encounters between them, are recognized as triggering star formation. Observations of luminous galaxies, powered by starbursts, are consistent with this conclusion. Numerical simulations also support this picture, with gravity funneling copious amounts of gas into the central regions of galaxies, fueling powerful bursts of star formation there. But starbursts are not ubiquitous in interacting galaxies. Triggering therefore depends on many factors, including the specific merger geometry (how they come together), the properties of the progenitor galaxies (how much gas is available for new stars), and time-scale (maybe the starburst has yet to happen, or has finished?)

CfA astronomer Lars Hernquist and six colleagues computed seventy-five simulated galaxy collisions under a wide range of conditions in order to investigate the question of where the induced star formation is located. Observational tests of this property are difficult to make because many of the most interesting cases are far enough away that individual regions can’t easily be distinguished for study. For the same reason, it is often hard to tell in which of the two merging galaxies (or both?) the starburst take place.

The results of these simulations were clear: the interactions enhanced the star formation activity in the centers of galaxies, and in particular in roughly the central ten thousand light-years. (By way of comparison, our Sun is about twenty-five thousand light-years away from the Milky Way’s center.) The scientists discovered several other important effects about the star formation as well: it was actually suppressed in the outer regions of the galaxies (depending on the merger geometry); at later merger stages it often formed a ring around the central zone, and its strength was critically dependent on whether the rotations of the galaxies were in the same direction (star formation enhanced) or opposite (star formation suppressed). The new generation of telescopes under construction should have the capability of improving the observations, and this theoretical work will help guide the new research.


 Reference(s)

"Mapping Galaxy Encounters in Numerical Simulations: The Spatial Extent of Induced Star Formation," Jorge Moreno, Paul Torrey, Sara L. Ellison, David R. Patton, Asa F. L. Bluck, Gunjan Bansal, and Lars Hernquist, MNRAS 448, 1107, 2015.


Found: Ancient, super-bright quasar with massive black hole

This is an artist's rendering of a very distant, very ancient quasar
Courtesy of the European Southern Observatory (M. Kornmesser)


Washington, D.C.— Quasars--supermassive black holes found at the center of distant massive galaxies--are the most-luminous beacons in the sky. These central supermassive black holes actively accrete the surrounding materials and release a huge amount of their gravitational energy. An international team of astronomers, including Carnegie’s Yuri Beletsky, has discovered the brightest quasar ever found in the early universe, which is powered by the most massive black hole observed for an object from that time. Their work is published February 26 by Nature.

The quasar was found at a redshift of z=6.30. This is a measurement of how much the wavelength of light emitted from it that reaches us on Earth is stretched by the expansion of the universe. As such, it can be used to calculate the quasar’s age and distance from our planet. A higher redshift means larger distance and hence looking further back in time.

At a distance of 12.8 billion light years from Earth, this quasar was formed only 900 million years after the Big Bang. Named SDSS J0100+2802, studying this quasar will help scientists understand how quasars evolved in the earliest days of the universe. There are only 40 known quasars have a redshift of higher than 6, a point that marks the beginning of the early universe.

“This quasar is very unique. Just like the brightest lighthouse in the distant universe, its glowing light will help us to probe more about the early universe,” said team-leader Xue-Bing Wu of Peking University and the Kavli Institute of Astronomy and Astrophysics.

With a luminosity of 420 trillion that of our own Sun’s, this new quasar is seven times brighter than the most distant quasar known (which is 13 billion years away). It harbors a black hole with mass of 12 billion solar masses, proving it to be the most luminous quasar with the most massive black hole among all the known high redshift quasars.

The team developed a method of detecting quasars at redshifts of 5 and higher. These detections were verified by the 6.5-meter Multiple Mirror Telescope (MMT) and 8.4m Large Binocular Telescope (LBT) in Arizona; the 6.5m Magellan Telescope at Carnegie’s Las Campanas Observatory in Chile; and the 8.2m Gemini North Telescope in Hawaii.

“This quasar is a unique laboratory to study the way that a quasar’s black hole and host galaxy co-evolve,” Beletsky said. “Our findings indicate that in the early Universe, quasar black holes probably grew faster than their host galaxies, although more research is needed to confirm this idea.”
Other co-authors on the paper are: FeigeWang, Jinyi Yang, and Qian Yang, also of Peking University and the Kavli Institute; Xiaohui Fan of University of Arizona and the Kavli Institute; Weimin Yi of the Chinese Academy of Sciences; Wenwen Zuo of Peking University and the Chinese Academy of Sciences; Fuyan Bian of Australian National University; Linhua Jiang and RanWang of the Kavli Institute; and Ian D. McGreer and David Thompson of University of Arizona.

This work was funded by the NSFC, the Strategic Priority Research Program ”The Emergence of Cosmological Structures” of the Chinese Academy of Sciences, the National Key Basic Research Program of China, and the U.S. NSF.


Friday, February 27, 2015

ESOcast 72: Looking Deeply into the Universe in 3D


MUSE goes beyond Hubble in the Hubble Deep Field South

MUSE stares at the Hubble Deep Field South

The Hubble Deep Field South in the constellation of Tucana

Hubble Deep Field South — Multiple Windows on the Universe


*************************************************************************************************************************************


Videos

ESOcast 72 – Looking Deeply into the Universe in 3D

MUSE view of the Hubble Deep Field South

MUSE view of the Hubble Deep Field South

MUSE view of the Hubble Deep Field South

A video view of MUSE data of the Hubble Deep Field South


The MUSE instrument on ESO’s Very Large Telescope has given astronomers the best ever three-dimensional view of the deep Universe. After staring at the Hubble Deep Field South region for only 27 hours, the new observations reveal the distances, motions and other properties of far more galaxies than ever before in this tiny piece of the sky. They also go beyond Hubble and reveal previously invisible objects.

By taking very long exposure pictures of regions of the sky, astronomers have created many deep fields that have revealed much about the early Universe. The most famous of these was the original Hubble Deep Field, taken by the NASA/ESA Hubble Space Telescope over several days in late 1995. This spectacular and iconic picture rapidly transformed our understanding of the content of the Universe when it was young. It was followed two years later by a similar view in the southern sky — the Hubble Deep Field South.

But these images did not hold all the answers — to find out more about the galaxies in the deep field images, astronomers had to carefully look at each one with other instruments, a difficult and time-consuming job. But now, for the first time, the new MUSE instrument can do both jobs at once — and far more quickly.

One of the first observations using MUSE after it was commissioned on the VLT in 2014 was a long hard look at the Hubble Deep Field South (HDF-S). The results exceeded expectations.

After just a few hours of observations at the telescope, we had a quick look at the data and found many galaxies — it was very encouraging. And when we got back to Europe we started exploring the data in more detail. It was like fishing in deep water and each new catch generated a lot of excitement and discussion of the species we were finding,”  explained Roland Bacon (Centre de Recherche Astrophysique de Lyon, France, CNRS) principal investigator of the MUSE instrument and leader of the commissioning team.

For every part of the MUSE view of HDF-S there is not just a pixel in an image, but also a spectrum revealing the intensity of the light’s different component colours at that point — about 90 000 spectra in total [1]. These can reveal the distance, composition and internal motions of hundreds of distant galaxies — as well as catching a small number of very faint stars in the Milky Way.

Even though the total exposure time was much shorter than for the Hubble images, the HDF-S MUSE data revealed more than twenty very faint objects in this small patch of the sky that Hubble did not record at all [2].

The greatest excitement came when we found very distant galaxies that were not even visible in the deepest Hubble image. After so many years of hard work on the instrument, it was a powerful experience for me to see our dreams becoming reality,” adds Roland Bacon.

By looking carefully at all the spectra in the MUSE observations of the HDF-S, the team measured the distances to 189 galaxies. They ranged from some that were relatively close, right out to some that were seen when the Universe was less than one billion years old. This is more than ten times the number of measurements of distance than had existed before for this area of sky.

For the closer galaxies, MUSE can do far more and look at the different properties of different parts of the same galaxy. This reveals how the galaxy is rotating and how other properties vary from place to place. This is a powerful way of understanding how galaxies evolve through cosmic time.

Now that we have demonstrated MUSE’s unique capabilities for exploring the deep Universe, we are going to look at other deep fields, such as the Hubble Ultra Deep field. We will be able to study thousands of galaxies and to discover new extremely faint and distant galaxies. These small infant galaxies, seen as they were more than 10 billion years in the past, gradually grew up to become galaxies like the Milky Way that we see today,” concludes Roland Bacon.


Notes


[1] Each spectrum covers a range of wavelengths from the blue part of the spectrum into the near-infrared (475‒930 nanometres).

[2] MUSE is particularly sensitive to objects that emit most of their energy at a few particular wavelengths as these show up as bright spots in the data. Galaxies in the early Universe typically have such spectra, as they contain hydrogen gas glowing under the ultraviolet radiation from hot young stars.


More information


This research was presented in a paper entitled “The MUSE 3D view of the Hubble Deep Field South” by R. Bacon et al., to appear in the journal Astronomy & Astrophysics on 26 February 2015.

The team is composed of R. Bacon (Observatoire de Lyon, CNRS, Université Lyon, Saint Genis Laval, France [Lyon]), J. Brinchmann (Leiden Observatory, Leiden University, Leiden, The Netherlands [Leiden]), J. Richard (Lyon), T. Contini (Institut de Recherche en Astrophysique et Planétologie, CNRS, Toulouse, France; Université de Toulouse, France [IRAP]), A. Drake (Lyon), M. Franx (Leiden), S. Tacchella (ETH Zurich, Institute of Astronomy, Zurich, Switzerland [ETH]), J. Vernet (ESO, Garching, Germany), L. Wisotzki (Leibniz-Institut für Astrophysik Potsdam, Potsdam, Germany [AIP]), J. Blaizot (Lyon), N. Bouché (IRAP), R. Bouwens (Leiden), S. Cantalupo (ETH), C.M. Carollo (ETH), D. Carton (Leiden), J. Caruana (AIP), B. Clément (Lyon), S. Dreizler (Institut für Astrophysik, Universität Göttingen, Göttingen, Germany [AIG]), B. Epinat (IRAP; Aix Marseille Université, CNRS, Laboratoire d’Astrophysique de Marseille, Marseille, France), B. Guiderdoni (Lyon), C. Herenz (AIP), T.-O. Husser (AIG), S. Kamann (AIG), J. Kerutt (AIP), W. Kollatschny (AIG), D. Krajnovic (AIP), S. Lilly (ETH), T. Martinsson (Leiden), L. Michel-Dansac (Lyon), V. Patricio (Lyon), J. Schaye (Leiden), M. Shirazi (ETH), K. Soto (ETH), G. Soucail (IRAP), M. Steinmetz (AIP), T. Urrutia (AIP), P. Weilbacher (AIP) and T. de Zeeuw (ESO, Garching, Germany; Leiden).

ESO is the foremost intergovernmental astronomy organisation in Europe and the world’s most productive ground-based astronomical observatory by far. It is supported by 16 countries: Austria, Belgium, Brazil, the Czech Republic, Denmark, France, Finland, Germany, Italy, the Netherlands, Poland, Portugal, Spain, Sweden, Switzerland and the United Kingdom, along with the host state of Chile. ESO carries out an ambitious programme focused on the design, construction and operation of powerful ground-based observing facilities enabling astronomers to make important scientific discoveries. ESO also plays a leading role in promoting and organising cooperation in astronomical research. ESO operates three unique world-class observing sites in Chile: La Silla, Paranal and Chajnantor. At Paranal, ESO operates the Very Large Telescope, the world’s most advanced visible-light astronomical observatory and two survey telescopes. VISTA works in the infrared and is the world’s largest survey telescope and the VLT Survey Telescope is the largest telescope designed to exclusively survey the skies in visible light. ESO is a major partner in ALMA, the largest astronomical project in existence. And on Cerro Armazones, close to Paranal, ESO is building the 39-metre European Extremely Large Telescope, the E-ELT, which will become “the world’s biggest eye on the sky”.


Links


Contacts


Roland Bacon
CRAL - Centre de recherche astrophysique de Lyon
Saint-Genis-Laval, France
Tel: +33 478 86 85 59
Cell: +33 608 09 14 27
Email:
roland.bacon@univ-lyon1.fr

Richard Hook
ESO education and Public Outreach Department
Garching bei München, Germany
Tel: +49 89 3200 6655
Cell: +49 151 1537 3591
Email:
rhook@eso.org

Source: ESO


A galactic cloak for an exploding star

Credit: ESA/Hubble & NASA
Acknowledgement: Gilles Chapdelaine


The galaxy pictured here is NGC 4424, located in the constellation of  Virgo. It is not visible with the naked eye but has been captured here with the NASA/ESA Hubble Space Telescope.

Although it may not be obvious from this image, NGC 4424 is in fact a spiral galaxy. In this image it is seen more or less edge on, but from above you would be able to see the arms of the galaxy wrapping around its centre to give the characteristic spiral form .

In 2012 astronomers observed a supernova in NGC 4424 — a violent explosion marking the end of a star’s life. During a supernova explosion, a single star can often outshine an entire galaxy. However, the supernova in NGC 4424, dubbed SN 2012cg, cannot be seen here as the image was taken ten years prior to the explosion. Along the central region of the galaxy, clouds of dust block the light from distant stars and create dark patches.

To the left of NGC 4424 there are two bright objects in the frame. The brightest is another, smaller galaxy known as LEDA 213994 and the object closer to NGC 4424 is an anonymous star in our Milky Way.

A version of this image was entered into the Hubble's Hidden Treasures image processing competition by contestant Gilles Chapdelaine.


Source: ESA/Hubble - Space Telescope

Thursday, February 26, 2015

Supermassive Black Hole Lurks at Dawn of the Universe

The spectrum obtained using the Gemini Near-Infrared Spectrograph (GNIRS) combined with observations from the Magellan Telescope appears in red; gaps are regions of low sky transparency. The optical spectrum (from the Large Binocular Telescope; black) and noise (magenta) are also plotted. The inset shows the three components of the fit to a portion of the near-infrared emission. The ionized magnesium (Mg II; blue) is used to estimate the extremely large black hole mass mass, of 12 billion times the mass of the Sun. Figure credit: Nature.
 

Infrared observations with the Gemini North telescope have confirmed a 12 billion solar mass black hole in an exceptionally bright quasar in the very early universe. The finding, led by a Chinese team, used Gemini, as well as telescopes from around the world, to discover and characterize an extremely massive black hole from a period when the universe was very young (about 900 million years after the Big Bang). This observation requires extremely rapid growth of the black hole. While black holes of comparable mass have been observed after they have had billions of years to gradually gain mass over cosmic history this quasar challenges astronomers to figure out how such a huge object could exist so early in the history of the universe. 
 
The research is published in the February 26th issue of Nature, led by Xue-Bing Wu at Peking University in Beijing. 

Abstract: So far, roughly 40 quasars with redshifts greater than z=6 have been discovered. Each quasar contains a black hole with a mass of about one billion solar masses. The existence of such black holes when the Universe was less than one billion years old presents substantial challenges to theories of the formation and growth of black holes and the coevolution of black holes and galaxies. Here we report the discovery of an ultraluminous quasar, SDSSJ010013.021280225.8, at redshift z=6.30. It has an optical and near-infrared luminosity a few times greater than those of previously known z>6 quasars. On the basis of the deep absorption trough on the blue side of the Lyman-a emission line in the spectrum, we estimate the proper size of the ionized proximity zone associated with the quasar to be about 26 million light years, larger than found with other z>6.1 quasars with lower luminosities. We estimate (on the basis of a near-infrared spectrum) that the black hole has a mass of ~1.2 x 10¹⁰ solar masses, which is consistent with the 1.3 x 10¹⁰ solar masses derived by assuming an Eddington-limited accretion rate. 


NGC 2276: NASA's Chandra Finds Intriguing Member of Black Hole Family Tree

NGC 2276
Credit  X-ray: NASA/CXC/SAO/M.Mezcua et al & NASA/CXC/INAF/A.Wolter et al; 
Optical: NASA/STScI and DSS; Inset: Radio: EVN/VLBI

JPEG (247.8 kb) - Large JPEG (2.2 MB) - Tiff (37.1 MB) - More Images


Tour of NGC 2207


A newly discovered object in the galaxy NGC 2276 may prove to be an important black hole that helps fill in the evolutionary story of these exotic objects, as described in our latest press release. The main image in this graphic contains a composite image of NGC 2766 that includes X-rays from NASA's Chandra X-ray Observatory (pink) combined with optical data from the Hubble Space Telescope and the Digitized Sky Survey (red, green and blue). The inset is a zoom into the interesting source that lies in one of the galaxy's spiral arms. This object, called NGC 2276-3c, is seen in radio waves (red) in observations from the European Very Long Baseline Interferometry Network, or EVN.

Astronomers have combined the X-ray and radio data to determine that NGC 2766-3c is likely an intermediate-mass black hole (IMBH). As the name suggests, IMBHs are black holes that are larger than stellar-mass black holes that contain about five to thirty times the mass of the Sun, but smaller than supermassive black holes that are millions or even billions of solar masses. The researchers estimated the mass of NGC 2766-3c using a well-known relationship between how bright the source is in radio and X-rays, and the mass of the black hole. The X-ray and radio brightness were based on observations with Chandra and the EVN. They found that NGC 2276-3c contains about 50,000 times the mass of the Sun.

IMBHs are interesting to astronomers because they may be the seeds that eventually evolve into supermassive black holes. They also may be strongly influencing their environment. This latest result on NGC 2276-3c suggests that it may be suppressing the formation of new stars around it. The EVN radio data reveal an inner jet that extends about 6 light years from NGC 2276-3c. Additional observations by the NSF's Karl Jansky Very Large Array (VLA) show large-scale radio emission extending out to over 2,000 light years away from the source.

A region along the jet extending to about 1,000 light years away from NGC 2766-3c is devoid of young stars. This might provide evidence that the jet has cleared out a cavity in the gas, preventing new stars from forming there. The VLA data also reveal a large population of stars at the edge of the radio emission from the jet. This enhanced star formation could take place either when the material swept out by the jet collides with dust and gas in between the stars in NGC 2276, or when triggered by the merger of NGC 2276 with a dwarf galaxy.

In a separate study, Chandra observations of this galaxy have also been used to examine its rich population of ultraluminous X-ray sources (ULXs). Sixteen X-ray sources are found in the deep Chandra dataset seen in this composite image, and eight of these are ULXs including NGC 2276-3c. Chandra observations show that one apparent ULX observed by ESA's XMM-Newton is actually five separate ULXs, including NGC 2276-3c. This ULX study shows that about five to fifteen solar masses worth of stars are forming each year in NGC 2276. This high rate of star formation may have been triggered by a collision with a dwarf galaxy, supporting the merger idea for the IMBH's origin.

The study on NGC 2276-3c was conducted by Mar Mezcua (previously in the Instituto de Astrofisica de Canarias and now at the Harvard-Smithsonian Center for Astrophysics), Tim Roberts (University of Durham, UK), Andrei Lobanov ( Max Planck Institute for Radio Astronomy, Germany), and Andrew Sutton (University of Durham) and will appear in the Monthly Notices of the Royal Astronomical Society (MNRAS). A separate paper on the ULX population in NGC 2276 will also appear in MNRAS and the authors on that study are Anna Wolter (National Institute for Astrophysics (INAF) in Milan, Italy), Paolo Esposito (INAF), Michela Mapelli (INAF, Padova), Fabio Pizzolato (University of Milan, Italy), and Emanuele Ripamonti (University of Padova, Italy).

NASA's Marshall Space Flight Center in Huntsville, Alabama, manages the Chandra program for NASA's Science Mission Directorate in Washington. The Smithsonian Astrophysical Observatory in Cambridge, Massachusetts, controls Chandra's science and flight operations.


Fast Facts for NGC 2276:

Scale: Image is 4.5 arcmin across (about 140,000 light years)
Category: Normal Galaxies & Starburst Galaxies
Coordinates (J2000): RA 07h 27m 14.48s | Dec +85° 45' 16.20"
Constellation: Cepheus
Observation Date: 23 Jun 2004 and 24 May 2013
Observation Time: 19 hours 30 min.
Obs. ID: 4968, 15648
Instrument: ACIS
References: Mezcua, M et al, 2015, MNRAS (accepted); arXiv:1501.04897; Wolter, A. et al, 2015, MNRAS (accepted); arXiv:1501.01994
Color Code: X-ray (Pink); Optical (Red, Green, Blue); Inset: Radio (Red)
Distance Estimate: About 100 million light years


Wednesday, February 25, 2015

Quadruplets in a Stellar Womb

An image at radio wavelengths of a young stellar quadruplet. Astronomers have discovered four distinct gas condensations in a clumpy, filamentary gas cloud (white) surrounded by dust (blue). The locations of the condensations in this image are marked with black and red dots. The four condensations are destined to form a bound multiple star system, and one of them (the red dot) has already turned on as a protostar. Credit: Nature; Pineda


More than half of all stars are in multiple systems: binary stars, or even triplets or quadruplets, that orbit one another. No one is quite sure how or why they form, but the effects can be significant, for example influencing the character of their planets. Our Sun is uncommon in having no companion star, perhaps suggesting that its configuration of planets is equally uncommon.

There are two principal ideas about how multiple stars form: fragmentation in the early stages of birth, or the gravitational capture of a nearby star later on. Computer simulations of star formation find that both are reasonable possibilities, and so astronomers have been trying to make observations to refine the models and the conclusions. Writing in this week’s journal Nature, Alyssa Goodman and her collaborators report finding a nearby stellar nursery where quadruplets are being born. The region is in the star forming molecular cloud in the direction of the constellation of Perseus, about 825 light-years away. Scientists have known for decades about a protostar in this area, a dense core of material that is developing into a small star about one-tenth of a solar-mass in size.

Using radio wavelength observations of dense molecular gas, ammonia in particular, the team discovered that around this protostar are several filamentary gas structures in which they detected three other condensations. The other three embryos are two to three times more massive than the main protostar, and models suggest they will become stars soon - in roughly forty thousand years. The longest dimension of the complex is only about ten thousand astronomical units (one AU is the average distance of the Earth from the Sun), and so these objects are close enough together for gravity to be the major influence in their development; velocity measurements confirm that the objects are physically associated.

It is possible – even likely - that during the stars’ development their orbital motions will prompt the ejection of one or two members from the system, but for now it appears that at least one binary pair will survive for longer times. Other stellar systems need to be examined in order to see how widespread these young multiplets really are, but the new results support models in which multiple stars form very early in the stellar womb.


Reference (s):

"The Formation of a Quadruple Star System with Wide Separation," Jaime E. Pineda, Stella S. R. Offner, Richard J. Parker, Hector G. Arce, Alyssa A. Goodman, Paola Caselli, Gary A. Fuller, Tyler L. Bourke & Stuartt A. Corder, Nature, 518, 213, 2015


Artist's impression of black-hole wind in a galaxy and XMM-Newton and NuSTAR spectrum of the quasar PDS 456

XMM-Newton and NuSTAR
Copyright: NASA/JPL-Caltech; Insert: ESA 


This illustration shows the powerful wind driven by the supermassive black hole at the centre of a galaxy. The schematic figure in the insert depicts the innermost regions of the galaxy where a black hole accretes the surrounding matter (light grey) at a very high pace via a disc (darker grey). At the same time, part of that matter is cast away through powerful winds.

A study based on joint observations with ESA's XMM-Newton and NASA's NuSTAR X-ray telescopes of the quasar PDS 456, which hosts a very active black hole, has shown that the winds driven by a black hole can be wide and almost spherical. This discovery supports the picture of black holes having a significant impact on star formation of their host galaxy.

The artwork of the galaxy is based on an image of the Pinwheel galaxy (Messier 101) taken by the NASA/ESA Hubble Space Telescope.


Copyright: NASA/JPL-Caltech/Keele Univ.
Source: ESA/XMM-Newton 

This plot of data from NASA's Nuclear Spectroscopic Telescope Array (NuSTAR) and the European Space Agency's (ESA's) XMM-Newton determines for the first time the shape of ultra-fast winds from supermassive black holes, or quasars. The winds blow in every direction, in a nearly spherical fashion, coming from both sides of a galaxy (only one side is shown in the artist's impression here). 

The plot shows the brightness of X-ray light from an extremely luminous quasar called PDS 456, with the highest-energy rays on the right. XMM-Newton sees lower-energy X-rays, and NuSTAR, higher. XMM Newton had previously observed PDS 456 in 2001. At that time, it had measured the X-rays up to an energy level of 11 kiloelectron volts. From those data, researchers detected a dip in the X-ray light, called an absorption feature (see dip in plot). The dip is caused by iron atoms – which are carried by the winds along with other matter – absorbing the X-ray light of a particular energy. What's more, the absorption feature is 'blue-shifted," meaning that the winds are speeding toward us.

These data told researchers that at least some of the winds were blowing toward us – but they didn't reveal whether those winds were confined to a narrow beam along our line of sight, or were blowing in all directions. That's because XMM-Newton had only detected absorption features, which by definition occur in front of a light source, in this case, the quasar. To probe what was happening at the other sides of the quasar, the astronomers needed to find an emission feature, which would indicate that the iron was scattering X-ray light at a particular energy in all directions, not only toward the observer.

NuSTAR and XMM-Newton teamed up to observe PDS 456 simultaneously in 2013 and 2014, and the results of that campaign are shown in this plot. NuSTAR data are represented as orange circles and XMM-Newton as blue squares. The NuSTAR data reveal the baseline of the "continuum" quasar light (see gray line) – or what the quasar would look like without any winds. What stands out is the bump to the left of the dips. That is an iron emission signature, the telltale sign that the black-hole winds blow to the sides and in all directions.


Source: ESA/XMM-Newton

Tuesday, February 24, 2015

Dark Matter Guides Growth of Supermassive Black Holes

This illustration shows two spiral galaxies - each with supermassive black holes at their center - as they are about to collide and form an elliptical galaxy. New research shows that galaxies' dark matter halos influence these mergers and the resulting growth of supermassive black holes. Credit: NASA/CXC/M.Weiss.High Resolution (jpg) - Low Resolution (jpg)


Cambridge, MA -Every massive galaxy has a black hole at its center, and the heftier the galaxy, the bigger its black hole. But why are the two related? After all, the black hole is millions of times smaller and less massive than its home galaxy.

A new study of football-shaped collections of stars called elliptical galaxies provides new insights into the connection between a galaxy and its black hole. It finds that the invisible hand of dark matter somehow influences black hole growth.

"There seems to be a mysterious link between the amount of dark matter a galaxy holds and the size of its central black hole, even though the two operate on vastly different scales," says lead author Akos Bogdan of the Harvard-Smithsonian Center for Astrophysics (CfA).

This new research was designed to address a controversy in the field. Previous observations had found a relationship between the mass of the central black hole and the total mass of stars in elliptical galaxies. However, more recent studies have suggested a tight correlation between the masses of the black hole and the galaxy's dark matter halo. It wasn't clear which relationship dominated.

In our universe, dark matter outweighs normal matter - the everyday stuff we see all around us - by a factor of 6 to 1. We know dark matter exists only from its gravitational effects. It holds together galaxies and galaxy clusters. Every galaxy is surrounded by a halo of dark matter that weighs as much as a trillion suns and extends for hundreds of thousands of light-years.

To investigate the link between dark matter halos and supermassive black holes, Bogdan and his colleague Andy Goulding (Princeton University) studied more than 3,000 elliptical galaxies. They used star motions as a tracer to weigh the galaxies' central black holes. X-ray measurements of hot gas surrounding the galaxies helped weigh the dark matter halo, because the more dark matter a galaxy has, the more hot gas it can hold onto.

They found a distinct relationship between the mass of the dark matter halo and the black hole mass - a relationship stronger than that between a black hole and the galaxy's stars alone.

This connection is likely to be related to how elliptical galaxies grow. An elliptical galaxy is formed when smaller galaxies merge, their stars and dark matter mingling and mixing together. Because the dark matter outweighs everything else, it molds the newly formed elliptical galaxy and guides the growth of the central black hole.

"In effect, the act of merging creates a gravitational blueprint that the galaxy, the stars and the black hole will follow in order to build themselves," explains Bogdan.

The paper describing this work has been accepted for publication in the Astrophysical Journal. This result relied on data from the Sloan Digital Sky Survey and the ROSAT X-ray satellite's all-sky survey.

Headquartered in Cambridge, Mass., the Harvard-Smithsonian Center for Astrophysics (CfA) is a joint collaboration between the Smithsonian Astrophysical Observatory and the Harvard College Observatory. CfA scientists, organized into six research divisions, study the origin, evolution and ultimate fate of the universe.


For more information, contact:

Christine Pulliam
Public Affairs Specialist
Harvard-Smithsonian Center for Astrophysics
617-495-7463

cpulliam@cfa.harvard.edu


Exploring the colours of the Small Magellanic Cloud

Exploring the colours of the Small Magellanic Cloud
Copyright: ESA/NASA/JPL-Caltech/STScI 


Astronomical images often look like works of art. This picture of one of our nearest neighbouring galaxies, the Small Magellanic Cloud, is certainly no exception!

The scene is actually a collaboration between two cosmic artists — ESA’s Herschel space observatory and NASA’s Spitzer space telescope. The image is reminiscent of an artistic stipple or pointillist painting, with lots of small, distinct dots coming together to create a striking larger-scale view.

The colours within this image provide information about the temperature of the dust mixed with the gas throughout the galaxy. The slight green tint stretching towards the left of the frame and the red hue of the main body of the galaxy are from the Herschel observations, which highlight cold material, down to a chilly –260 degrees Celsius .

The brighter patches of blue were captured by Spitzer. These regions are made up of ‘warmer’ —about –150 degrees Celsius — gas and dust, and within some of these areas new stars are being born. These newborn stars in turn warm up their surroundings, resulting in intense clumps of heated gas and dust within the galaxy.

These clumps show up brightly in this image, tracing the shape of the galaxy clearly — the SMC is made up of a central ‘bar’ of star formation, visible on the right hand side, and then a more extended ‘wing’, stretching out towards the left of the frame.

Overall, the Small Magellanic Cloud is about 1/20th of the size of the Milky Way. It can be seen shining in the night sky of the southern hemisphere, and its brightest regions are easily visible to the naked eye. It is a satellite galaxy of our own — it orbits around the Milky Way along with its bigger companion, the Large Magellanic Cloud. These two galaxies have been extensively studied because of their proximity to us; astronomers can observe them relatively easily to explore how star formation and galactic evolution works in galaxies other than our own.

The data in this image are from Herschel’s Spectral and Photometric Imaging Receiver (SPIRE), Photodetector Array Camera and Spectrometer (PACS), and Spitzer’s Multiband Imaging Photometer (MIPS).

This image was previously published by NASA/JPL.

Source: ESA


Monday, February 23, 2015

JUPITER, a laboratory for studying exoplanets

The scientific journal Astrophysical Journal Letters is publishing a study, led by researchers at the Astrophysical Institute of the Canaries (IAC), which has been the subject of a report in the journal Nature. It the study Jupiter is presented as an ideal laboratory for research into exoplanets which are similar. Jupiter, the largest planet in the Solar System, has large satellites around it. The study has used the largest of the satellites, which is the biggest satellite in the Solar System, Ganymede, as a mirror to analyze the atmosphere of the planet. The observations were performed during an eclipse of Ganymede by Jupiter, and allowed the researchers to observe Jupiter as if it were a transiting exoplanet.

Its transmisión spectrum, observed as Ganymede began to be eclipsed, and could be observed through the atmosphere of Jupiter, shows strong extinction, reduction of the light due to clouds and to aerosols in Jupter´s atmophsere, as well as strong absorption in the characteristic bands of methane (CH4), and most surprising, ice crystals in a stratospheric layer. These results are of relevance to the modelling and the interpretation of transiting exoplanets, but they also offer a new technique to characterize the upper layers of Jupiter’s atmosphere, and to determine the abundance of water. It will also be useful in helping establish the rate of comet impact on Jupiter, and its consequences for the history of the formation of the Solar System.

The transit method

During the last two decades more than 1,800 exoplanets have been discovered, 65% of them using the transit method. This entails observing a star with very accurate photometry, to detect the slight drop in the intensity of its light when a planet passes in front of it. For a small proportion of these planets, those which orbit around the brightest stars, their atmospheres can be studied using the method of transmission spectroscopy, where one measures the difference between the light emitted and the light transmitted, which gives a “fingerprint” of the composition of the atmosphere. At the present time this is the most successful technique for probing the chemical composition of the atmospheres of exoplanets.


During the transit of the planet across the front face of the star, some of the light from the star is blocked, and only a ten thousandth part passes through the thin atmospheric layer of the planet (for a planet like Jupiter, and a star like the Sun), bringing with it information about its atmospheric layers and their components.

“In order to explore the limitations of this technique” explains Pilar Montañés, a researcher at the IAC and the first author of the article “ we have applied it to study the atmosphere of Jupiter. We have measured the transmission spectrum of Jupiter, observing it as if it were an exoplanet. Our method has been to take high resolution spectra of Ganymede, (Jupiter’s third satellite out) during its passage through the shadow of the planet. In spectrum obtained when we divide the spectra observed before and during the eclipse, the signals from the Sun, from the Earth, and from Ganymede itself, (which is on a synchronous orbit around Jupiter) are eliminated.”

The study shows that the strongest absorptions are due to methane, as one would expect for Jupiter. However the observation of the extinction due to clouds and to aerosol particles is also relevant. “Our results” explains Enric Pallé, an IAC researcher and co-author of the article “support previous results in which transmission spectroscopy indicated the detection of clouds and of aerosols in “hot Jupiters”. As the eclipse progresses, out method allows us to probe the atmosphere of the planet in greater depth.

However the most interesting signal which was detected, between 1.5 and 2.0 microns, is probably due to stratospheric clouds of ice crystals. “Our models,” notes Manuel López Puertas of the Astrophysical Institute of Andalucia (IAA-CSIC), “have allowed us to determine that the column of water ice contains 1,013 particles / cm2, a much larger quantity of water than that previously measured in the vapour state. We have also detected spectral lines of sodium iodide (NaI) in Jupiter´s atmosphere, due either to the continual deposit of sodium from comets, or to a continual flux of sodium from the satellite Io”.

Gabriel Pérez, SMM (IAC).

“This is the first time that this kind of observations has been performed from the ground, and have covered such a wide spectral range“ notes Beatriz González, another member of the team, who was also at the iAC when the study was carried out.

The observations were performed during two eclipses in 2012 using the LIRIS instrument on the William Herschel Telescope at the Roque de los Muchachos Observatory (La Palma), and the XSHOOTER instrument on the VLT (Very Large Telescope) at the Paranal Observatory of the European Southern Observatory (ESO) in Chile, in three spectral ranges: the ultraviolet, the visible, and the infrared. Similar observations had been previously obtained to obtain the transmission spectrum of the Earth using lunar eclipses, by Enric Pallé, Pilar Montañés, and their collaborators in 2009.


Reference:


"Jupiter as an exoplanet: UV to NIR transmission spectrum reveals hazes, a Na layer and possibly stratospheric H2O-ice clouds". ApJ Letters.


Contact:

Instituto de Astrofísica de Andalucía (IAA-CSIC)
Unidad de Divulgación y Comunicación
Silbia López de Lacalle - sll@iaa.es - 958230532


Classical Nova Explosions are Major Lithium Factories in the Universe

A team of astronomers from National Astronomical Observatory of Japan (NAOJ), Osaka Kyoiku University, Nagoya University, and Kyoto Sangyo University observed Nova Delphini 2013 (Figure 1, Figure 3) which occurred on August 14, 2013. Using the 8.2-meter Subaru Telescope High Dispersion Spectrograph (HDS) to observe this object, they discovered that the outburst is producing a large amount of lithium (Li; Note 1). Lithium is a key element in the study of the chemical evolution of the universe because it likely was and is produced in several ways: through Big Bang nucleosynthesis, in collisions between energetic cosmic rays and the interstellar medium, inside stellar interiors, and as a result of novae and supernova explosions. This new observation provides the first direct evidence for the supply of Li from stellar objects to the galactic medium. The team hopes to deepen the understandings of galactic chemical evolution, given that nova explosions must be important suppliers of Li in the current universe.

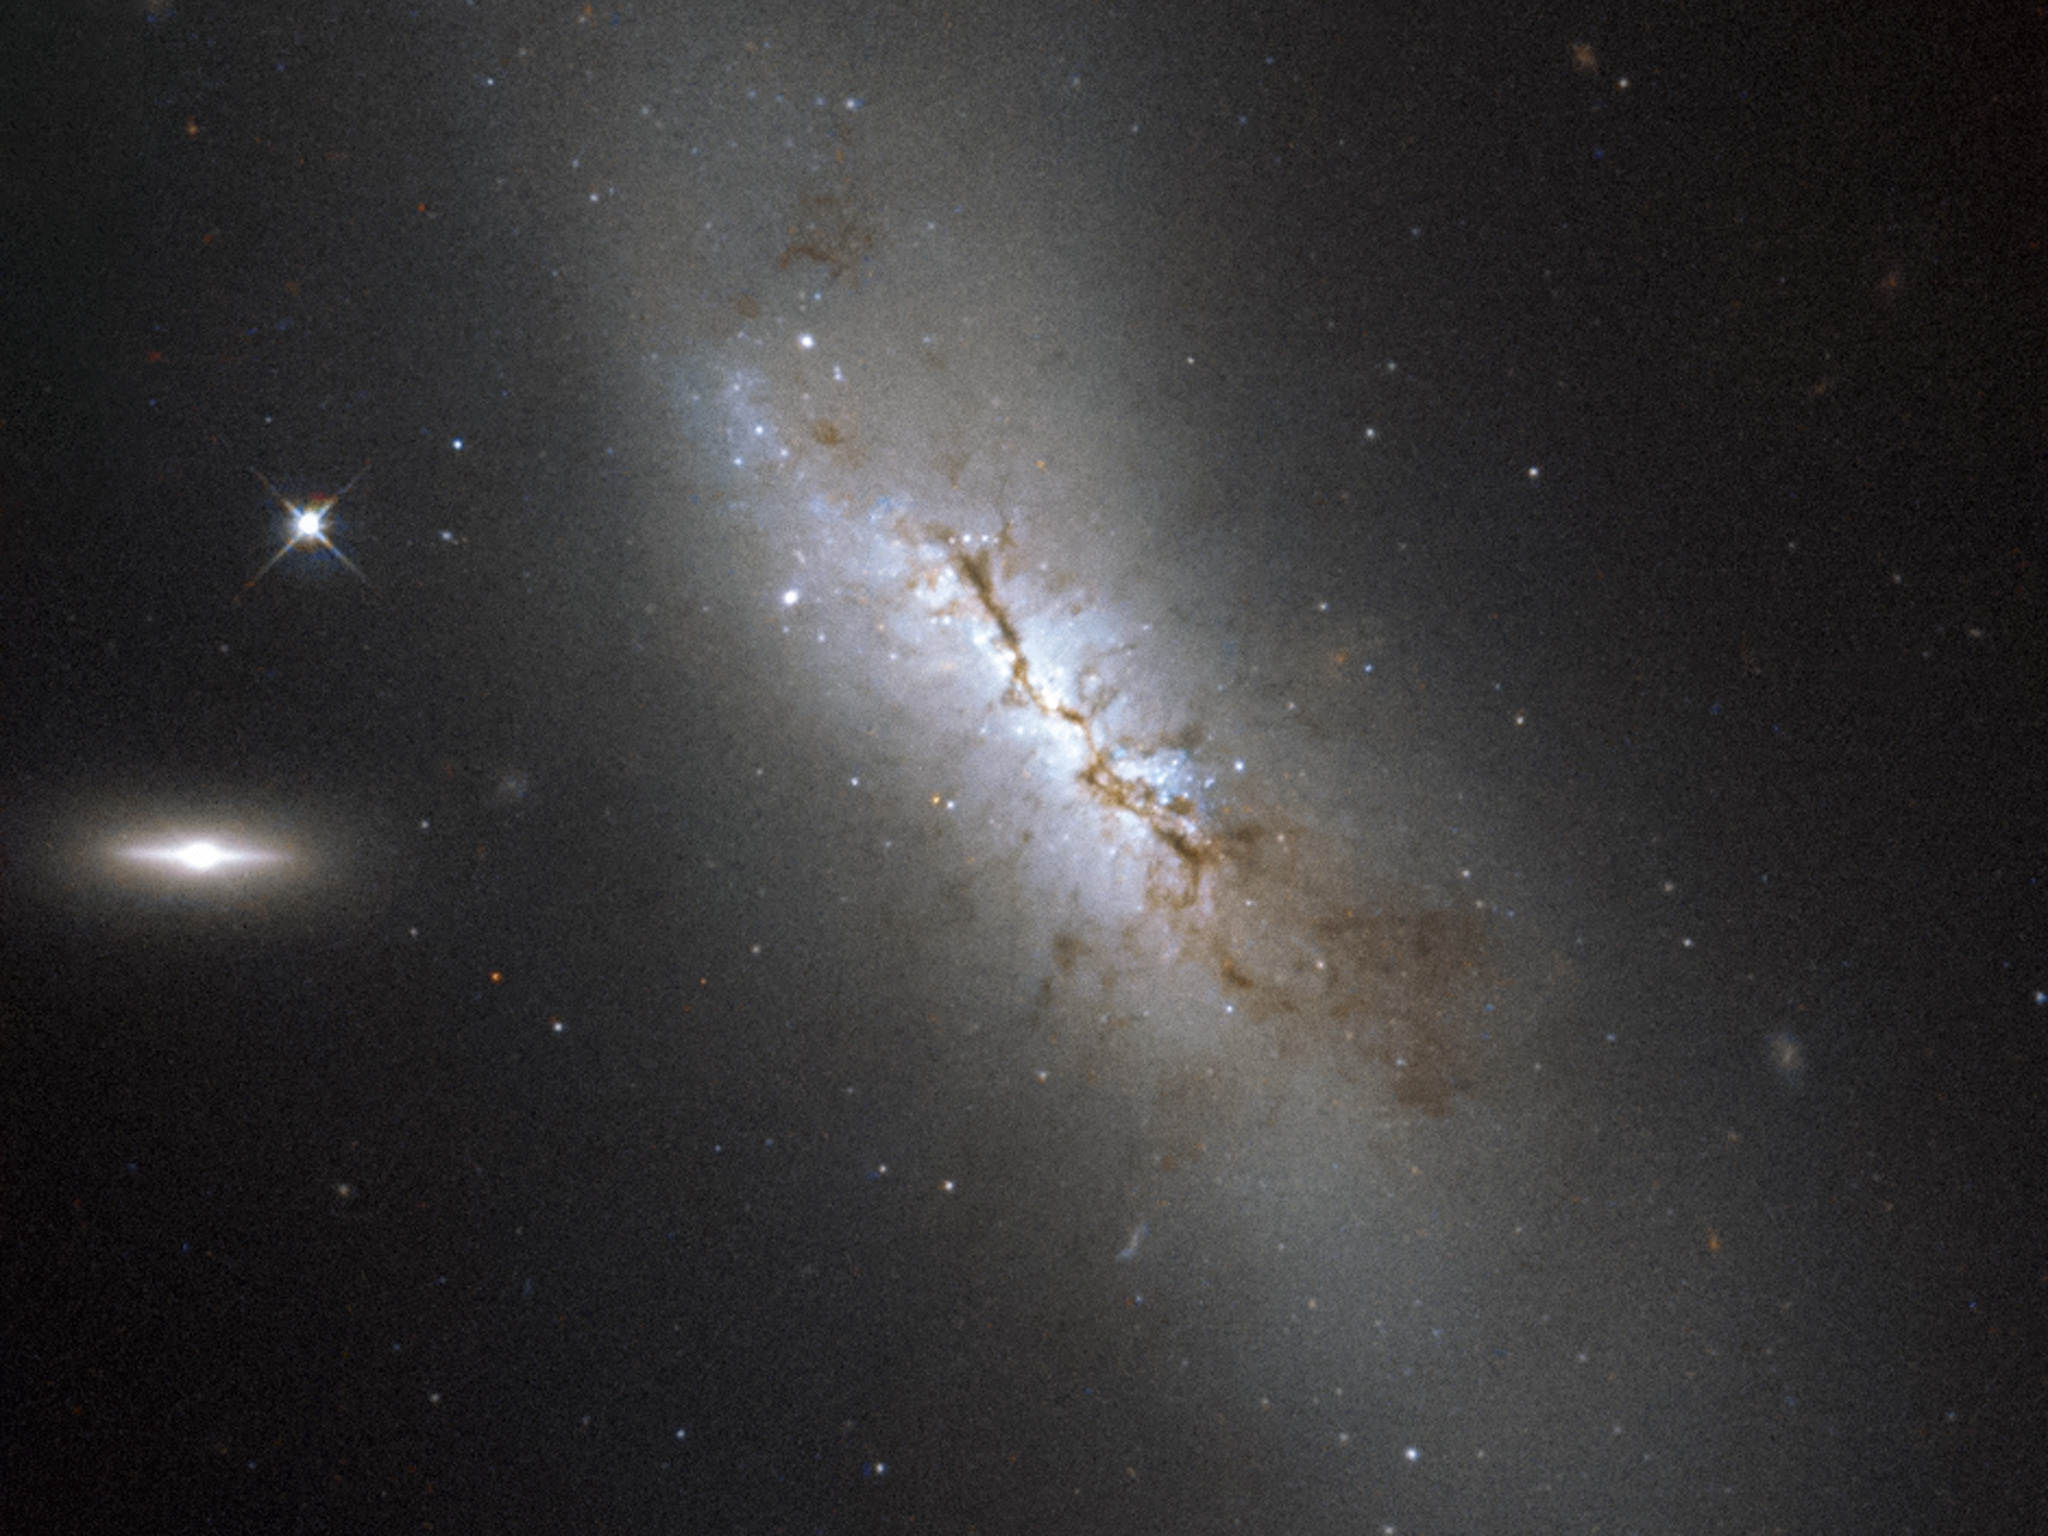
Figure 1: Artist's rendition of a classical nova explosion (Credit : NAOJ)
A classical nova explosion is thought to occur on the surface of a white dwarf (center right) with a close companion star (center left; a sun-like main sequence or more evolved star). When the distance between two stars is close enough, the outer gas of the companion starts to accumulate on the surface of the white dwarf via an accretion disk. The thicker gas layer on the white dwarf increases its temperature and density. Then, nuclear reactions occur with a different way from those inside stars. In the case of stellar interiors, the huge energy produced by nuclear reactions in the core is balanced by the gravity of the surrounding gas, and then the reaction becomes stable. However, the nuclear reaction in a thin gas layer on the surface of a white dwarf has a different result. It becomes a runaway nuclear reaction, and results in an explosion that blows away the gas layer.


Lithium: the Key to Understanding the Nucleosynthesis in the Universe

The universe consisted primarily of hydrogen (H) and helium (He) immediately after the Big Bang except for very small amounts of Li. Since there are other elements heavier than H and He in the universe now, astronomers want to understand how the heavy elements -- such as carbon (C), oxygen (O), and iron (Fe) (which are present in our bodies) -- are produced. Such heavy elements are mainly produced in stellar interiors or supernovae. Then, they are supplied to the interstellar medium as seed materials for next generation of stars.

Li is the third lightest element following H and He, and is familiar to us as the base material for the Li-ion batteries used in PCs, smart phones, eco-cars, etc. Big Bang nucleosynthesis produced a very small amount of Li (Note 2). Collisions between galactic cosmic rays (energetic atomic nuclei traveling with very high speeds) and atomic nuclei in the interstellar medium are also assumed to produce Li by breaking heavy elements' nuclei (e.g., C, O). Low-mass stars like the Sun, and events such as supernova explosions are also considered as candidates of Li production sites. Furthermore, scientists have been assuming that novae should also produce this element (Figure 2).

Because many sites and events can produce Li as described above, Li is the best indicator to probe the complete chemical evolution of the universe. Many scientists have studied this element by measuring the amount of Li found in various stars in our galaxy. This allowed them to estimate the amount produced through each process. Today, as a result of these indirect approaches, low-mass stars or nova explosions are thought to be the most important candidates for Li production in the current galaxy epoch. (Note 2). However, there have been no direct observations of the processes (Note 3).

Figure 2: Nucleosynthesis in the universe (Credit : NAOJ)
Heavy elements such as C, O, and Fe are mainly produced in stellar interior and/or supernova. On the other hand, Li might be produced in many other ways: in the Big Bang, galactic cosmic ray collisions. Li production in stellar originating objects has not been confirmed yet by observations, as designated by "?" marks.


Nova Delphini 2013

On August 14th, 2013, the well-known Japanese amateur astronomer Koichi Itagaki found a bright new star in the constellation Delphinus (Figure 3). This star, which was named Nova Delphini 2013 (=V339 Del), was at magnitude 6.8 at discovery and peaked at 4.3 mag within two days. It was the first naked-eye nova since 2007, when V1280 Sco was found. About 40 days later, in September 2013, a team of astronomers observed the nova to investigate the materials expelled by the explosion. That is when they found that the nova produced a large amount of Li.


Figure 3: Discovery images of Nova Delphini 2013 (Credit : Koichi Itagaki)
The upper left anel is before the explosion (about 1 day). The upper right shows the nova after the explosion. The bottom is the confirmation image taken with the 60-cm telescope.

This nova is an object within our galaxy. Its distance is about 14,000 light-years. The nova became about 150,000 times brighter at the maximum, compared with old pre-explosion images.

Nova Delphini 2013 is considered one of the "classical novae". These brighten when explosive nuclear reactions occur in materials accumulated on the surface of a white dwarf star in a close binary system. The nuclear reactions are thought to produce a different series of elements (compared to those produced in stellar interiors or supernova explosions). Li is assumed to be an element typically produced in such outbursts. Historically, no one has been able to get good observational evidence for its production in nova explosions.


Discovery of a Beryllium Isotope (7Be) to Form Lithium in Nova Spectra

When the research group observed Nova Delphini 2013 using the Subaru Telescope, they used the High Dispersion Spectrograph to discern the constituents of the expelled materials from the nova explosion at four epochs (Figure 4).

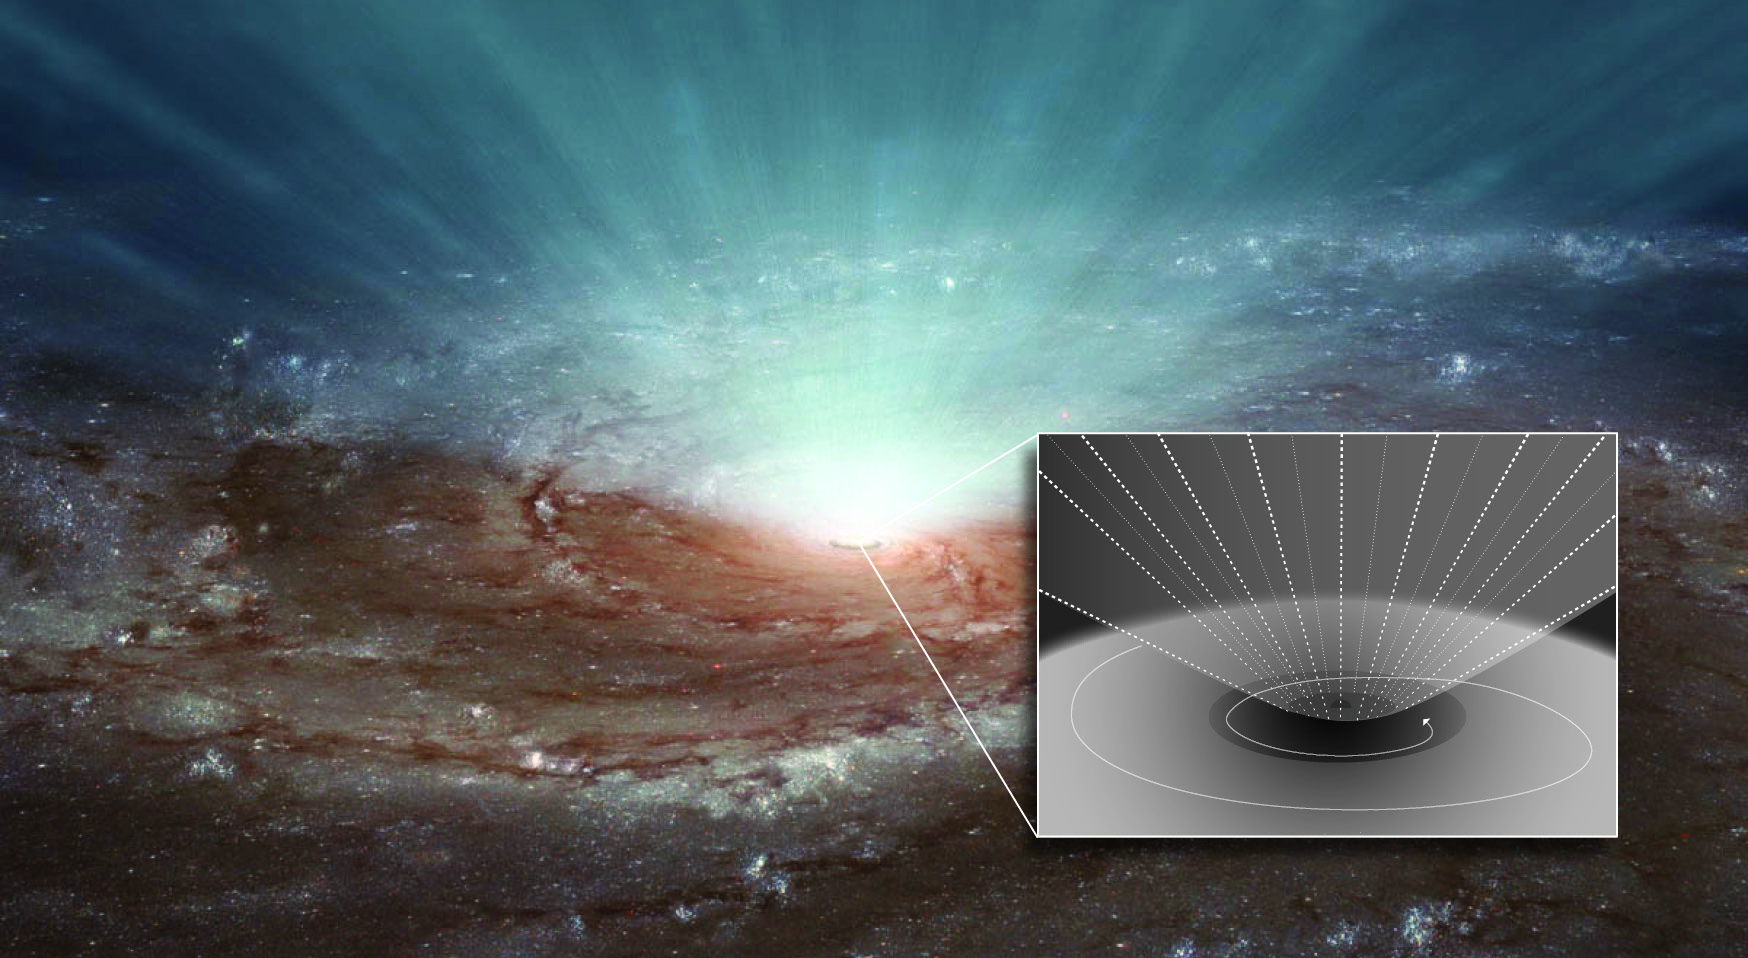
Figure 4: How does the light from the nova reach observers? (Credit : NAOJ)
After the explosion, the material in the region around the white dwarf is very hot and has a very high density. The light radiated by the white dwarf passes through some of the gaseous blobs blown away by the explosion, and that light reaches observers. Each element in the blobs absorbs the light at a specific wavelength. Because each blob has a different velocity (~1000 km/s), the nova spectrum shows many groups of weak absorption lines created by various elements.

Absorption lines originating from many elements such as H, He, and Fe are identified in the observed spectra (Note 4). Among them, there are sets of strong absorption lines in the ultraviolet (UV) range (wavelength ~313 nanometers) of the spectrum (Note 5). Comparing these lines with other lines originating from H, calcium (Ca), and other elements, it turns out that they are originating from an isotope of beryllium (Be), 7Be, which is the fourth-lightest element in the universe (Figure 5).

Figure 5: The absorption lines originating from hydrogen (Hη), singly ionized calcium (Ca II K), and the doublet originating from singly ionized 7Be (red and blue) in the observed spectrum (Credit : NAOJ)

The spectrum was taken with HDS 47 days after the explosion. The vertical axis shows the flux (+ constants for offsets). The horizontal axis shows the radial velocity (kilometers per second) calculated from the rest wavelengths of each absorption line. It is found that all lines have two components of velocities at -1268 and -1103 km/s. Furthermore, the Be absorption lines clearly show that they originate from a radioactive isotope 7Be, instead of the only stable isotope 9Be (green vertical lines;
Note 6). 

In a classical nova, the isotopes of He (3He) and plentiful 4He transferring from the companion are fused together to form radioactive 7Be in a very high-temperature environment on the surface of a white dwarf. This radioactive isotope decays to form an isotope of lithium (7Li) within a short time (half-life of 53.22 days) (Figure 6). Because 7Li is very fragile in a high-temperature environment, it is necessary to transport 7Be to a cooler region in order to enrich Li in the interstellar medium. Novae completely fill this requirement. Therefore, they are assumed to be strong candidates as suppliers of Li in the universe. 

Figure 6: Nuclear reactions to form 7Be, and then 7Li in classical nova explosions (Credit : NAOJ)
At the time of an explosion, 3He and 4He are fused to form 7Be (blue arrows). Then, 7Be gradually decays into 7Li (via electron capture) in gas blobs blown away by explosive winds (green arrows).

This discovery of 7Be within 50 days after the nova explosion means that this explosion is actually producing a large amount of 7Li formed from 7Be. Because 7Be is found in the gas blobs blown away from the central region of the nova at high velocities (~1000 km/s), 7Li formed from this 7Be should not be destroyed in a high-temperature environment. This 7Li spreads into interstellar space, and will be included in the next generation of stars. It is found that the 7Be abundance in the gas blobs estimated from the strengths of their absorption lines is comparable to that of Ca. This amount of 7Be (= 7Li) should be quite large, given that Li is known as a very rare element in the universe (Note 7).


Impact of this Research

The amount of Li rapidly increases in the galaxy in the current epoch, where the amounts of heavy elements have increased. Therefore, it has long been speculated that low-mass stars with longer lifetimes should be among the major suppliers of Li in the universe. Because nova explosions occur in binary systems evolved from such low-mass stars (especially 3He-rich companion, which is necessary to produce 7Be), they are strong candidates as Li suppliers. The observations made using the Subaru HDS provide the first strong evidence to prove that novae produce significant amounts of Li in the universe. This discovery confirms the chemical evolution model from the Big Bang to the present universe, as predicted by scientists.

Furthermore, the observed amount of Li produced in this nova explosion is proven to be higher than predicted by theoretical estimates. Nova Delphini 2013 shows rather typical characteristics of classical novae. If other novae also produce a large amount of Li as Nova Delphini 2013 did, nova explosions must be recognized as very major Li factories in the universe. In near future, more observations of other nova explosions will provide much clearer model of Li evolution.

This research was published in Nature on February 19, 2015, titled "Explosive lithium production in the classical nova V339 Del (Nova Delphini 2013)".


Authors:

  • Akito Tajitsu (Subaru Telescope, National Astronomical Observatory of Japan)
  • Kozo Sadakane (Osaka Kyoiku University, Japan)
  • Hiroyuki Naito (Nagoya University/ Nayoro Observatory, Japan)
  • Akira Arai (Kyoto Sangyo University/University of Hyogo, Japan)
  • Wako Aoki (National Astronomical Observatory of Japan)


Notes:

1. Lithium is composed of two stable isotopes -- 6Li and 7Li. In the solar system, about 92 percent of Li is 7Li. In this press release, "Li" means the most abundant 7Li.

Figure 7: Schematic diagram of Li evolution in the universe (Credit : NAOJ)
The vertical axis shows the number ratio of Li and H. The horizontal axis shows the amount of heavy elements (ratio to solar abundance). The farther to the right a star lies in the diagram, the more heavy elements it has and the younger it is. The red curve in the diagram presents the upper envelope of the observed Li abundance [Reference : Prantzos, N., A&A 542, A67 (2012)]. To explain the shape of this curve, scientists assume that there are three sources for Li production: (1) nucleosynthesis in the Big Bang (should be a constant in the diagram = blue), (2) Li production in objects or events originating from massive stars (e.g. supernova explosions, spallation of nuclei triggered by galactic cosmic rays), which begins its contribution in the early universe (orange), and (3) Li production in low-mass (=longer lifetime) stars (e.g. nova explosions), which begins in the recent universe, where the amount of heavy elements exceeds 10 percent of the solar value (green). In particular, the contribution of the third component must be dominant in the current universe, though scientists have been unable to get any signs of Li production in low-mass stellar components. 

2. Many scientists have tried to measure Li abundances in various stars in the galaxy to investigate the origin of Li in the universe. Figure 7 displays a schematic diagram of their results. Stars with amounts of low heavy elements were born in the early universe. Big Bang is presumably the primary source of Li in these stars. Indeed, their Li abundance is almost constant independent of the amount of other elements like iron. However, the value is known to be a few times lower than the theoretical prediction for the Big Bang nucleosynthesis. Many scientists have been working to solve this problem. On the other hand, stars with higher abundance of heavy elements were born in the more recent universe (> a few Gyrs from Big Bang). They look to have significantly more Li. To explain this rapid increase in Li, astronomers have assumed that Li production in low-mass stars or nova explosions should be dominant in the universe today, surpassing production in supernovae or in the interstellar medium. 

3. Some low-mass (a few solar masses) evolved stars have been found to have Li-enriched surfaces. They are also possible Li-suppliers in the universe. However, Li should be destroyed within a high temperature environment (hotter than 2,500,000 K). If the Li production in these stars is stopped at once, such Li could be easily depleted by interior convection. Therefore, it is still unknown how these stars contribute to Li-enrichment in the interstellar medium.

Figure 8: HDS spectrum taken on 38 days after the explosion (Credit : NAOJ)
Each vertical axis shows the flux of the spectrum. The horizontal axis in the top panel shows the wavelength (in nanometers). Those in the three lower panels show the radial velocities (in kilometers per second) calculated from the rest wavelengths of each line. Zooming into several emission lines originating from singly ionized iron (Fe II), there is a set of weak absorption lines with common velocity components. Such weak absorption lines are also found in other lines originating from H or other species.

4. The most brilliant features in the HDS spectrum obtained on 38 days after the explosion are many broad emission lines originating from H, He, Fe, and other species in the diffuse expanding gas (upper diagram in Figure 8). Zooming into each emission line, the research group found that each line has a similar set of weak absorption lines on its blueward wing.

Figure 9: HDS spectrum in UV range (47 days after the explosion) (Credit : NAOJ)
The lower three panels (a, b, and c) show the enlarged views of the colored region in the top panel. Each vertical axis shows the flux of the spectrum. Each horizontal axis shows their wavelength (in nanometers). The three lower panels are shown in a same radial velocity scale (the upper horizontal axis in kilometers per seconds). It is clear that there are same blue-shifted components in hydrogen (Hη), calcium (Ca II K), and beryllium (Be II).

5. Figure 8 (to the left of the upper diagram) shows that HDS has enough sensitivity even in the UV range (wavelength < 400 nanometers). This is achieved by the combination of the excellent site location (high altitude = 4200 meters), the large aperture of the Subaru Telescope, and the high UV sensitivity of the detectors. There are only a few instruments in the world that achieve good quality spectra in the UV range. In Nova Delphini 2013, enormous sets of weak absorption lines mentioned in Figure 8 and Figure 9 are found in this wavelength range. 

6. Be has only one stable isotope, 9Be, in the universe. However, the absorption lines in 313 nanometers are found to be originating from the other isotope, 7Be, instead of the stable 9Be. 7Be is a radioactive isotope, which decays to form 7Li within a short time (half-life: 53 days). Since the 1970s, scientists have theorized that this isotope is produced in nova explosions or at other sites in the galaxy [reference : e.g., Cameron, A. G. W. & Fowler, W. A., ApJ 164, 111-114 (1971)]. However, nobody could find this isotope in such candidate sites because of its very short lifetime.

7. The abundance of 7Be estimated from the strengths of absorption lines is found to be about 0.04 percent of the total expelled mass in this nova explosion (~0.000000006 percent in the solar surface, ~0.002 percent in the earth's crust). This abundance is about six times larger than those from theoretical estimates.