Showing posts with label American Astronomical Society. Show all posts

Thursday, September 04, 2025

All Alone With No AGN to Call Home? New Results for Little Red Dots

JWST images of six very distant galaxies dubbed "little red dots."
Credit
: NASA, ESA, CSA, STScI, Dale Kocevski (Colby College)

Among the discoveries JWST has made since its 2021 launch, “little red dots” are one of the most perplexing. Named for their compact size and red color, the origins of these distant galaxies remain unknown. A recent article explores some little red dots’ spectral energy distributions and local environments to better understand what may be lighting up these tiny torches.

Little Red Dot Dilemma

Along with their size and color, little red dots exhibit “V”-shaped spectral energy distributions (how they emit light across wavelengths), broad hydrogen emission lines, and no observed X-ray emission. These properties land them in an untapped parameter space with some similarities to both active galactic nuclei (AGNs) and stellar populations. Some previous investigations have suggested that little red dots contain AGNs, reddened by a dusty accretion disk scattering or blocking AGN light. Other studies have found that models for stellar populations can also fit certain little red dot spectra well.

Adding to the ambiguity, observations and theory predict AGNs to show broad spectral lines, which are present in little red dots — but if little red dots are AGNs, this implies a much higher density of AGNs in the early universe than previously predicted by ground-based surveys. Furthermore, AGNs are expected to emit in the X-ray and show photometric variability, but neither property has been detected definitively thus far for a little red dot. With a clear dilemma arising for the origins of little red dots, astronomers are still prodding at these curious sources.

Comparison of AGN versus non-AGN fits using the Bayesian information criterion (BIC). Positive values of ΔBIC favor a non-AGN fit, and ~70% of little red dots have positive ΔBIC. Credit: Carranza-Escudero et al 2025

AGN or Not?

Leveraging the wealth of data available from recent JWST surveys, María Carranza-Escudero (University of Manchester) and collaborators built a sample of 124 little red dots spanning redshifts of z ~ 3–10. The authors used both AGN and non-AGN models to fit the spectral energy distribution for each galaxy.

Using a robust statistical analysis, the authors found that AGN models tend to “overfit” the data — with more free parameters, an AGN model can be tweaked in a way that may not actually be physical (e.g., fitting for extremely high dust extinction that would not be possible). Instead, models without AGN components appear to be more appropriate for about 70% of the little red dots in their sample, suggesting that these peculiar objects may have a significant star-forming component powering their emission.

Histograms for two redshift windows showing that little red dots (red) tend to be found in less dense environments than other galaxies (blue) in the same redshift window. Credit: Carranza-Escudero et al 2025

Lonely Neighborhoods

In addition to characterizing little red dots’ emission, the authors analyzed the local environments to compare to other galaxies at similar redshifts. From their analysis, they found that little red dots tend to be found in sparser environments, generally isolated from other galaxies. One explanation for this could be that little red dots in higher-density environments evolve past this peculiar stage faster, which is supported by observations of high-density environments accelerating the evolution of other galaxy types at similar redshifts. However, further investigation is required to better understand the connection between the local environment and little red dot properties.

More little red dots are yet to be discovered, and continued analysis of their emission and environments will uncover more intriguing characteristics. For now, it seems as though little red dots are still a mystery.

By Lexi Gault

Citation

“Lonely Little Red Dots: Challenges to the Active Galactic Nucleus Nature of Little Red Dots through Their Clustering and Spectral Energy Distributions,” María Carranza-Escudero et al 2025 ApJL 989 L50. doi:10.3847/2041-8213/adf73d


Friday, August 29, 2025

A Dusty Disk Points to a Potential Planet

Hubble Space Telescope observations of the Beta Pictoris debris disk, which led to a planet discovery.
Credit:
NASA, ESA, and D. Apai and G. Schneider (University of Arizona)

JWST observations of a nearby star’s debris disk recently revealed what may be one of the lowest-mass planets ever imaged.

How to Find a Small Planet

Though it remains a formidable technical challenge, astronomers have gotten fairly good at taking images of planets around other stars by carefully blocking the light of the host and searching for the small points of light that remain. However, though this technique is well-suited for discovering large, bright, high-mass planets, their lower-mass cousins below the size of Jupiter remain challenging to detect. To get pictures of these smaller worlds, astronomers must resort to detective work and search for signs of their presence through indirect means.

One promising approach is to look not for the planet itself, but rather its effect on the dusty disk of material around the star. These structures, called debris disks, are constantly replenished by planetesimals colliding and grinding one another to dust. If a planet happens to orbit within this disk, it will “stir” the dust into distinctive patterns including rings and spiral arms. If astronomers observe that a star has a debris disk with gaps or spirals, they can analyze those substructures and deduce where a planet might be hiding.

A mid-infrared image of TWA 7’s debris disk and candidate planet.
Credit:
ESA/Webb, NASA, CSA, A.M. Lagrange, M. Zamani (ESA/Webb); CC BY 4.0

The Star of this Show: TWA 7

TWA 7 is a tiny M-dwarf star just over 100 light-years from Earth. Data from the Spitzer Space Telescope revealed that TWA 7 was unusually bright when observed at infrared wavelengths, which hinted that there might be a warm, dusty disk surrounding the star. Follow-up observations with the Hubble Space Telescope and several major ground-based facilities confirmed that this star successfully met all the conditions listed above: TWA 7 is surrounded by a face-on debris disk with rings and a faint spiral arm. Using all of this information, astronomers predicted that a Saturn-mass planet might lie in a low-density pocket of the disk just beside the star.

This prediction led to a search with JWST last summer. Initial observations taken at mid-infrared wavelengths revealed a bright dot sitting near the predicted location of the planet. However, with just these observations, it was hard to confidently say that this source wasn’t just a distant background galaxy that happened to appear there by chance. To help settle the matter, JWST took another look in two different near-infrared wavelength bands a few weeks later.

New JWST observations of TWA 7. The sources labeled C5 and C6 are planet candidates. C6 is located at the same place as the planet candidate identified in mid-infrared observations, making it a strong candidate. C5 requires further observations to understand if it is real or an artifact. Credit: Crotts et al. 2025

Revisiting TWA 7

A team led by Katie Crotts (Space Telescope Science Institute) recently published these later observations. These new data show a dot in the exact same place as before, and with a color that’s much more planet-like than galaxy-like.

While this adds plenty of evidence to the planetary interpretation, the team cautions that one more set of follow-up observations is needed to be confident that this is, in fact, a planet. Assuming future observations back up these first hints, however, this would be the lowest-mass planet ever imaged, and a happy conclusion to a detective story that started with dust.

By Ben Cassese

Citation

“Follow-Up Exploration of the TWA 7 Planet–Disk System with JWST NIRCam,” Katie Crotts et al 2025 ApJL 987 L41.

doi:10.3847/2041-8213/ade798


Thursday, August 21, 2025

Examining Earendel: Is the Most Distant Lensed Star Actually a Cluster?

WST image of the galaxy cluster WHL0137-08 (left) and a beautifully lensed high-redshift galaxy called the Sunrise Arc (right). A label indicates the location of Earendel, a source that has been interpreted as the most distant lensed single star.
Image: NASA, ESA, CSA, D. Coe (STScI/AURA for ESA; Johns Hopkins University), B. Welch (NASA’s Goddard Space Flight Center; University of Maryland, College Park). Image processing: Z. Levay


Record-Breaking Discovery

In 2022, astronomers using the Hubble Space Telescope reported the discovery of the most distant single star candidate ever seen, now pinpointed to have a redshift of z = 5.926. The star, named Earendel, is an incredible beacon from the first billion years of the universe, standing out brilliantly from the red smear of its host galaxy, the Sunrise Arc.

But there’s a catch — at the distances involved, distinguishing between one star and many isn’t easy, and Earendel might not actually be just one star. New research uses stellar population modeling to explore the possibility that what has been touted as a single star is really a cluster.

JWST spectra of Earendel (top) and 1b (bottom), along with the best-fitting models
Credit:Pascale et al. 2025

The Light of Earendel, Our Most Beloved Star… Cluster?

The question sounds simple: does the light from Earendel resemble that of one star, or does it more closely align with the emission from a collection of many stars? What complicates matters is that Earendel’s light has been warped and magnified by an intervening galaxy cluster in a process called gravitational lensing. Because the degree of magnification isn’t known precisely, it’s not clear exactly how large the source is — leaving wiggle room for Earendel to be one or many stars.

To investigate Earendel’s identity, Massimo Pascale (University of California, Berkeley) and collaborators fit a simple stellar population model to JWST Near-Infrared Spectrograph (NIRSpec) spectra of both Earendel and another source in the Sunrise Arc called 1b, which is widely accepted to be a star cluster. The model varied the age of the cluster, its metallicity, the amount of dust it contains, and other factors. To make the modeling more rigorous, the team also used three different stellar population model libraries.

Both Earendel and 1b were well fit by all three stellar population models, supporting the hypothesis that Earendel is a cluster. Earendel and 1b share certain similarities, such as metallicity (less than 10% of the Sun’s), stellar surface density (high, rivaling the maximum density seen in the local universe), and age (more than 30 million years old).

Metallicity and formation age of star clusters in the local universe, in the Milky Way and Magellanic Clouds, and at high redshifts. Credit: Pascale et al. 2025

Given the potential ages and metallicities of the two sources, it’s possible that both Earendel and 1b are the precursors to today’s globular clusters. These clusters may fit into an evolutionary sequence that connects other lensed star clusters, such as the redshift z = 10.2 Cosmic Gems clusters and the z = 1.4 Sparkler clusters.

While this work demonstrates that Earendel could be a cluster, it doesn’t prove that it is. Doing so is challenging, especially since certain features predicted to exist for a single star might be beyond our observational capabilities, or they could be reproduced by clusters with certain properties. The authors pointed to one smoking-gun signal for Earendel being a single, massive star: brightness fluctuations due to microlensing by stellar winds. So far, no such variability has been found, and the cluster hypothesis remains viable.

By Kerry Hensley

Citation

“Is Earendel a Star Cluster?: Metal-Poor Globular Cluster Progenitors at z ∼ 6,” Massimo Pascale et al 2025 ApJL 988 L76. doi:10.3847/2041-8213/aded93


Saturday, August 16, 2025

Ultra-High-Energy Neutrino Emission on the Extragalactic Express: A Mystery

Radio image from MeerKAT of a galaxy nicknamed Phaedra, one of three main suspects in a hunt for a neutrino emitter.
Adapted from Filipović et al. 2025

Title: ASKAP and VLASS Search for a Radio-Continuum Counterpart of Ultra-High-Energy Neutrino Event KM3–230213A
Authors: M. D. Filipović et al.
First Author’s Institution: Western Sydney University
Status: Published in ApJL

The Scene of the Crime

On Galentine’s Day this year, an ultra-high-energy neutrino attempted to sneak through the Mediterranean Sea, likely expecting she wouldn’t be caught. The odds were in her favor; neutrinos, ghostly particles with no electric charge and infinitesimal mass, only very rarely interact with matter. However, what she failed to account for was the awaiting undersea neutrino detector, KM3NeT, and the clever lepton within who would finally notice her. She slammed into the lepton, spewing charged particles everywhere at speeds greater than the speed of light in the water. While no particle can outrun a photon in a vacuum, water slows light down, giving us the familiar effect of refraction; similar to supersonic jets creating a boom when they break the sound barrier, these charged particles produced a distinctive blue light, known as Cherenkov light, exposing the neutrino’s position to astronomers and physicists everywhere. Busted.

The Investigation Begins

However, the neutrino was only the messenger; of even more interest is the astrophysical object that produced her. It’s not easy to generate such a high-energy particle, and no one can create a neutrino from thermal emission alone, indicating that wherever she originated, something extreme was going on. To date, only three astrophysical sources have been caught emitting neutrinos at all, and none of them are extragalactic: the Sun, although this is old news (in the 1960s, detections of solar neutrinos showed definitively that the Sun is powered by nuclear fusion, resolving the issue of how the Sun has burned long enough for life to evolve on Earth); the nearest core-collapse supernova to our galaxy in modern times, SN 1987A; and the galactic plane.

Theoretical models predict a much wider variety of objects, including extragalactic sources, to produce neutrinos, usually via cosmic-ray production: supernova remnants, star-forming galaxies, gamma-ray bursts, supermassive black holes (which are found at the centers of most galaxies), active galactic nuclei (a particularly fussy subset of supermassive black holes that are eating their host galaxies), and blazars (an extreme subset of active galactic nuclei that emit jets of radio light directly at Earth). The reason we have not detected their predicted neutrino emission is that neutrino astronomy is a new field, extragalactic sources are super far away, and neutrinos are both difficult to detect and difficult to trace back to their origin.

Rounding Up Suspects

With this in mind, today’s authors embark on a quest to catch the culprit, starting in the radio band. Radio emission, like neutrino emission, is usually an indicator of non-thermal radiative processes, and one such process, synchrotron radiation (emitted by relativistic electrons getting spun around in powerful magnetic fields), can be distinguished from other types of radiation based on its radio characteristics. Conveniently, the region our neutrino hails from is spanned by multiple radio surveys conducted with the Very Large Array (VLA) and the Australian Sub-Kilometer Compact Array Pathfinder (ASKAP), and so our authors use these surveys to round up all the radio riffraff. Unfortunately, the long wavelengths of radio photons and the scarcity of neutrinos result in reduced resolution for both compared to traditional optical telescopes, and our authors find over a thousand radio emitters in the region. Of course, no one can question that many sources, so our authors limit their investigation to objects with at least two radio brightness measurements, which can be used to calculate the brightness as a function of radio wavelength (the spectral energy distribution, which tells us about what type of radiation we see) and/or as a function of time (a light curve, which tells us if our source is variable). Our authors settle on a lineup of 10 likely blazars, any of whom could have emitted our ultra-high-energy neutrino, as well as a shortlist of prime suspects warranting further investigation: Phaedra, a spiral galaxy; Hebe, a radio galaxy; and Narcissus, an unusual compact radio emitter (see Figure 1).

Figure 1: Radio emission detected by ASKAP in the region of the sky in which the neutrino originated. Every yellow dot should be considered suspect, but the three colored squares identify the primary guilty parties: Phaedra (in blue), Hebe (in yellow), and Narcissus (in pink). Credit: Filipović et al. 2025

Phaedra: A Spiral Galaxy with a Secret?

Phaedra (Figure 2), the most radio-luminous in the area, exhibits plenty of behavior typical of a galaxy guilty of neutrino emission. For starters, she has two regions of highly concentrated radio emission, and these regions are offset from her center, making them look suspiciously like active galactic nucleus jets, which are excellent particle accelerators. Furthermore, infrared observations suggest she is a starburst galaxy, churning out stars faster than a bestselling author with a team of ghostwriters churns out books. This intense star formation could have easily been triggered by jet activity. Even more suspiciously, she is closely associated with an X-ray binary, and where there are high-energy photons, there are likely to be other high-energy particles like neutrinos and cosmic rays. Phaedra’s prospects of beating the neutrino emission allegations are not looking good; these high-energy phenomena produce buckets of high-energy particles, and even if they produce only cosmic rays, the cosmic rays are bound to crash into the surrounding dense gas and photons, creating neutrinos anyway.

Figure 2: Radio image of Phaedra, one of our suspects. The east and west components are the likely radio jets, and the third bright blob is the radio counterpart to the X-ray binary, SXPS J062657.7-082939. Adapted from Filipović et al. 2025

Hebe: A Simple Radio Galaxy, or Something More?

Hebe (Figure 3), the nearest extended radio source, isn’t exactly innocent-looking either. She is one of a triplet of galaxies sharing a common envelope, like peas in an extragalactic pod. Galaxies, unlike peas, however, are so massive that they can’t help but interact dynamically in such close quarters, causing a commotion that could totally produce ultra-high-energy neutrinos. She likely also has an active galactic nucleus jet, giving her the same neutrino-wielding powers as Phaedra.

Figure 3: An infrared image of Hebe that clearly shows the common envelope surrounding the triplets. The white contour lines denote levels of polarized intensity, which indicate the presence of a magnetic field. Adapted from Filipović et al. 2025

Narcissus: Double Active Galactic Nucleus?

Our final suspect, Narcissus (Figure 4), consists of not one, but two active galactic nuclei. One appears to exhibit the classic synchrotron spectral energy distribution, and the other is likely a blazar, based on his notable radio variability and infrared observations.

Figure 4: Infrared image of Narcissus, with the purple contours outlining the two radio sources that are likely active galactic nuclei. Adapted from Filipović et al. 2025

Solving the Mystery

So, who really emitted the ultra-high-energy neutrino? For now, our authors can’t jump to any firm conclusions — they’d never risk condemning an innocent galaxy — but they will continue to closely monitor the suspects and gather more evidence. In the meantime, Phaedra, Hebe, and Narcissus should find themselves a good defense attorney experienced in neutrino emission cases.

Original astrobite edited by Sandy Chiu.


Editor’s Note: Astrobites is a graduate-student-run organization that digests astrophysical literature for undergraduate students. As part of the partnership between the AAS and astrobites, we occasionally repost astrobites content here at AAS Nova. We hope you enjoy this post from astrobites; the original can be viewed at astrobites.org.


About the author, Chloe Klare:

I’m a PhD student in astronomy and astrophysics at Penn State (with a physics minor, so I get to use my semester spent in QFT for something!). I study active galactic nuclei (in the radio!), and I’m currently looking for baby synchrotron jets in active galactic nuclei.


Monday, July 28, 2025

Escaping the Dust Trap: Simulations of Dust Dynamics in Protoplanetary Disks

Radio images of protoplanetary disks where planets form around newly born stars.
Credit:
ALMA (ESO/NAOJ/NRAO), S. Andrews et al.; NRAO/AUI/NSF, S. Dagnello; CC BY 4.0

Through detailed simulations of gas and dust, a recent study revealed that the behavior of dust within protoplanetary disks is a bit more complex than previously assumed.

Dust Traps in Protoplanetary Disks

As a planet forms within a protoplanetary disk — dust and gas orbiting a new star — tidal interactions between the budding body and the dusty material surrounding it can create pressure bumps where dust builds up. These dust traps appear as rings in observations of protoplanetary disks.

Dust traps are thought to play a critical role in the disk’s evolution and the early stages of planet formation. Dust traps may prevent solid material from migrating inward, starving the inner disk and impeding planet growth interior to the trap. These reservoirs may also serve as a chemical barrier, keeping volatile materials like water from moving to the inner regions of a disk.

While a perfect dust trap completely isolates material from the rest of the disk, recent observations and 2D simulations have shown that dust traps may be a bit more permeable — leaking smaller sized grains, mixing material, and changing the disk’s appearance. However, these results only account for two dimensions of the complex three-dimensional environment in which dust traps reside. Thus, 3D hydrodynamical simulations are necessary to provide more realistic details of dust dynamics within planet-hosting protoplanetary disks.

Z-axis averaged dust–gas density ratios (top) and dust–gas surface density ratios for the 3D simulations after 1,500 orbits. For the simulations with higher diffusion and lower planet mass, there is clear leaking of dust beyond the dust trap ring (edges marked with dotted red lines). Click to enlarge. Credit: Huang et al 2025


Dusty Simulations

In a recent study, Pinghui Huang (Chinese Academy of Sciences; University of Victoria) and collaborators performed multiple 2D and 3D numerical simulations of gas and dust within a protoplanetary disk with a forming planet. The simulations varied the mass of the planet and the level of turbulent diffusion — how well material and energy flow and mix within the gas. These variations allowed the authors to explore how dust traps behave within different types of systems.

The simulations showed that the embedded planet will perturb the gas and dust, producing density shocks that create gaps and, subsequently, pressure bumps where dust traps coalesce. From their analysis, the authors found that dust traps become leakier at higher levels of diffusion and when the embedded planet is lower in mass. Essentially, if the gas flows and mixes more efficiently, the perturbations of the planet are erased more quickly, and if the planet is sufficiently small, its ability to disrupt the disk is much weaker. Dust remains coupled to the gas, flowing through these weak traps without becoming stuck. Additionally, the 3D simulations show higher amounts of leakage compared to the 2D simulations, which the authors attributed to the asymmetric and complex vertical geometry of the disk.

Flux-trapping ratio (left) and mass-trapping ratio (right) as a function of time for the 2D (top) and 3D (bottom) simulations. The higher-mass planet in Model A causes more flux and mass-trapping than the lower-mass planets and more turbulent systems. Additionally, the 3D simulations show significantly lower flux and mass-trapping than the 2D simulations. Click to enlarge. Credit: Huang et al 2025

Implications and Comparison to Observations

What then are the consequences of leaky dust traps? In planet formation theory, dust traps determine the mass at which a planet creates a sufficient pressure bump that isolates small pebbles and dust exterior to its orbit. For perfect dust traps, this isolation of material from the planet and inner disk creates a clear chemical distinction between the inner and outer disk. However, as shown by the 3D simulations, dust traps are imperfect, allowing small particles to filter through; the authors suggest this may mean that the growing planet slows but does not stop the migration of solid materials in a disk.

Recent observations of protoplanetary disks reveal the presence of larger volatiles within the inner disk. Specifically, the disk PDS 70 shows water emission in its inner disk despite having two confirmed giant planets orbiting in the outer disk. Without leaky dust traps, volatiles like water would be trapped in the pressure bumps created by these planets. However, as the authors have shown, the complex reality of dust dynamics within protoplanetary disks allows heavier elements to leak through, enriching the inner disk. Further observations and detailed 3D simulations will allow astronomers to understand the extent of leaky dust traps and reveal the realistic conditions driving early planet formation.

By Lexi Gault

Citation

“Leaky Dust Traps in Planet-embedded Protoplanetary Disks,” Pinghui Huang et al 2025 ApJ 988 94.

doi:10.3847/1538-4357/addd1f


Wednesday, July 16, 2025

Low-Mass Brown Dwarfs in a Class of Their Own?


Featured Image: Low-Mass Brown Dwarfs in a Class of Their Own?
The glowing green nebula in this JWST image surrounds the star cluster IC 348, which is the subject of a recent study by Kevin Luhman (Penn State University) and Catarina Alves de Oliveira (European Space Agency). Using JWST’s Near-Infrared Camera, Luhman and Alves de Oliveira searched the cluster’s young stellar population for free-floating brown dwarfs — objects that are less massive than stars but more massive than most planets — and discovered multiple candidates with masses down to just twice the mass of Jupiter. Follow-up JWST spectroscopy confirmed the masses of these objects, making them the lowest-mass brown dwarfs known to date. In addition to their mass, these newly discovered brown dwarfs are remarkable because their spectra show evidence of hydrocarbon molecules, the exact identities of which are not yet known. Luhman and Alves de Oliveira proposed that low-mass brown dwarfs bearing this chemical signature be inducted into a new spectral class called “H” for “hydrocarbon.” To add to the intrigue of these objects, the authors also discovered signs of circumstellar disks around two of them, suggesting that they may be capable of forming and harboring planets. To learn more about the low-mass brown dwarfs in IC 348, be sure to check out the full research article linked below.

By Kerry Hensley

Citation

“A New Spectral Class of Brown Dwarfs at the Bottom of the IMF in IC 348,” K. L. Luhman and C. Alves de Oliveira 2025 ApJL 986 L14.

doi:10.3847/2041-8213/addc55


Thursday, July 10, 2025

Exo-Saturns and Exo-Jupiters Are Within JWST’s Reach

Illustration of Jupiter and a Jupiter-like exoplanet.
Credit:
NASA/JPL-Caltech

A JWST image of the exoplanet Epsilon Indi Ab, one of the coldest exoplanets to be directly imaged. The planet’s temperature is estimated to be just 275K (35℉/2℃). Credit:
NASA, ESA, CSA, STScI, Elisabeth Matthews (MPIA)

Of the nearly 6,000 currently known exoplanets, few closely resemble any of the planets in our solar system. New research suggests that JWST is capable of directly imaging exoplanets with temperatures and orbital distances similar to Jupiter and Saturn, placing truly familiar exoplanets within our observational grasp.

Increasingly Cold Discoveries

JWST has already proven itself to be a powerful tool to directly image exoplanet systems. The telescope has imaged increasingly cold planets, but the gas giants in our solar system are substantially colder than the coldest planet imaged by JWST so far. This raises the question of whether JWST is capable of directly imaging Jupiter and Saturn if they orbited another star.

Answering this question requires a deep dive into the abilities of JWST’s instruments. The current go-to method for directly imaging planets with JWST is coronagraphy with its Near-Infrared Camera (NIRCam). In this observing mode, the instrument blocks the light from the star, allowing the fainter thermal glow of the planet to shine through.

But as Rachel Bowens-Rubin (University of Michigan and Eureka Scientific) and collaborators note in a recent research article, this may not be the best way to detect cold giant planets. Models suggest that these planets have cloudy atmospheres, which means that they wouldn’t be bright at NIRCam’s preferred near-infrared wavelengths, and would instead be detected more easily in the mid-infrared, where JWST’s Mid-Infrared Instrument (MIRI) reigns.

Temperatures of coldest detectable planets as a function of separation from the host star for Wolf 350 and EV Lac. Results are shown for MIRI F2100W imaging and NIRCam F444W coronagraphy. Credit: Bowens-Rubin et al. 2025

Combining Data and Models

To examine the capabilities of both of these instruments, Bowens-Rubin’s team analyzed JWST observations from the Cool Kids on the Block program, which targets cold, low-mass giant planets around nearby low-mass stars with NIRCam coronagraphy and MIRI imaging. The team used observations of nearby M-dwarf stars Wolf 359 and EV Lac to construct constrast curves: the level of planet–star flux contrast that is detectable by each instrument as a function of distance from each star. These curves depend on the flux of the star and the planet as well as the limitations of the instrument — the detector noise and background noise.

Bowens-Rubin and coauthors converted the contrast curves into information about the coldest planet each instrument can detect. To do this, the team modeled the atmospheres of planets with temperatures down to 50K and generated thermal emission spectra, which allowed them to relate the temperature of their modeled planets to the level of contrast.

Temperatures of planets detectable to a signal-to-noise ratio of 3 as a function of distance from Earth. Detection limits for MIRI and NIRCam are shown as red and blue lines, respectively. Credit: Bowens-Rubin et al. 2025


NIRCam vs. MIRI

This analysis showed that MIRI is the best choice for directly imaging cold planets around nearby stars (within 65 light-years). MIRI should be able to detect giant planets with temperatures down to 94K around Wolf 359 and 114K around EV Lac — about the temperature of Saturn and slightly colder than Jupiter, respectively. For Wolf 359, sub-100K planets are detectable at orbital distances of at least 4.8 au, meaning these planets could also have similar orbital separations to Jupiter and Saturn.

NIRCam coronagraphy can match MIRI’s performance only for the unlikely case of cloud-free giant planets; for cloudy planets around nearby stars, MIRI can spot planets 90–130K colder than NIRCam can. NIRCam has the advantage for more distant stars — beyond about 200 light-years — but only planets significantly warmer than Jupiter and Saturn are detectable at these distances.

As impressive as these results are already, Bowens-Rubin and coauthors noted that future work, such as developing strategies to mitigate MIRI’s “brighter-fatter effect” that limits sensitivity at small angular separations from the host star, could enhance the search for exo-Saturns and exo-Jupiters even further.

Citation

J“NIRCam Yells at Cloud: JWST MIRI Imaging Can Directly Detect Exoplanets of the Same Temperature, Mass, Age, and Orbital Separation as Saturn and Jupiter,” Rachel Bowens-Rubin et al 2025 ApJL 986 L26. doi:10.3847/2041-8213/addbde


Sunday, July 06, 2025

Citizen Science Born in the Pandemic: The Hubble Image Similarity Project

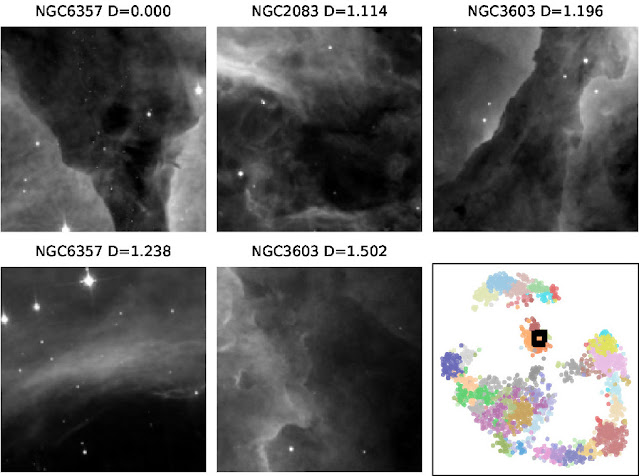
A handful of images used in the Hubble Image Similarity Project
Adapted from White & Peek 2025

Motivated by a desire to support community members financially during the coronavirus pandemic, researchers employed 30 local citizen scientists in the Hubble Image Similarity Project. This project quantified the similarities between astronomical images, providing a way to test the results of image-search algorithms.

The Eagle Nebula, pictured here in an image from Kitt Peak National Observatory, is a star-forming region in the Milky Way. Credit:
  T.A.Rector (NRAO/AUI/NSF and NOIRLab/NSF/AURA) and B.A.Wolpa Credit: NOIRLab/NSF/AURA); CC BY 4.0

Seeking Similarities

Say you have an image of a star-forming region, featuring eye-catching gas clouds, dense and dusty knots, and newborn stars. How would you go about finding other images that resemble yours?

You might start your search with an astronomical image database, using filters for object type or instrument to sift through thousands and thousands of options. But even filtering out everything but star-forming regions might yield vastly different results, given the widely varying shapes, colors, and sizes of these regions.

Or maybe you’ll feed your image into a neural network that has been trained to spot similar images. The results may seem promising, but how can you tell whether the algorithm has found the images that are the most similar? Would another algorithm do better?

An example of individual test images (green squares) extracted from a Hubble Legacy Archive image (red square). Low-contrast areas have been excluded, leaving the galaxy’s spiral arms for analysis. Credit: White & Peek 2025

The Hubble Image Similarity Project

Astronomical image collections rarely contain information about similarities between images in their metadata, and while neural networks appear to excel at gathering similar images, the results of these models are generally unverified. The Hubble Image Similarity Project, led by Richard White (Space Telescope Science Institute) and Josh Peek (Space Telescope Science Institute and Johns Hopkins University), addressed these issues with a team of citizen scientists who generated similarity information for astronomical images, providing a quantitative means to test the results of neural networks.

White and Peek began by amassing a sample of images from the Hubble Legacy Archive. This sample included many different object types, such as galaxies, planetary nebulae, star-forming regions, and star clusters. After trimming and binning the images, converting them to 8-bit grayscale, filtering out low-contrast images, and eliminating satellite trails, image artifacts, and repeated observations of the same patch of sky, 2,098 images of 666 objects remained.

Examples of similar images according to the image similarity matrix. In the lower-right corner is a visualization of the similarity data. The semicircle of data points in the bottom half of this visualization represents galaxies, while star clusters occupy the small arc near the top and nebulae sit in the island in the center of the plot. Credit: Adapted from White & Peek 2025

Citizen Scientists, Assemble

White and Peek recruited 30 members of the community within walking distance of the Space Telescope Science Institute to identify similar astronomical images, and the reviewers were paid for their work. In the three phases of the project, reviewers considered test images one at a time and 1) selected all similar images from a set of 15 comparison images, 2) selected the most similar image from a narrowed-down set of 6 comparison images, and finally 3) selected the most similar image from a set of 3 comparison images.

The citizen science team ultimately compared 5.4 million pairs of images, and White and Peek used these comparisons to produce an image similarity matrix. The matrix describes the metaphorical “distance” between the images, with the most similar images being the smallest distance apart.

Similar images resemble one another in terms of structure, texture, and other factors that White and Peek say are “difficult even to describe in words” — for example, the diffuse glow of a galaxy interrupted by a bright star with diffraction spikes, or a nebula speckled with stars and dense dusty clumps. The similarity data from this study are available online and can be used to test the performance of image-search algorithms. In future work, the authors plan to carry out a similar project using images of the Martian landscape.

By
Kerry Hensley

Citation

“The Hubble Image Similarity Project,” Richard L. White and J. E. G. Peek 2025 AJ 169 306.
doi:10.3847/1538-3881/adcb43


Saturday, June 28, 2025

Duel of the Dual: The Mystery of a Quasar Pair

Hubble Space Telescope image of the binary quasar pair J0749+2255
Credit:
NASA, ESA, Yu-Ching Chen (UIUC), Hsiang-Chih Hwang (IAS), Nadia Zakamska (JHU), Yue Shen (UIUC)

Figure 1: A map of the flux detected around the Hɑ and [NII] lines in the J0749+2255 system.
The two quasars are found in the central region, denoted with “NE” and “SW.” 
Credit: Adapted from Ishikawa et al. 2025

Authors: Yuzo Ishikawa et al.
First Author’s Institution: Johns Hopkins University and MIT Kavli Institute for Astrophysics and Space Research
Status: Published in ApJ

Binary supermassive black holes are an interesting phenomenon, with implications for galaxy evolution and gravitational wave observations. It is thought that these supermassive black hole pairs most often arise from galaxy mergers, during which gas accretion can spark active galactic nucleus activity. Today’s article analyzes JWST observations of one particular pair of quasars (a type of active galactic nucleus) with the lovely poetic name of J0749+2255. As shown in Figure 1, these quasars (observed at a redshift of z = 2.17) are quite close together, separated by only 12,300 light-years. They find that the southwest quasar is about three times brighter than its partner in the northeast, but the real interesting stuff is found in the spectral analysis.

Figure 2: Spectral observations of the two quasars, vertically offset for clarity. The blue and red curves represent JWST observations, with the gray lines representing observations from previous works with other telescopes. The JWST results shown here demonstrate the remarkable similarity between the two quasars. Adapted from Ishikawa et al. 2025

Seeing Double?

Figure 2 shows the spectra for the SW and NE quasars, and the first thing that is impossible to ignore is just how similar they are. There are some small differences; for example, the NE quasar is slightly redder than the SW quasar, and some emission lines have different shapes and are a smidge offset from one another. But the general similarity brings up the possibility that what we’re looking at isn’t two separate quasars, but rather one object that’s being gravitationally lensed! The small differences in the spectra could be consistent with a lensing scenario, as they could be explained by time delays in the lensing or foreground contamination. A major problem with this idea, however, is that no observations of this system have provided evidence for a lens: we have not seen the massive foreground object that would actually be causing the gravitational lensing. While it’s possible that the lens is just incredibly faint, there’s no smoking gun for lensing happening here.

Figure 3: Maps of Hɑ emission with the quasar contributions removed. Left panel shows the flux, middle shows the velocity dispersion, and right the radial velocity. The radial velocity measurements provide strong evidence for a disk with gas rotation and relatively little disturbance, which is not usually the case for merger environments. Credit: Ishikawa et al. 2025

Disk Gas Enters the Chat

The story becomes even more complicated when you look beyond the quasars, as JWST observations also detected diffuse emission from gas as shown in Figure 3. This gas is at the same redshift as the quasars, and can thus be associated with their host galaxy. And crucially, this gas doesn’t show any signs of lensing, such as the distinct arcs or symmetry you find in other lensed systems. This, coupled with the differences in the quasar spectra, suggests that this is not a lensed system, and that in fact we are looking at two different quasars.

But even within this model there are mysteries afoot! It’s generally thought that dual quasar systems are found in galaxy mergers, and there is some evidence that we’re seeing that here. The region labeled T1 in Figure 1 is one such piece of evidence, thought to be a tidal tail formed by gravitational disruptions during a merger event. It’s also generally thought that mergers provide a key way to trigger active galactic nucleus activity, where the two supermassive black holes of the merging galaxies become fed by the same gas reservoir. This could explain why the two quasars in J0749+2255 are so similar, as they may have undergone very similar accretion histories.

However, this story is complicated by the dynamics within the gas surrounding the quasars. As shown in the rightmost panel of Figure 3, the quasars are embedded in a gas disk that’s rotating, with one half of the gas being redshifted and the other half blue shifted. The quasars aren’t separated into these two regions, but are rather both found at the center of the disk. And the gas is showing none of the kinematic disturbance we would expect during a major merger, as the disk seems to be relatively stable. So maybe we’re not witnessing a merger in progress, but rather a disk galaxy that is playing host to two quasars! Based on simulations, one way this could happen is if a major merger takes place at an earlier time, and two black holes form from the resulting instabilities. This is another possible explanation for why the quasars are so similar.

Overall, this work points to the complicated nature of dual quasar systems. Is this one quasar being lensed or two different quasars? If they are distinct objects, are we witnessing a merger of galaxies, or did they both form in one galaxy? Future observations may be the key to answering these questions, but for now it remains a very interesting system.

Original astrobite edited by Hillary Andales


About the author, Skylar Grayson:

Skylar Grayson is an astrophysics PhD candidate and NSF Graduate Research Fellow at Arizona State University. Her primary research focuses on active galactic nucleus feedback processes in cosmological simulations. She also works in astronomy education research, studying online learners in both undergraduate and free-choice environments. In her free time, Skylar keeps herself busy doing science communication on social media, playing drums and guitar, and crocheting!


Editor’s Note: Astrobites is a graduate-student-run organization that digests astrophysical literature for undergraduate students. As part of the partnership between the AAS and astrobites, we occasionally repost astrobites content here at AAS Nova. We hope you enjoy this post from astrobites; the original can be viewed at astrobites.org.


Friday, June 20, 2025

Seeding Life in the Oceans of Moons

Plumes of salty water ice emerge from Enceladus's cracked ice shell
Credit:
NASA/JPL/Space Science Institute

Authors: Shannon M. MacKenzie et al.
First Author’s Institution: Johns Hopkins University Applied Physics Laboratory
Status: Published in PSJ

A steroids and meteorites are usually associated with doom and destruction (rest easy, dinosaurs), but they may have also been essential for the emergence of life on Earth. It is popularly theorized that some of the base building blocks of life, like volatiles and organics, were delivered here by meteorites and that the energy of these impacts synthesized even more, like HCN and amino acids. Expectedly, the same should be true for other planets. Today’s article explores this possibility using nearby analogies for potentially habitable exoplanets: our solar system’s ocean worlds.

Why Do Meteorites Carry Organics?

The solar system formed from one massive cloud of gas and dust, so the composition everywhere is approximately the same. However, early Earth was an extremely hot ball of magma that destroyed its organic matter. Luckily, organics were able to survive in objects like meteorites in the cold outskirts of the solar system.

Figure 1: Saturn’s moon Enceladus with a liquid water ocean beneath the icy crust. Jets on the surface are strong indicators of hydrothermal vents on the ocean floor.Credit:
JPL

Today’s authors studied typical impact events on Jupiter’s moon Europa and Saturn’s moons Enceladus and Titan to determine 1) if organics could survive the impacts, and 2) what processes could occur in the resulting melted material in the impact craters before it refreezes.

Ocean Worlds in Our Neighborhood

In the search for extraterrestrial life, we start by looking for the basic necessities — and water is a big one. Though Earth is the only planet in our solar system with liquid water, several moons of Jupiter and Saturn have it as well. These moons are beyond the balmy habitable zone, so their surfaces are covered in icy crusts, but beneath those crusts are subsurface oceans of liquid water, making these moons “ocean worlds” (see Figure 1). On their own, the presence of water makes these moons astrobiologically interesting, and they will also elucidate ocean worlds that are further away.

Today’s authors studied typical impact events on Jupiter’s moon Europa and Saturn’s moons Enceladus and Titan to determine 1) if organics could survive the impacts, and 2) what processes could occur in the resulting melted material in the impact craters before it refreezes.

Figure 2: The modeled impact velocities and maximum pressures for icy (black) and rocky (gray) impactors. Survivable pressures of various organics (green and gray colored bars on the y-axis) are within the range of observed velocities and pressures from craters on each ocean world moon (colored boxes). Credit: MacKenzie et al. 2024

Surviving the Impact

To evaluate survivability, the authors modeled the maximum pressure of an impact on an ocean world’s ice crust for a range of impact velocities and angles. Around Jupiter and Saturn, most impactors are either icy or rocky objects that originate from the Kuiper Belt or Oort cloud, so the authors modeled both types of impactors. Rocky impactors create higher pressures (shown in gray in Figure 2) than icy impactors (shown in black in Figure 2). From the sizes of observed craters on the ocean world moons, previous works determined the velocities and pressures of impacts, which are shown by the colored boxes in Figure 2. Finally, a number of other works have estimated the ranges of survivable pressures for biota and biologically important molecules, which are shown by the green and black bars on the right of Figure 2. Impressively, the survivable pressure ranges are within the observed and modeled pressures of impacts! So these life building blocks can be, and likely have been, deposited on the ocean world moons.

Crater Melt Pools

When an impactor hits the icy crust, some of the ice will melt. The deposited organics will end up in a pool of liquid water in the crater, which is an ample environment for prebiotic chemistry until the pool freezes. From the observed crater sizes and modeled velocities, the authors estimated how much liquid water could remain in a crater and how long it would take to freeze. Freeze times ranged from a few Earth years for the smallest craters (<4 a="" acids="" amino="" as="" been="" br="" conditions="" crater="" craters="" diameter="" earth="" few="" for="" have="" hundreds="" in="" is="" kilometers="" labs="" largest="" melt="" mimicking="" months="" of="" on="" pools.="" possible="" short="" so="" synthesis="" synthesized="" the="" thousands="" to="" years="">
The pools eventually freeze, trapping any deposited or synthesized material on the icy surface. Other processes, like future impacts, are required to break through the icy crust and transport material to the subsurface oceans where theorized hydrothermal vents could allow more complex development.

Tangible Evidence

In summary, survivable impacts on the ocean world moons are common, and each provides an opportunity for prebiotic chemistry to arise. Unlike most objects astronomers study, the proximity of these ocean worlds means that we can thoroughly understand them through physical samples. NASA’s Cassini detected organic compounds in the plumes that burst off the surface of Enceladus, and the Dragonfly mission is set to head for Titan in 2028 to collect and analyze samples once it arrives in 2034. In the coming decades, we may witness the discovery of more precursors to life or microbial life itself in the subsurface oceans of moons in our solar system, and gain radical insight into the ocean worlds beyond.

Original astrobite edited by Sonja Panjkov


About the author, Annelia Anderson:

I’m an Astrophysics PhD candidate at the University of Alabama, using simulations to study the circumgalactic medium. Beyond research, I’m interested in historical astronomy, and hope to someday write astronomy children’s books. Beyond astronomy, I enjoy making music, cooking, and my cat.


Editor’s Note: Astrobites is a graduate-student-run organization that digests astrophysical literature for undergraduate students. As part of the partnership between the AAS and astrobites, we occasionally repost astrobites content here at AAS Nova. We hope you enjoy this post from astrobites; the original can be viewed at astrobites.org.


Wednesday, June 18, 2025

Following Photons Through Curved Spacetimes


Today’s featured image is a beautiful representation of how simulated images of active black holes are made. In a recent research article, a team led by Aniket Sharma (Indian Institute of Science Education and Research Mohali) introduced Mahakala, a new ray-tracing algorithm that expertly tracks photons as they navigate the warped spacetimes surrounding black holes. Mahakala is named for the Egyptian deity who, as Sharma and collaborators describe, is “believed to be the depiction of absolute black, and the one who has the power to dissolve time and space into himself.” The image above shows a simulated accreting black hole at a wavelength of 1.3 millimeters, which is the same wavelength used by the Event Horizon Telescope to view the supermassive black holes at the center of the Milky Way and the galaxy Messier 87. The dotted lines streaming off to the right represent the paths that photons took on their way to the viewer as they curved around the black hole, which is visible among the forest of lines. In this representation, the color of each dot shows the synchrotron emission generated at that point in three-dimensional space. The team hopes that Mahakala, which can be run quickly and easily from a Python Jupyter notebook, helps make the complex world of general relativistic magnetohydrodynamics simulations more accessible. You can try it for yourself or learn more from the article linked below.

By Kerry Hensley

Citation

“Mahakala: A Python-Based Modular Ray-Tracing and Radiative Transfer Algorithm for Curved Spacetimes,” Aniket Sharma et al 2025 ApJ 985 40. doi:10.3847/1538-4357/adc104


Saturday, June 07, 2025

JWST Examines the Ring Nebula


The iconic and widely photographed Ring Nebula is one of the most recognizable planetary nebulae: short-lived, often brilliantly colored nebulae that form when low- to intermediate-mass stars shed their outer layers. The three images above show the central region of the Ring Nebula through the eyes of JWST’s Mid Infrared Instrument. The leftmost image clearly shows the Ring Nebula’s central star: a hot, crystallized stellar core called a white dwarf. In a recent research article, Raghvendra Sahai (Jet Propulsion Laboratory) and collaborators analyzed these JWST observations, leading to the discovery of a dusty disk around the Ring Nebula’s central star. This is just the second time that a resolved disk has been discovered around the central star of a planetary nebula. Disks with radii from 0.01 to 1,000 au have been found around evolved stars in the asymptotic giant branch phase through the planetary nebula phase, but it’s not yet clear how these disks form and how long they last. Most intriguingly, the presence of disks around highly evolved stars raises the possibility of a second phase of planet formation. To learn more about the JWST observations of the Ring Nebula, and what they tell us about the properties of the central star and its disk, be sure to check out the full research article linked below.<;div>

By Kerry Hensley

Citation

“JWST Observations of the Ring Nebula (NGC 6720). III. A Dusty Disk Around Its Central Star,” Raghvendra Sahai et al 2025 ApJ 985 101. doi:10.3847/1538-4357/adc91c


Friday, May 16, 2025

Did That Supermassive Black Hole Rip Apart a Star, or Is It Eating Lunch Like Normal?

Artist's impression of a tidal disruption event — the ripping apart of a star by a black hole
Credit:
NASA/JPL-Caltech

Title: An Untargeted Search for Radio-Emitting Tidal Disruption Events in the VAST Pilot Survey
Authors: Hannah Dykaar et al.
First Author’s Institution: University of Toronto
Status: Published in ApJ

supermassive black holes in the centers of most galaxies are notoriously, and predictably, violent actors in the universe. While some, classified as active galactic nuclei, act like a drain on their host galaxies, swallowing anything and everything that falls into them, even dormant black holes will react destructively when provoked. Orbit too closely, and any galactic nucleus will break you apart like a first-year chemistry student bumping an unsuspecting beaker off the lab bench.

If an ill-fated star falls into a black hole, the system will briefly glow across the electromagnetic spectrum. When and where these mishaps, known as tidal disruption events (TDEs, shown in Figure 1), occur, as well as the exact physical processes causing the brief glow, are not well understood. TDEs have been detected overwhelmingly in galaxies that do not have active galactic nuclei and are calming down after an era of intense star formation, and current models of the TDE occurrence rate disagree with observations. We expect to see more types of galaxies, such as those with active galactic nuclei, that host TDEs at similar rates, but we don’t — however, we might just be looking in the wrong places, or rather, with the wrong set of eyes.

Figure 1: An artist’s impression of a tidal disruption event observed with X-ray and optical telescopes. Credit: X-ray: NASA/CXC/Queen’s Univ. Belfast/M. Nicholl et al.; Optical/IR: PanSTARRS, NSF/Legacy Survey/SDSS; Illustration: Soheb Mandhai / The Astro Phoenix; Image Processing: NASA/CXC/SAO/N. Wolk

Traditionally, TDEs have been identified by their optical, ultraviolet, or X-ray emission, but active galactic nuclei are surrounded by dust, which absorbs light at these wavelengths on its way to us. However, at radio wavelengths, the issue of dust obscuration fades, allowing us to uncover the TDEs that may be hiding. While radio emission has been observed from known TDEs, identifying TDEs in the radio comes with a major hurdle, presented by the pesky active galactic nuclei themselves; they are famously variable in radio emission, and they can serve as pretty convincing TDE imposters.

Searching for TDEs at Radio Wavelengths

Today’s authors decide to take on this challenge, armed with data from the Variable and Slow Transients (VAST) pilot survey, which observes large swaths of the sky at regular intervals to track variability on the order of days to months. VAST is optimized for observing TDEs, but unfortunately, it is also excellent at finding active galactic nuclei. How do we know what to look for, and how can we distinguish a TDE from an active galactic nucleus? Easy, we can just identify characteristics common to all the known radio-emitting TDEs in the VAST field of view — all one of them, that is. Surely, that won’t do. Instead, our authors simulate the evolution of TDEs as seen by VAST, which can only catch discrete snapshots of light at a specific radio wavelength. Their models of TDE radio emission assume one of three cases: either the TDE produces a relativistic jet directed at us (on-axis), directed away from us (off-axis), or none at all. The presence or absence of a jet, and its direction, determine the shape of the light curve, as shown in Figure 2.

Figure 2: This figure shows the change in radio brightness over time we expect to see from a galaxy during a TDE given different models. The shape of the radio flare depends strongly on whether the TDE results in a relativistic jet, and if so, whether the jet points toward us (on-axis) or not (off-axis). These simulated light curves were used to establish criteria for TDE candidacy, and compared with observations from the final sample to constrain the incidence rate of TDEs and likelihood of different jet geometries. Credit: Dykaar et al. 2024

From these simulations, the authors identify three overarching characteristics that wannabe TDEs must exhibit: first, they must be variable, signaling the flare of activity as the star crashes into the black hole; second, the flare should be sufficiently bright compared to the galaxy’s normal brightness; and third, the flare must last for more than one observation, to ensure it is not a spurious detection. Additionally, the authors find that the peak brightness of the TDE must be double the typical galaxy brightness to effectively rule out active galactic nucleus imposters, which do not tend to vary this drastically, as shown in Figure 3. Lastly, the TDE must actually occur near the center of a galaxy (the black hole locale), as confirmed by optical or infrared survey catalogs. In the VAST pilot survey, 12 sources meet these criteria.

Figure 3: To distinguish TDEs from active galactic nucleus imposters, the authors kept only sources that exhibited one dominant peak in their radio flux, shown by the blue windows. Sources with secondary peaks (shown by the purple windows) that were much smaller than the primary peak were allowed, as the secondary peak could reasonably be due to ambient active galactic nucleus activity. However, multiple comparable peaks are indicative of only intrinsic active galactic nucleus fluctuations, not a TDE. Credit: Dykaar et al. 2024

Following Up on TDE Candidates at Other Wavelengths

The authors next subject these TDE candidates to thorough multi-wavelength scrutiny using archival survey data. First, they investigated whether the candidates are associated with gamma-ray bursts, which are extremely luminous and energetic events that may accompany TDEs. Unfortunately, gamma rays are easily absorbed, making them notoriously difficult to trace back to their sources. (After all, the journey of a gamma ray through light-years of dust and gas to Earth is not unlike Odysseus’s return to Ithaca, and we all know how many made that journey unscathed.)

The authors found that all 12 sources were coincident with a gamma-ray burst, but all 12 sources were also coincident with multiple gamma-ray bursts (which is unlikely to be physical), as were randomized, TDE-free regions of the VAST sky. In other words, the gamma-ray burst association is inconclusive. Contemporary optical and infrared observations of the candidates revealed no corresponding flares, which leads to more questions. Are the sources simply too far away for their optical and infrared flares to be discernible, or could dust absorption be at play? Additionally, nearly all candidates maintained an increased radio flux after the TDE flare. This may indicate that the TDE occurred within an active galactic nucleus as it was transitioning to a higher radio flux state, that the TDE was followed by intense star formation, or both.

By comparing their candidates to the expected observational manifestations of their TDE models, the authors conclude that the candidate sources are consistent with TDEs that have relativistic jets. They also independently constrain the TDE incidence rate, which agrees with current theory. As our window into the variable radio universe expands with future observations, such as with the ongoing VAST survey, we will have a growing population of such radio-detected TDEs to study, and the ability to distinguish them from regular active galactic nuclei will be ever more valuable in our quest to understand them.


Editor’s Note: Astrobites is a graduate-student-run organization that digests astrophysical literature for undergraduate students. As part of the partnership between the AAS and astrobites, we occasionally repost astrobites content here at AAS Nova. We hope you enjoy this post from astrobites; the original can be viewed at astrobites.org.


About the author, Chloe Klare:


I’m a PhD student in Astronomy and Astrophysics at Penn State, with a physics doctoral minor. In my research, I’m looking for newly evolving synchrotron jets in active galactic nuclei (in the radio!).