Monday, August 31, 2009

Is The Milky Way Doomed to Be Destroyed by Galactic Bombardment? Probably Not, Study Says.

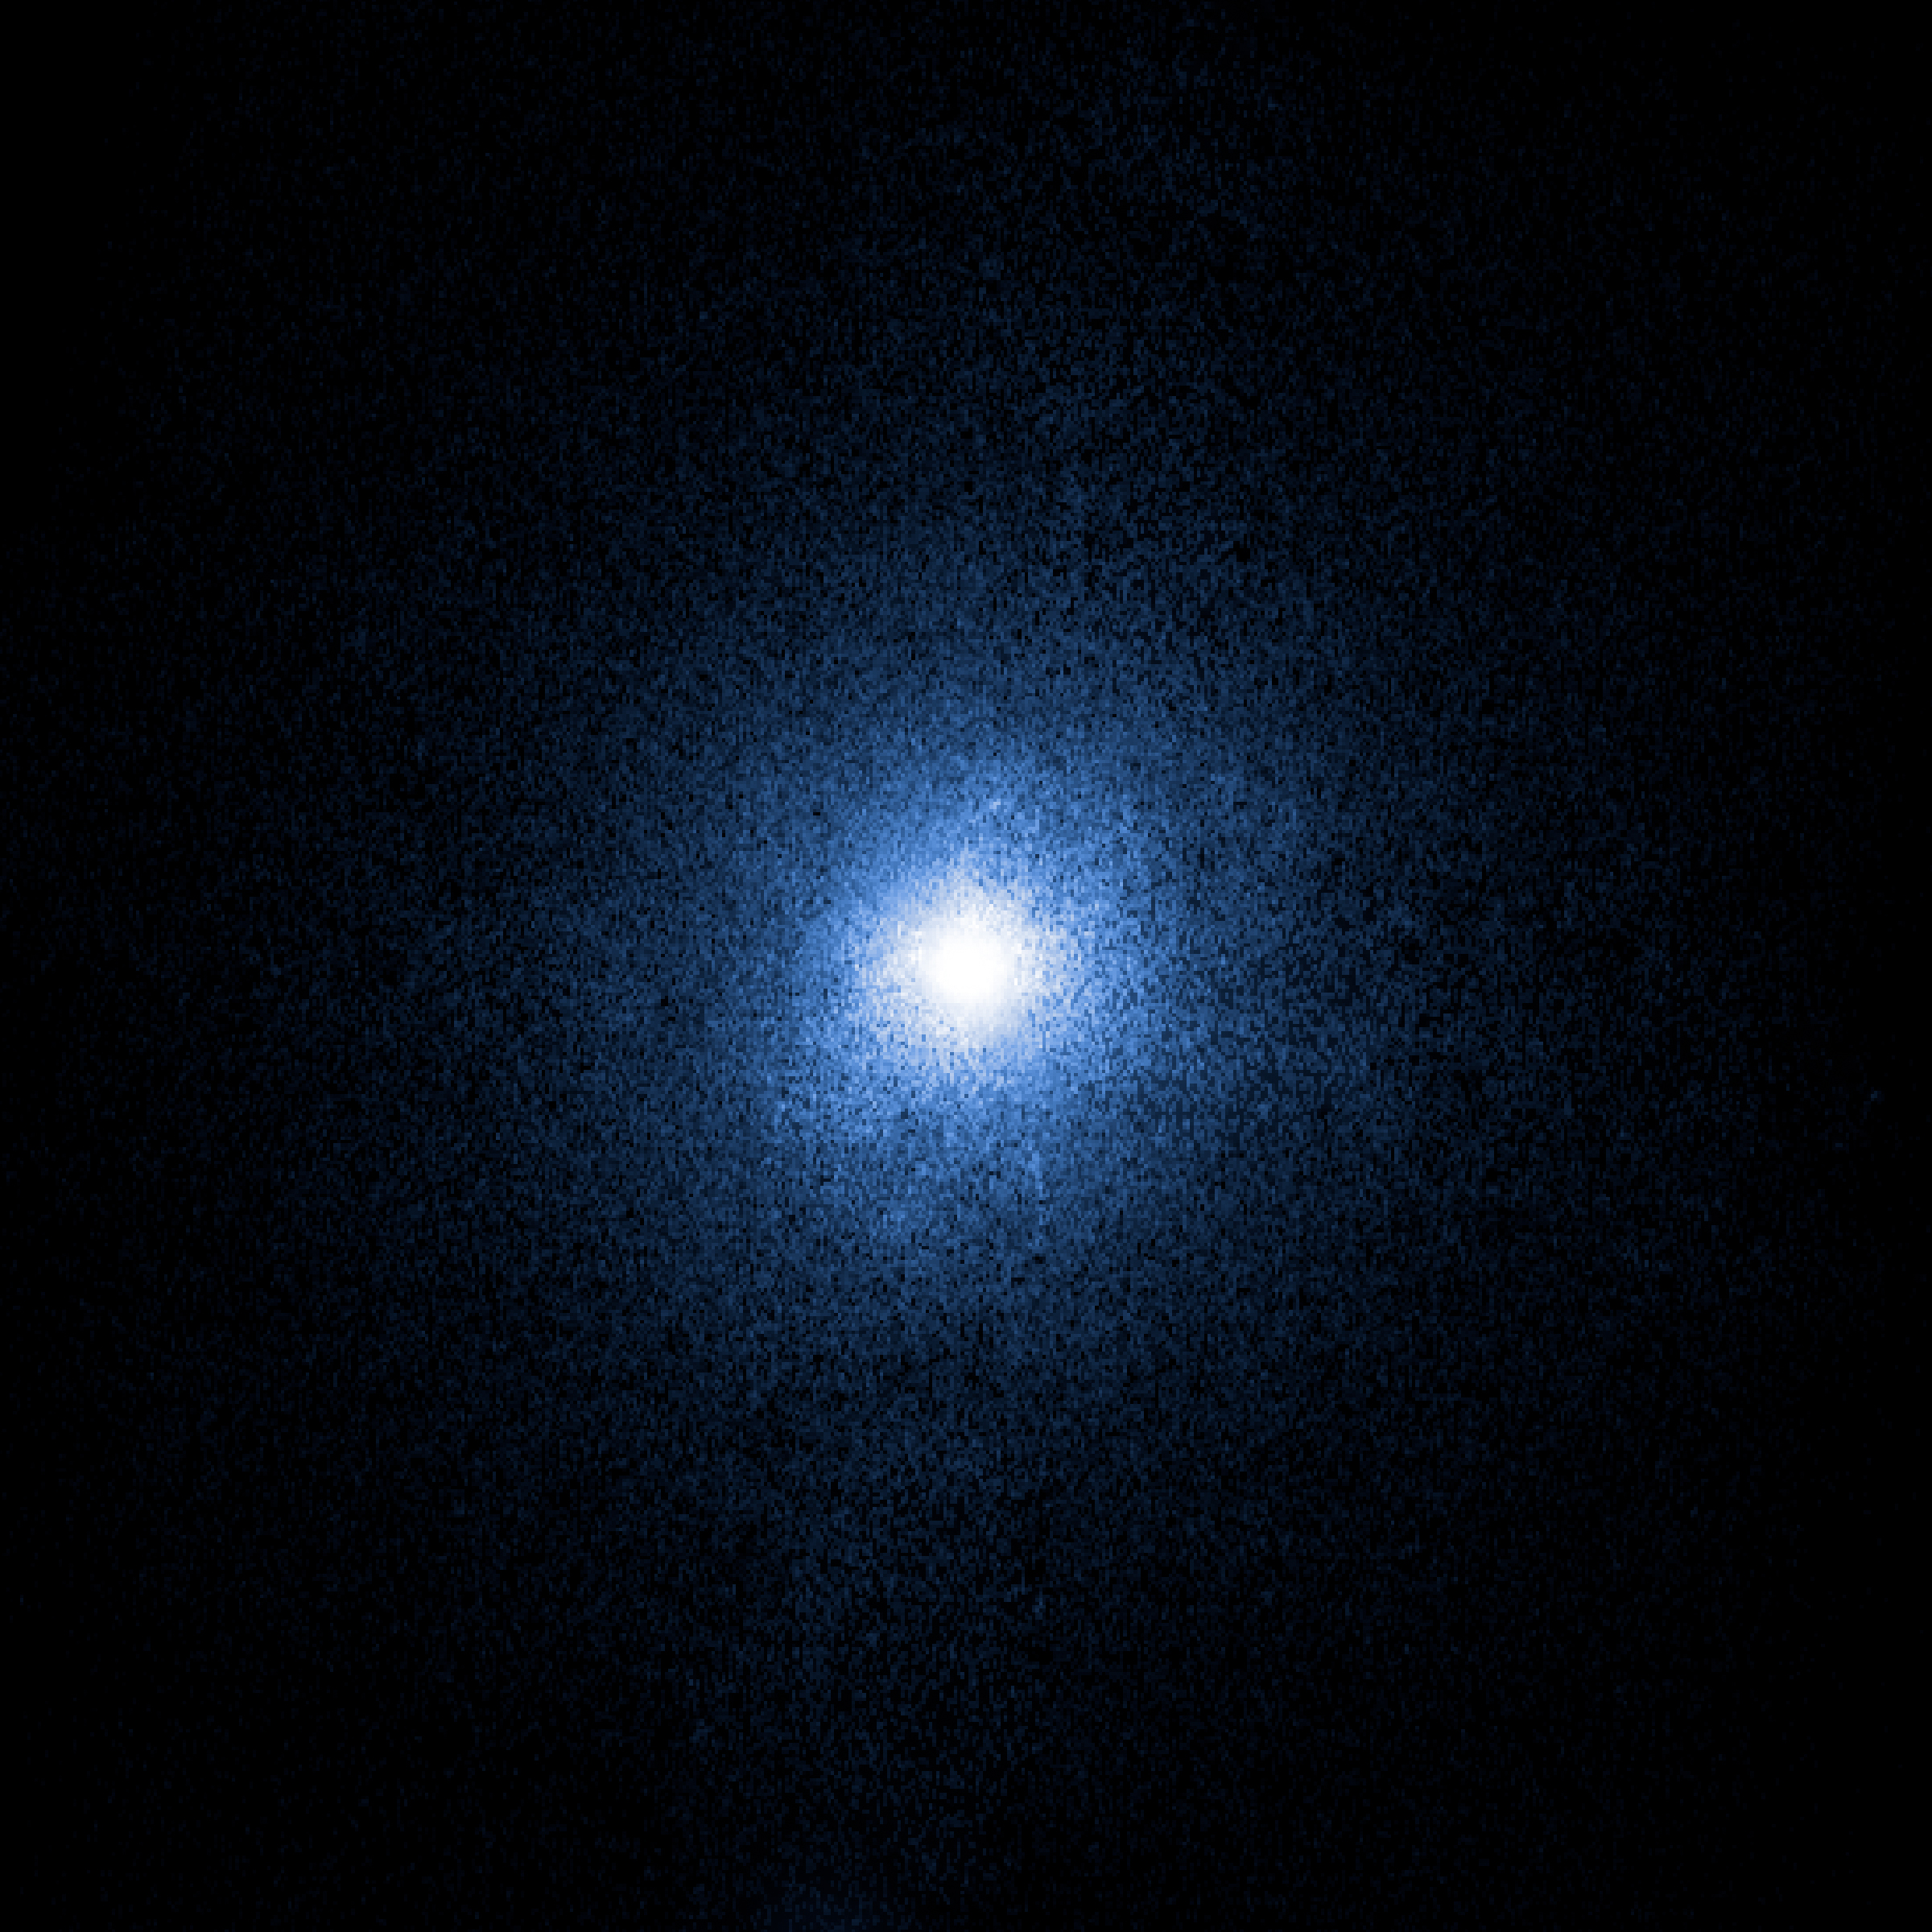
This image from a supercomputer simulation shows the density of dark matter in our Milky Way galaxy which is known to contain an ancient thin disk of stars. Brightness (blue-to-violet-to-red-to-yellow) corresponds to increasing concentration of dark matter. The bright central region corresponds roughly to the Milky Way's luminous matter of gas and stars and the bright clumps indicate dark-matter satellites orbiting our Milky Way galaxy which are known as "substructure". The simulation predicts that the dark-matter halos of spiral galaxies are lumpy, filled with hundreds of dark matter substructures that pass through the stellar disks of galaxies, leaving their imprint and disturbing them in the process. Image courtesy of Stelios Kazantzidis, Ohio State University.

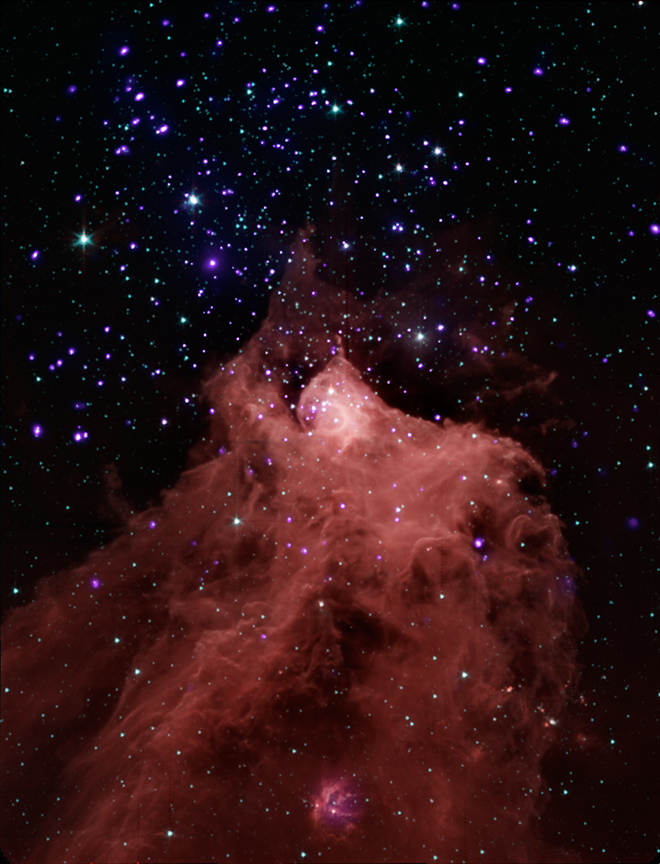
Density maps of disk stars illustrating the global morphological transformation of a galactic disk subject to bombardment by dark matter substructures. Brighter colors indicate regions of higher density of disk stars. The left panel shows the initial disk, while the right panel depicts the final disk after the violent gravitational encounters with the orbiting substructures. The edge-on (upper panels) and face-on (bottom panels) views of the disk are displayed in each frame. Satellite-disk interactions of the kind expected in the currently favored cosmological model produce several distinctive signatures in galactic disks including: long-lived, low-density, ring-like features in the outskirts; conspicuous flares; bars; and faint filamentary structures above the disk plane that resemble tidal streams. These morphological features are similar to those being discovered in the Milky Way, the Andromeda galaxy, and in other spiral galaxies. Image courtesy of Stelios Kazantzidis, Ohio State University.

COLUMBUS, Ohio -- As scientists attempt to learn more about how galaxies evolve, an open question has been whether collisions with our dwarf galactic neighbors will one day tear apart the disk of the Milky Way.

That grisly fate is unlikely, a new study now suggests.

While astronomers know that such collisions have probably occurred in the past, the new computer simulations show that instead of destroying a galaxy, these collisions “puff up” a galactic disk, particularly around the edges, and produce structures called stellar rings.

The finding solves two mysteries: the likely fate of the Milky Way at the hands of its satellite galaxies -- the most massive of which are the Large and Small Magellanic Clouds -- and the origin of its puffy edges, which astronomers have seen elsewhere in the universe and dubbed “flares.”

The mysterious dark matter that makes up most of the universe plays a role, the study found.

Astronomers believe that all galaxies are embedded within massive and extended halos of dark matter, and that most large galaxies lie at the intersections of filaments of dark matter, which form a kind of gigantic web in our universe. Smaller satellite galaxies flow along strands of the web, and get pulled into orbit around large galaxies such as our Milky Way.

Stelios Kazantzidis

Ohio State University astronomer Stelios Kazantzidis and his colleagues performed detailed computer simulations of galaxy formation to determine what would happen if a satellite galaxy -- such as the Large Magellanic Cloud and its associated dark matter -- collided with a spiral galaxy such as our own.

Their conclusion: The satellite galaxy would gradually disintegrate, while its gravity tugged at the larger galaxy’s edge, drawing out stars and other material. The result would be a flared galactic disk such as that of the Milky Way, which starts out narrow at the center and then widens toward the edges.

The results may ease the mind of anyone who feared that our galactic neighbors and their associated dark matter would eventually destroy our galactic disk -- albeit billions of years from now.

Kazantzidis couldn’t offer a 100-percent guarantee, however.

“We can’t know for sure what’s going to happen to the Milky Way, but we can say that our findings apply to a broad class of galaxies similar to our own,” Kazantzidis said. “Our simulations showed that the satellite galaxy impacts don't destroy spiral galaxies -- they actually drive their evolution, by producing this flared shape and creating stellar rings -- spectacular rings of stars that we’ve seen in many spiral galaxies in the universe.”

He and his colleagues didn’t set out solely to determine the fate of our galaxy. In two papers that have appeared in the Astrophysical Journal, they report that their simulations offer a new way to test -- and validate -- the current cosmological model of the universe.

According to the model, the universe has contained a certain amount of normal matter and a much larger amount of dark matter, starting with the Big Bang. The exact nature of dark matter is unknown, and scientists are hunting for clues by studying the interplay between dark matter and normal matter.

This is the first time that collisions between spiral galaxies and satellites have been simulated at this level of detail, Kazantzidis said, and the study revealed that galaxies’ flared edges and stellar rings are visible signs of these interactions.

Our galaxy measures 100,000 light-years across (one light year equals six trillion miles). Yet we are surrounded by a cloud or “halo” of dark matter that’s 10 times bigger -- 1 million light-years across, he explained.

While astronomers envision the dark matter halo as partly diffuse, it contains dense regions that orbit our galaxy in association with satellite galaxies, such as the Magellanic Clouds.

“We know from cosmological simulations of galaxy formation that these smaller galaxies probably interact with galactic disks very frequently throughout cosmic history. Since we live in a disk galaxy, it is an important question whether these interactions could destroy the disk,” Kazantzidis said. “We saw that galaxies are not destroyed, but the encounters leave behind a wealth of signatures that are consistent with the current cosmological model, and consistent with our observations of galaxies in the universe.”

One signature is the flaring of the galaxy’s edges, just as the edges of the Milky Way and of other external galaxies are flared.

We consider this flaring to be one of the most important observable consequences of interactions between in-falling satellite galaxies and the galactic disk.”

In both articles, the researchers considered the impacts of many different smaller galaxies onto a larger, primary disk galaxy. They calculated the likely number of satellites and the orbital paths of those satellites, and then simulated what would happen during collision, including when the dark matter interacted gravitationally with the disk of the spiral galaxy.

None of the disk galaxies were torn apart; to the contrary, the primary galaxies gradually disintegrated the in-falling satellites, whose material ultimately became part of the larger galaxy.

The satellites passed through the galactic disk over and over, and on each pass, they would lose some of their mass, a process that would eventually destroy them completely.

Though the primary galaxy survived, it did form flared edges which closely resembled our galaxy’s flared appearance today.

“Every spiral galaxy has a complex formation and evolutionary history,” Kazantzidis said. “We would hope to understand exactly how the Milky Way formed and how it will evolve. We may never succeed in knowing its exact history, but we can try to learn as much as we can about it, and other galaxies like it.”

His coauthors included James Bullock from the University of California at Irvine, Andrew Zentner from the University of Pittsburgh, Andrey Kravtsov from the University of Chicago, Leonidas Moustakas from NASA’s Jet Propulsion Laboratory (JPL) , and Victor Debattista from the University of Central Lancashire in the UK.

Kazantzidis’ research was funded by the Center for Cosmology and Astro-Particle Physics at Ohio State. Other funding came from the National Science Foundation, NASA, the University of Pittsburgh, and the University of Chicago. The numerical simulations were performed on the zBox supercomputer at the University of Zurich and on the Cosmos cluster at JPL.

Contact:
Stelios Kazantzidis, (614) 247-1501;
stelios@mps.ohio-state.edu
Written by Pam Frost Gorder, (614) 292-9475; Gorder.1@osu.edu

Thursday, August 27, 2009

Cygnus X-1: Still a "Star" After All Those Years

  • Originally discovered in 1964, Cygnus X-1 has been observed intensely since
  • In the 1970s, X-ray and optical observations led to the conclusion that Cygnus X-1 contained a black hole, the first one identified
  • Because it is only 6,000 light years from Earth, Cygnus X-1 is a very bright and therefore a good target for astronomers to study
Since its discovery 45 years ago, Cygnus X-1 has been one of the most intensively studied cosmic X-ray sources. About a decade after its discovery, Cygnus X-1 secured a place in the history of astronomy when a combination of X-ray and optical observations led to the conclusion that it was a black hole, the first such identification.

The Cygnus X-1 system consists of a black hole with a mass about 10 times that of the Sun in a close orbit with a blue supergiant star with a mass of about 20 Suns. Gas flowing away from the supergiant in a fast stellar wind is focused by the black hole, and some of this gas forms a disk that spirals into the black hole. The gravitational energy release by this infalling gas powers the X-ray emission from Cygnus X-1.

Although more than a thousand scientific articles have been published on Cygnus X-1, its status as a bright and nearby black hole continues to attract the interest of scientists seeking to understand the nature of black holes and how they affect their environment. Observations with Chandra and ESA's XMM-Newton are especially valuable for studying the property of the stellar wind that fuels Cygnus X-1, and determining its rate of spin. This latter research has revealed that Cygnus X-1 is spinning very slowly. This puzzling result could indicate that Cygnus X-1 may have formed in an unusual type of supernova that somehow prevented the newly formed black hole from acquiring as much spin as other stellar black holes.

Fast Facts for Cygnus X-1:

Scale: Image is about 4.7 arcmin across
Category: Black Holes
Coordinates: (J2000) RA 19h 58m 21.70s | Dec +35° 12' 05.80
Constellation: Cygnus
Observation Date: 01/30/2001 - 04/19/2003
Observation Time: 16 hours
Obs. ID: 2742-2743, 3814
Color Code: Intensity
Instrument: ACIS
References: M. Hanke et al. 2009 , Astrophys. J. 690, 330 J. Miller, 2007 Ann.Rev.Astron.Astrophys.45:441-479
Distance Estimate: About 8,000 light years

LookUP to Find Astronomical Objects


Have you heard about LookUP? Stuart Lowe from the Jodrell Bank Centre for Astrophysics created this web tool to provide quick access to information about the the position and other details of specific astronomical objects.

Instead of having to go search through an astronomical database, all you have to do is type in the name of the object (this doesn't apply for spacecraft) and LookUP contacts the relevant astronomical databases for you and provides info such as right ascension and declination.

There's also mobile version, an application for iPhones, and a widget for your desktop. The newest tool will thrill all the astronomy Twitterers out there. Rob Simpson from Orbiting Frog fame created a Twitter account for LookUP.

All you do is send a tweet to it with the name of your object, and it will send you the info and a link with for further information.

For example, I wanted to know where Asteroid Apophis was, and LookUp Tweeted back: Apophis is at RA 10:35:13.594 dec 07:37:40.210.

More info http://bit.ly/1aVqzG (that is valid for the time I sent the Tweet.) Check it out, its all very quick and easy and wonderful for all you stargazers out there.

Wednesday, August 26, 2009

Trifid Triple Treat

The Trifid Nebula

The Trifid Nebula (full frame)

Zoom in to the Trifid Nebula

Today ESO has released a new image of the Trifid Nebula, showing just why it is a firm favourite of astronomers, amateur and professional alike. This massive star factory is so named for the dark dust bands that trisect its glowing heart, and is a rare combination of three nebula types, revealing the fury of freshly formed stars and presaging more star birth.

Smouldering several thousand light-years away in the constellation of Sagittarius (the Archer), the Trifid Nebula presents a compelling portrait of the early stages of a star’s life, from gestation to first light. The heat and “winds” of newly ignited, volatile stars stir the Trifid’s gas and dust-filled cauldron; in time, the dark tendrils of matter strewn throughout the area will themselves collapse and form new stars.

The French astronomer Charles Messier first observed the Trifid Nebula in June 1764, recording the hazy, glowing object as entry number 20 in his renowned catalogue. Observations made about 60 years later by John Herschel of the dust lanes that appear to divide the cosmic cloud into three lobes inspired the English astronomer to coin the name “Trifid”.

Made with the Wide-Field Imager camera attached to the MPG/ESO 2.2-metre telescope at ESO’s La Silla Observatory in northern Chile, this new image prominently displays the different regions of the Trifid Nebula as seen in visible light. In the bluish patch to the upper left, called a reflection nebula, gas scatters the light from nearby, Trifid-born stars. The largest of these stars shines most brightly in the hot, blue portion of the visible spectrum. This, along with the fact that dust grains and molecules scatter blue light more efficiently than red light — a property that explains why we have blue skies and red sunsets — imbues this portion of the Trifid Nebula with an azure hue.

Below, in the round, pink-reddish area typical of an emission nebula, the gas at the Trifid’s core is heated by hundreds of scorching young stars until it emits the red signature light of hydrogen, the major component of the gas, just as hot neon gas glows red-orange in illuminated signs all over the world.

The gases and dust that crisscross the Trifid Nebula make up the third kind of nebula in this cosmic cloud, known as dark nebulae, courtesy of their light-obscuring effects. (The iconic Horsehead Nebula may be the most famous of these [ESO Press Photo 02/02]). Within these dark lanes, the remnants of previous star birth episodes continue to coalesce under gravity’s inexorable attraction. The rising density, pressure and temperature inside these gaseous blobs will eventually trigger nuclear fusion, and yet more stars will form.

In the lower part of this emission nebula, a finger of gas pokes out from the cloud, pointing directly at the central star powering the Trifid. This is an example of an evaporating gaseous globule, or "EGG", also seen in the Eagle Nebula, another star-forming region. At the tip of the finger, which was photographed by Hubble, a knot of dense gas has resisted the onslaught of radiation from the massive star.

More Information

ESO, the European Southern Observatory, is the foremost intergovernmental astronomy organisation in Europe and the world’s most productive astronomical observatory. It is supported by 14 countries: Austria, Belgium, the Czech Republic, Denmark, France, Finland, Germany, Italy, the Netherlands, Portugal, Spain, Sweden, Switzerland and the United Kingdom. ESO carries out an ambitious programme focused on the design, construction and operation of powerful ground-based observing facilities enabling astronomers to make important scientific discoveries. ESO also plays a leading role in promoting and organising cooperation in astronomical research. ESO operates three unique world-class observing sites in Chile: La Silla, Paranal and Chajnantor. At Paranal, ESO operates the Very Large Telescope, the world’s most advanced visible-light astronomical observatory. ESO is the European partner of a revolutionary astronomical telescope ALMA, the largest astronomical project in existence. ESO is currently planning a 42-metre European Extremely Large optical/near-infrared Telescope, the E-ELT, which will become “the world’s biggest eye on the sky”.

Contact
Henri Boffin
ESO
Phone: +49 89 3200 6222
E-mail: hboffin@eso.org

ESO Press Officer in Chile:
Valeria Foncea - +56 2 463 3123 - vfoncea@eso.org

National contacts for the media: http://www.eso.org/public/outreach/eson/

Thursday, August 20, 2009

Chandra's Top 10 Scientific Contributions

The Crab Nebula, seen by Chandra on September 28, 1999.
Image credit: NASA/CXC/SAO

Distant galaxy 3C294, observed by Chandra on February 15, 2001.
Image credit: NASA/IoA/A.Fabian et al.

Composite of galaxy cluster 1E 0657-56, a Chandra image from on August 21, 2006. Image credit: X-ray: NASA/CXC/CfA/M.Markevitch et al.; Optical: NASA/STScI; Magellan/U.Arizona/D.Clowe et al.; Lensing Map: NASA/STScI; ESO WFI; Magellan/U.Arizona/D.Clowe et al.

Artist concept of supernova SN 2006gy,
viewed by Chandra on May 7, 2007.
Illustration: NASA/CXC/M.Weiss

NASA's Chandra X-ray Observatory is celebrating 10 years of exploring the invisible universe. On Aug. 19, 1999, Chandra captured its first image as an astronomical observatory. This first light image opened a new era for science as Chandra began its mission to open a mysterious universe.

Chandra enables scientists from around the world to obtain unprecedented X-ray images of exotic environments to help understand the evolution of the cosmos. The observatory not only helps to probe these mysteries, but also serves as a unique tool to study detailed physics in a laboratory that cannot be replicated on Earth.

"Chandra has changed the whole understanding of dark matter and increased our knowledge of dark energy, as well as gathered new information on black holes," said Dr. Martin Weisskopf, Chandra project scientist at the Marshall Space Flight Center.

"Chandra has produced 10,000 observations in its 10-year life and the demand for observation time, by scientists, is five- to six-times what is available," said Chandra Program Manager Keith Hefner of the Marshall Center. "It continues to be an engineering marvel that has more than doubled its original five-year mission."
  1. A Chandra "Top 10" reveals some of the most noteworthy discoveries: Chandra finds a ring around the Crab Nebula. After only two months in space, the observatory reveals a brilliant ring around the heart of the Crab Pulsar in the Crab Nebula -- the remains of a stellar explosion -- providing clues about how the nebula is energized by a pulsing neutron, or collapsed star. (Sept. 28, 1999)
  2. Chandra finds the most distant X-ray cluster. Using the Chandra Observatory, astronomers find the most distant X-ray cluster of galaxies yet. Approximately 10 billion light years from Earth, the cluster 3C294 is 40 percent farther than the next most distant X-ray galaxy cluster. (Feb. 15, 2001)
  3. Chandra makes deepest X-ray exposure. A Chandra image, Deep Field North, captures for 23 days an area of the sky one-fifth the size of the full moon. Even though the faintest sources detected produced only one X-ray photon every four days, Chandra finds more than 600 X-ray sources, most of them super massive black holes in galaxy centers. (June 19, 2003)
  4. Chandra hears a black hole. Using the Chandra observatory, astronomers for the first time detected sound waves from a super massive black hole. Coming from a black hole 250 million light years from Earth, the "note" is the deepest ever detected from an object in the universe. (Sept. 9, 2003)
  5. Chandra opens a new line of investigation on dark energy. Using galaxy-cluster images from Chandra, astronomers apply a powerful, new method for detecting and probing dark energy. The results offer intriguing clues about the nature of dark energy and the fate of the universe. (May 18, 2004)
  6. Chandra finds that Saturn reflects X-rays from the sun. The findings stem from the first observation of an X-ray flare reflected from Saturn's low-latitudes -- the region that correlates to Earth's equator and tropics. (May 25, 2005)
  7. Chandra finds proof of dark matter. In galaxy clusters, the normal matter, like the atoms that make up the stars, planets, and everything on Earth, is primarily in the form of hot gas and stars. The mass of the hot gas between the galaxies is far greater than the mass of the stars in all of the galaxies. This normal matter is bound in the cluster by the gravity of an even greater mass of dark matter. Without dark matter, which is invisible and can only be detected through its gravity, the fast-moving galaxies and the hot gas would quickly fly apart. (Aug.21, 2006)
  8. Chandra sees brightest supernova ever. The brightest stellar explosion ever recorded may be a long-sought new type of supernova, according to observations by NASA's Chandra X-ray Observatory and ground-based optical telescopes. This discovery indicates that violent explosions of extremely massive stars were relatively common in the early universe, and that a similar explosion may be ready to go off in our own galaxy. (May 7, 2007)
  9. Chandra finds a new way to weigh black holes. By measuring a peak in the temperature of hot gas in the center of the giant elliptical galaxy NGC 4649, scientists have determined the mass of the galaxy's super massive black hole. The method, applied for the first time, gives results that are consistent with a traditional technique. (July 16, 2008)
  10. Long observation from Chandra identified the source of this energy for blobs. The X-ray data show that a significant source of power within these colossal structures is from growing super massive black holes partially obscured by dense layers of dust and gas. The fireworks of star formation in galaxies are also seen to play an important role, thanks to Spitzer Space Telescope and ground-based observations. (June 24, 2009)

The Marshall Center manages the Chandra program for the Science and Mission Directorate, NASA Headquarters, Washington. Northrop Grumman of Redondo Beach, Calif., formerly TRW Inc., was the prime development contractor for the observatory. The Smithsonian Astrophysical Observatory controls science and flight operations from the Chandra X-ray Center in Cambridge, Mass.

For more information visit: http://www.nasa.gov/chandra

Janet Anderson, 256-544-6162
Marshall Space Flight Center, Huntsville, Ala.
Janet.L.Anderson@nasa.gov

Wednesday, August 19, 2009

Gravitational Wave Observatory listens for echoes of universe’s birth

Credit: Hense, NASA

GAINESVILLE, Fla. — An investigation by a major scientific group headed by a University of Florida professor has advanced understanding of the early evolution of the universe.

An analysis of data from the Laser Interferometer Gravitational-Wave Observatory Scientific Collaboration, or LIGO, and the Virgo Collaboration has set the most stringent limits yet on the amount of gravitational waves that could have come from the Big Bang in the gravitational wave frequency band where LIGO can observe. In doing so, scientists have put new constraints on the details of how the universe looked in its earliest moments.

“Gravitational waves are the only way to directly probe the universe at the moment of its birth; they’re absolutely unique in that regard,” said David Reitze, a UF professor of physics and the spokesperson for the LIGO Scientific Collaboration. “We simply can’t get this information from any other type of astronomy. This is what makes this result in particular, and gravitational-wave astronomy in general, so exciting.”

The research is set to appear in the Aug. 20 issue of the journal Nature. Seventeen UF faculty members, postdoctoral associates and graduate students join the paper’s authors.

Much like it produced the cosmic microwave background, the Big Bang is believed to have created a flood of gravitational waves — ripples in the fabric of space and time — that carry information about the universe as it was immediately after the Big Bang. These waves would be observed as the “stochastic background,” analogous to a superposition of many waves of different sizes and directions on the surface of a pond. The amplitude of this background is directly related to the parameters that govern the behavior of the infant universe.

Earlier measurements of the cosmic microwave background have placed the most stringent upper limits of the stochastic gravitational wave background at very large distance scales and low frequencies. The new measurements by LIGO directly probe the gravitational wave background in the first minute of its existence, at time scales much shorter than accessible by the cosmic microwave background.

The research also constrains models of cosmic strings, objects that are proposed to have been left over from the beginning of the universe and subsequently stretched to enormous lengths by the universe’s expansion. These strings, some cosmologists say, can form loops that produce gravitational waves as they oscillate, decay and eventually disappear.

Gravitational waves carry with them information about their violent origins and about the nature of gravity that cannot be obtained by conventional astronomical tools. The existence of the waves was predicted by Albert Einstein in 1916 in his general theory of relativity. The LIGO and GEO instruments have been actively searching for the waves since 2002; the Virgo interferometer joined the search in 2007.

The UF LIGO research group built one of the most important and complex parts of the gravitational wave detector, the input optics, said David Tanner, a UF professor of physics. The input optics takes light from the laser, shapes the beam into an ideal form, and directs it to the interferometer at the heart of the gravitational wave detector. UF scientists are working to design and build a second version of the input optics for a major upgrade to LIGO scheduled to go on line in three to four years.

“UF also plays important role in analysis of LIGO data, including searches for sharp bursts of gravitational waves, and for the stochastic background of gravitational waves … the subject of the just published paper,” Tanner wrote in an e-mail.

The authors of the new paper report that the stochastic background of gravitational waves has not yet been discovered. But the nondiscovery of the background described in the Nature paper already offers its own brand of insight into the universe’s earliest history.

The analysis used data collected from the LIGO interferometers in Hanford, Wash., and Livingston, La. Each of the L-shaped interferometers uses a laser split into two beams that travel back and forth down long interferometer arms. The two beams are used to monitor the difference between the two interferometer arm lengths.

“Since we have not observed the stochastic background, some of these early-universe models that predict a relatively large stochastic background have been ruled out,” said Vuk Mandic, assistant professor at the University of Minnesota and the head of the group that performed the analysis. “We now know a bit more about parameters that describe the evolution of the universe when it was less than one minute old.”

Credits

Media Contact
Aaron Hoover, ahoover@ufl.edu

Contact
Dave Reitze, reitze@phys.ufl.edu, 352-316-5359 (cell)

Galaxies Demand a Stellar Recount


A Lesson in Counting Stars
Credit: NASA/JPL-Caltech/JHU
These two photographs were made by combining data from NASA's Galaxy Evolution Explorer spacecraft and the Cerro Tololo Inter-American Observatory in Chile. By combining the data, astronomers were able to learn that not all galaxies make stars of different sizes in the same quantities, as was previously assumed. In other words, the proportion of small to big stars can differ from galaxy to galaxy. In these pictures, images taken with the Galaxy Evolution Explorer at shorter ultraviolet wavelengths are dark blue, while longer ultraviolet wavelengths are lighter blue. The optical images are colored red and yellow; red light is shown in yellow, while specially filtered red light from a type of hydrogen emission called H-alpha is colored red. In these pictures, the portions of galaxies that are rich in massive stars, called "O" stars, show up as white or pink. Areas dominated by slightly smaller stars, called "B" stars, appear blue. The spiral galaxy on the left, called NGC 1566, is an example of a galaxy that is comparatively rich in O stars compared to B stars. By contrast, the galaxy on the right, NGC 6902, has a weaker population of O stars compared to its B stars. NGC 1566 is 68 million light years away in the southern constellation of Dorado. NGC 6902 is about 33 million light years away in the constellation Sagittarius.


Adding up Stars in a Galaxy
Credit: NASA/JPL-Caltech
This diagram illustrates the extent to which astronomers have been underestimating the proportion of small to big stars in certain galaxies. Data from NASA's Galaxy Evolution Explorer spacecraft and the Cerro Tololo Inter-American Observatory in Chile have shown that, in some cases, there can be as many as four times more small stars compared to large ones.

In the diagram, a massive blue star is shown next to a stack of lighter, yellow stars. These big blue stars are three to 20 times more massive than our sun, while the smaller stars are typically about the same mass as the sun or smaller. Before the Galaxy Evolution Explorer study, astronomers assumed there were 500 small stars for every massive one (lower stack on right). The new observations reveal that, in certain galaxies, this estimation is off by a factor of four; for every massive star, there could be as many as 2,000 small counterparts (entire stack on right).

For decades, astronomers have gone about their business of studying the cosmos with the assumption that stars of certain sizes form in certain quantities. Like grocery stores selling melons alone, and blueberries in bags of dozens or more, the universe was thought to create stars in specific bundles. In other words, the proportion of small to big stars was thought to be fixed. For every star 20 or more times as massive as the sun, for example, there should be 500 stars with the sun's mass or less.

This belief, based on years of research, has been tipped on its side with new data from NASA's Galaxy Evolution Explorer. The ultraviolet telescope has found proof that small stars come in even bigger bundles than previously believed; for example, in some places in the cosmos, about 2,000 low-mass stars may form for each massive star. The little stars were there all along but masked by massive, brighter stars.

"What this paper is showing is that some of the standard assumptions that we've had - that the brightest stars tell you about the whole population of stars - this doesn't seem to work, at least not in a constant way," said Gerhardt R. Meurer, principal investigator on the study and a research scientist at Johns Hopkins University, Baltimore, Md.

Astronomers have long known that many stars are too dim to be seen in the glare of their brighter, more massive counterparts. Though the smaller, lighter stars outnumber the big ones, they are harder to see. Going back to a grocery story analogy, the melons grab your eyes, even though the total weight of the blueberries may be more.

Beginning in the 1950s, astronomers came up with a method for counting all the stars in a region, even the ones they couldn't detect. They devised a sort of stellar budget, an equation called the "stellar initial mass function," to estimate the total number of stars in an area of the sky based on the light from only the brightest and most massive. For every large star formed, a set number of smaller ones were thought to have been created regardless of where the stars sat in the universe.

"We tried to understand properties of galaxies and their mass by looking at the light we can see," Meurer said.

But this common assumption has been leading astronomers astray, said Meurer, especially in galaxies that are intrinsically small and faint.

To understand the problem, imagine trying to estimate the population on Earth by observing light emitted at night. Looking from above toward North America or Europe, the regions where more people live light up like signposts. Los Angeles, for example, is easily visible to a scientist working on the International Space Station. However, if this method were applied to regions where people have limited electricity, populations would be starkly underestimated, for example in some sections of Africa.

The same can be said of galaxies, whose speckles of light in the dark of space can be misleading. Meurer and his team used ultraviolet images from the Galaxy Evolution Explorer and carefully filtered red-light images from telescopes at the Cerro Tololo International Observatory in Chile to show that many galaxies do not form a lot of massive stars, yet still have plenty of lower-mass counterparts. The ultraviolet images are sensitive to somewhat small stars three times or more massive than the sun, while the filtered optical images are only sensitive to the largest stars with 20 or more times the mass of the sun.

The effects are particularly important in parts of the universe where stars are spread out over a larger volume -- the rural Africa of the cosmos. There could be about four times as many stars in these regions than previously estimated.

"Especially in these galaxies that seem small and piddling, there can be a lot more mass in lower mass stars than we had previously expected from what we could see from the brightest, youngest stars," Meurer said. "But we can now reduce these errors using satellites like the Galaxy Evolution Explorer."

This research was published in the April 10, 2009, issue of Astrophysical Journal.

Media Contacts:
Whitney Clavin 818-354-4673
Jet Propulsion Laboratory, Pasadena, Calif.

A Look into the Hellish Cradles of Suns and Solar Systems

ESO PR Photo 29a/09
Around the massive star IRS2

ESO PR Photo 29b/09
Star cluster RCW 38

ESO PR Photo 29c/09
Nebula around star cluster RCW 38

ESO PR Video 29a/09
Zoom in on the embedded star cluster RCW 38

New images released today by ESO delve into the heart of a cosmic cloud, called RCW 38, crowded with budding stars and planetary systems. There, young, titanic stars bombard fledgling suns and planets with powerful winds and blazing light, helped in their devastating task by short-lived, massive stars that explode as supernovae. In some cases, this energetic onslaught cooks away the matter that may eventually form new solar systems. Scientists think that our own Solar System emerged from such a dramatic environment.

The dense star cluster RCW 38 glistens about 5500 light years away in the direction of the constellation Vela (the Sails). Like the Orion Nebula Cluster (ESO 12/01), RCW 38 is an “embedded cluster”, in that the nascent cloud of dust and gas still envelops its stars. Astronomers have determined that most stars, including the low mass, reddish ones that outnumber all others in the Universe, originate in these matter-rich locations. Accordingly, embedded clusters provide scientists with a living laboratory in which to explore the mechanisms of star and planetary formation.

“By looking at star clusters like RCW 38, we can learn a great deal about the origins of our Solar System and others, as well as those stars and planets that have yet to come”, said Kim DeRose, first author of the new study that appears in the Astronomical Journal. DeRose did her work on RCW 38 while an undergraduate student at the Harvard-Smithsonian Center for Astrophysics, USA.

Using the NACO adaptive optics instrument on ESO’s Very Large Telescope [1] the astronomers obtained the sharpest image yet of RCW 38. They focused on a small area in the centre of the cluster that surrounds the massive star IRS2, which glows in the searing, white-blue range, the hottest surface colour and temperatures possible for stars. These dramatic observations revealed that IRS2 is actually not one, but two stars — a binary system consisting of twin scorching stars, separated by about 500 times the Earth–Sun distance.

In the NACO image, the astronomers found a handful of protostars — the faintly luminous precursors to fully realised stars — and dozens of other candidate stars that have eked out an existence here despite the powerful ultraviolet light radiated by IRS2. Some of these gestating stars may, however, not get past the protostar stage. IRS2’s strong radiation energises and disperses the material that might otherwise collapse into new stars, or that has settled into so-called protoplanetary discs around developing stars. In the course of several million years, the surviving discs may give rise to the planets, moons and comets that make up planetary systems like our own.

As if intense ultraviolet rays were not enough, crowded stellar nurseries like RCW 38 also subject their brood to frequent supernovae, as giant stars explode at the ends of their lives. These explosions scatter material throughout nearby space, including rare isotopes — exotic forms of chemical elements that are created in these dying stars. This ejected material ends up in the next generation of stars that form nearby. As these isotopes have been detected in our Sun, scientists have concluded that the Sun formed in a cluster like RCW 38, rather than in a more rural portion of the Milky Way.

“Overall, the details of astronomical objects that adaptive optics reveals are critical in understanding how new stars and planets form in complex, chaotic regions like RCW 38”, says co-author Dieter Nürnberger.

Note
[1] The name “NACO” is a combination of the Nasmyth Adaptive Optics System (NAOS) and the Near-Infrared Imager and Spectrograph (CONICA). Adaptive optics cancels out most of the image-distorting turbulence in Earth’s atmosphere caused by temperature variations and wind.

More Information
This research was presented in a paper that appeared in the Astronomical Journal: A Very Large Telescope / NACO study of star formation in the massive embedded cluster RCW 38, by DeRose et al. (2009, AJ, 138, 33-45).

The team is composed of K.L. DeRose, T.L. Bourke, R.A. Gutermuth and S.J. Wolk (Harvard-Smithsonian Center for Astrophysics, Cambridge, USA), S.T. Megeath (Department of Physics and Astronomy, The University of Toledo, USA), J. Alves (Centro Astronómico Hispano Alemán, Almeria, Spain), and D. Nürnberger (ESO).

ESO, the European Southern Observatory, is the foremost intergovernmental astronomy organisation in Europe and the world’s most productive astronomical observatory. It is supported by 14 countries: Austria, Belgium, the Czech Republic, Denmark, France, Finland, Germany, Italy, the Netherlands, Portugal, Spain, Sweden, Switzerland and the United Kingdom. ESO carries out an ambitious programme focused on the design, construction and operation of powerful ground-based observing facilities enabling astronomers to make important scientific discoveries. ESO also plays a leading role in promoting and organising cooperation in astronomical research. ESO operates three unique world-class observing sites in Chile: La Silla, Paranal and Chajnantor. At Paranal, ESO operates the Very Large Telescope, the world’s most advanced visible-light astronomical observatory. ESO is the European partner of a revolutionary astronomical telescope ALMA, the largest astronomical project in existence. ESO is currently planning a 42-metre European Extremely Large optical/near-infrared Telescope, the E-ELT, which will become “the world’s biggest eye on the sky”.

Links
Contacts

Dieter Nürnberger
ESO, Chile
Phone: +56 2 463 3080
E-mail: dnuernbe@eso.org

ESO La Silla - Paranal - ELT Press Officer:
Henri Boffin - +49 89 3200 6222 -
hbofin@eso.org

ESO Press Officer in Chile:
Valeria Foncea - +56 2 463 3123 -
vfoncea@eso.org

National contacts for the media: http://www.eso.org/public/outreach/eson/

Monday, August 17, 2009

NASA Researchers Make First Discovery of Life's Building Block in Comet

This is an artist's concept of the Stardust spacecraft beginning its flight through gas and dust around comet Wild 2. The white area represents the comet. The collection grid is the tennis-racket-shaped object extending out from the back of the spacecraft.
Credit: NASA/JPL

This is an artist's concept of particle hits on the aerogel collection grid. The greenish areas represent the aerogel. Hits are the light green teardrop-shaped areas. Particles are represented by dots at the tips of the teardrops.
Credit: NASA/JPL

NASA scientists have discovered glycine, a fundamental building block of life, in samples of comet Wild 2 returned by NASA's Stardust spacecraft.

"Glycine is an amino acid used by living organisms to make proteins, and this is the first time an amino acid has been found in a comet," said Dr. Jamie Elsila of NASA's Goddard Space Flight Center in Greenbelt, Md. "Our discovery supports the theory that some of life's ingredients formed in space and were delivered to Earth long ago by meteorite and comet impacts."

Elsila is the lead author of a paper on this research accepted for publication in the journal Meteoritics and Planetary Science. The research will be presented during the meeting of the American Chemical Society at the Marriott Metro Center in Washington, DC, August 16.

"The discovery of glycine in a comet supports the idea that the fundamental building blocks of life are prevalent in space, and strengthens the argument that life in the universe may be common rather than rare," said Dr. Carl Pilcher, Director of the NASA Astrobiology Institute which co-funded the research.

Proteins are the workhorse molecules of life, used in everything from structures like hair to enzymes, the catalysts that speed up or regulate chemical reactions. Just as the 26 letters of the alphabet are arranged in limitless combinations to make words, life uses 20 different amino acids in a huge variety of arrangements to build millions of different proteins.

Stardust passed through dense gas and dust surrounding the icy nucleus of Wild 2 (pronounced "Vilt-2") on January 2, 2004. As the spacecraft flew through this material, a special collection grid filled with aerogel – a novel sponge-like material that's more than 99 percent empty space – gently captured samples of the comet's gas and dust. The grid was stowed in a capsule which detached from the spacecraft and parachuted to Earth on January 15, 2006. Since then, scientists around the world have been busy analyzing the samples to learn the secrets of comet formation and our solar system's history.

"We actually analyzed aluminum foil from the sides of tiny chambers that hold the aerogel in the collection grid," said Elsila. "As gas molecules passed through the aerogel, some stuck to the foil. We spent two years testing and developing our equipment to make it accurate and sensitive enough to analyze such incredibly tiny samples."

Earlier, preliminary analysis in the Goddard labs detected glycine in both the foil and a sample of the aerogel. However, since glycine is used by terrestrial life, at first the team was unable to rule out contamination from sources on Earth. "It was possible that the glycine we found originated from handling or manufacture of the Stardust spacecraft itself," said Elsila. The new research used isotopic analysis of the foil to rule out that possibility.

Isotopes are versions of an element with different weights or masses; for example, the most common carbon atom, Carbon 12, has six protons and six neutrons in its center (nucleus). However, the Carbon 13 isotope is heavier because it has an extra neutron in its nucleus. A glycine molecule from space will tend to have more of the heavier Carbon 13 atoms in it than glycine that's from Earth. That is what the team found. "We discovered that the Stardust-returned glycine has an extraterrestrial carbon isotope signature, indicating that it originated on the comet," said Elsila.

The team includes Dr. Daniel Glavin and Dr. Jason Dworkin of NASA Goddard. "Based on the foil and aerogel results it is highly probable that the entire comet-exposed side of the Stardust sample collection grid is coated with glycine that formed in space," adds Glavin.

"The discovery of amino acids in the returned comet sample is very exciting and profound," said Stardust Principal Investigator Professor Donald E. Brownlee of the University of Washington, Seattle, Wash. "It is also a remarkable triumph that highlights the advancing capabilities of laboratory studies of primitive extraterrestrial materials."

The research was funded by the NASA Stardust Sample Analysis program and the NASA Astrobiology Institute. NASA's Jet Propulsion Laboratory, Pasadena, Calif., manages the Stardust mission for NASA's Science Mission Directorate, Washington. Lockheed Martin Space Systems, Denver, developed and operated the spacecraft.

To learn more about the mission, visit http://stardustnext.jpl.nasa.gov/

For more about the NASA Goddard astrobiology team, visit
http://astrobiology.gsfc.nasa.gov/analytical


Bill Steigerwald
NASA Goddard Space Flight Center

Friday, August 14, 2009

Super Planetary Nebulae

Image Composed by E. Crawford & S. Griffith

A team of scientists in Australia and the United States, led by Associate Professor Miroslav Filipović from the University of Western Sydney, have discovered a new class of object which they call “Super Planetary Nebulae.” They report their work in the journal Monthly Notices of the Royal Astronomical Society.

Planetary nebulae are shells of gas and dust expelled by stars near the end of their lives and are typically seen around stars comparable or smaller in size than the Sun.

The team surveyed the Magellanic Clouds, the two companion galaxies to the Milky Way, with radio telescopes of the Commonwealth Scientific and Industrial Research Organisation (CSIRO) Australia Telescope National Facility. They noticed that 15 radio objects in the Clouds match with well known planetary nebulae observed by optical telescopes.

The new class of objects are unusually strong radio sources. Whereas the existing population of planetary nebulae is found around small stars comparable in size to our Sun, the new population may be the long predicted class of similar shells around heavier stars.

Filipović’s team argues that the detections of these new objects may help to solve the so called “missing mass problem” – the absence of planetary nebulae around central stars that were originally 1 to 8 times the mass of the Sun. Up to now most known planetary nebulae have central stars and surrounding nebulae with respectively only about 0.6 and 0.3 times the mass of the Sun but none have been detected around more massive stars.

The new Super Planetary Nebulae are associated with larger original stars (progenitors), up to 8 times the mass of the Sun. And the nebular material around each star may have as much as 2.6 times the mass of the Sun.

“This came as a shock to us”, says Filipović, “as no one expected to detect these object at radio wavelengths and with the present generation of radio telescopes. We have been holding up our findings for some 3 years until we were 100% sure that they are indeed Planetary Nebulae”.

Some of the 15 newly discovered planetary nebulae in the Magellanic Clouds are 3 times more luminous then any of their Milky Way cousins. But to see them in greater detail astronomers will need the power of a coming radio telescope – the Square Kilometre Array planned for the deserts of Western Australia.

FURTHER INFORMATION

Accompanying images are available from http://staff.scm.uws.edu.au/~evan/PNE/

An optical image from the 0.6-m University of Michigan/CTIO Curtis Schmidt telescope of the brightest Radio Planetary Nebula in the Small Magellanic Cloud, JD 04. The inset box shows a portion of this image overlaid with radio contours from the Australia Telescope Compact Array. The planetary nebula is a glowing record of the final death throes of the star. (Optical images are courtesy of the Magellanic Cloud Emission Line Survey (MCELS) team).

The MNRAS paper is available as an Early View article from
http://www3.interscience.wiley.com/journal/122542603/abstract

CONTACT

Professor Miroslav Filipović
University of Western Sydney
Tel: +61 (0)41 1547892
Mob: +61 (0)41 1547892
E-mail: m.filipovic@uws.edu.au

Royal Astronomical Society Press Release
Date: 14th August 2009
For immediate release
SUPER PLANETARY NEBULAE
Ref.: PN 09/51

Issued by:
Dr Robert Massey
Press and Policy Officer
Royal Astronomical Society
Burlington House
Piccadilly
London W1J 0BQ
Tel: +44 (0)794 124 8035, +44 (0)20 7734 4582
E-mail: rm@ras.org.uk
Web: www.ras.org.uk

NOTES FOR EDITORS

THE ROYAL ASTRONOMICAL SOCIETY

The Royal Astronomical Society (RAS), founded in 1820, encourages and promotes the study of astronomy, solar-system science, geophysics and closely related branches of science. The RAS organizes scientific meetings, publishes international research and review journals, recognizes outstanding achievements by the award of medals and prizes, maintains an extensive library, supports education through grants and outreach activities and represents UK astronomy nationally and internationally. Its more than 3000 members (Fellows), a third based overseas, include scientific researchers in universities, observatories and laboratories as well as historians of astronomy and others.

Wednesday, August 12, 2009

Variability of type 1a supernovae has implications for dark energy studies

This image based on a computer simulation of a type 1a supernova shows the turbulent and symmetric flame of the runaway thermonuclear burning that consumes the white dwarf star. Image by F. Ropke.

In this image from a computer simulation, debris from a type 1a supernova explosion shows the asymmetric substructures that develop from the turbulent flame that consumes the white dwarf star. Colors represent different elements synthesized in the explosion (e.g., red=nickel-56). Image by D. Kasen et al.

The stellar explosions known as type 1a supernovae have long been used as "standard candles", their uniform brightness giving astronomers a way to measure cosmic distances and the expansion of the universe. But a new study published this week in Nature reveals sources of variability in type 1a supernovae that will have to be taken into account if astronomers are to use them for more precise measurements in the future.

The discovery of dark energy, a mysterious force that is accelerating the expansion of the universe, was based on observations of type 1a supernovae. But in order to probe the nature of dark energy and determine if it is constant or variable over time, scientists will have to measure cosmic distances with much greater precision than they have in the past.

"As we begin the next generation of cosmology experiments, we will want to use type 1a supernovae as very sensitive measures of distance," said lead author Daniel Kasen, a Hubble postdoctoral fellow at the University of California, Santa Cruz. "We know they are not all the same brightness, and we have ways of correcting for that, but we need to know if there are systematic differences that would bias the distance measurements. So this study explored what causes those differences in brightness."

Kasen and his coauthors--Fritz Röpke of the Max Planck Institute for Astrophysics in Garching, Germany, and Stan Woosley, professor of astronomy and astrophysics at UC Santa Cruz--used supercomputers to run dozens of simulations of type 1a supernovae. The results indicate that much of the diversity observed in these supernovae is due to the chaotic nature of the processes involved and the resulting asymmetry of the explosions.

For the most part, this variability would not produce systematic errors in measurement studies as long as researchers use large numbers of observations and apply the standard corrections, Kasen said. The study did find a small but potentially worrisome effect that could result from systematic differences in the chemical compositions of stars at different times in the history of the universe. But researchers can use the computer models to further characterize this effect and develop corrections for it.

"Since we are beginning to understand how type 1a supernovae work from first principles, these models can be used to refine our distance estimates and make measurements of the expansion rate of the universe more precise," Woosley said.

A type 1a supernova occurs when a white dwarf star acquires additional mass by siphoning matter away from a companion star. When it reaches a critical mass--1.4 times the mass of the Sun, packed into an object the size of the Earth--the heat and pressure in the center of the star spark a runaway nuclear fusion reaction, and the white dwarf explodes. Since the initial conditions are about the same in all cases, these supernovae tend to have the same luminosity, and their "light curves" (how the luminosity changes over time) are predictable.

Some are intrinsically brighter than others, but these flare and fade more slowly, and this correlation between the brightness and the width of the light curve allows astronomers to apply a correction to standardize their observations. So astronomers can measure the light curve of a type 1a supernova, calculate its intrinsic brightness, and then determine how far away it is, since the apparent brightness diminishes with distance (just as a candle appears dimmer at a distance than it does up close).

The computer models used to simulate these supernovae in the new study are based on current theoretical understanding of how and where the ignition process begins inside the white dwarf and where it makes the transition from slow-burning combustion to explosive detonation.

"Since ignition does not occur in the dead center, and since detonation occurs first at some point near the surface of the exploding white dwarf, the resulting explosions are not spherically symmetric," Woosley explained. "This could only be studied properly using multi-dimensional calculations."

Most previous studies have used one-dimensional models in which the simulated explosion is spherically symmetric. Multi-dimensional simulations require much more computing power, so Kasen's group ran most of their simulations on the powerful Jaguar supercomputer at Oak Ridge National Laboratory, and also used supercomputers at the National Energy Research Scientific Computing Center at Lawrence Berkeley National Laboratory. The results of two-dimensional models are reported in the Nature paper, and three-dimensional studies are currently under way.

The simulations showed that the asymmetry of the explosions is a key factor determining the brightness of type 1a supernovae. "The reason these supernovae are not all the same brightness is closely tied to this breaking of spherical symmetry," Kasen said.

The dominant source of variability is the synthesis of new elements during the explosions, which is sensitive to differences in the geometry of the first sparks that ignite a thermonuclear runaway in the simmering core of the white dwarf. Nickel-56 is especially important, because the radioactive decay of this unstable isotope creates the afterglow that astronomers are able to observe for months or even years after the explosion.

"The decay of nickel-56 is what powers the light curve. The explosion is over in a matter of seconds, so what we see is the result of how the nickel heats the debris and how the debris radiates light," Kasen said.

Kasen developed the computer code to simulate this radiative transfer process, using output from the simulated explosions to produce visualizations that can be compared directly to astronomical observations of supernovae.

The good news is that the variability seen in the computer models agrees with observations of type 1a supernovae. "Most importantly, the width and peak luminosity of the light curve are correlated in a way that agrees with what observers have found. So the models are consistent with the observations on which the discovery of dark energy was based," Woosley said.

Another source of variability is that these asymmetric explosions look different when viewed at different angles. This can account for differences in brightness of as much as 20 percent, Kasen said, but the effect is random and creates scatter in the measurements that can be statistically reduced by observing large numbers of supernovae.

The potential for systematic bias comes primarily from variation in the initial chemical composition of the white dwarf star. Heavier elements are synthesized during supernova explosions, and debris from those explosions is incorporated into new stars. As a result, stars formed recently are likely to contain more heavy elements (higher "metallicity," in astronomers' terminology) than stars formed in the distant past.

"That's the kind of thing we expect to evolve over time, so if you look at distant stars corresponding to much earlier times in the history of the universe, they would tend to have lower metallicity," Kasen said. "When we calculated the effect of this in our models, we found that the resulting errors in distance measurements would be on the order of 2 percent or less."

Further studies using computer simulations will enable researchers to characterize the effects of such variations in more detail and limit their impact on future dark-energy experiments, which might require a level of precision that would make errors of 2 percent unacceptable.

This study was supported by the Department of Energy's Scientific Discovery through Advanced Computing (SciDAC) program. Computer time was provided by NERSC and ORNL through an award from DOE's Innovative and Novel Computational Impact on Theory and Experiment (INCITE) program.

By Tim Stephens (831) 459-2495; stephens@ucsc.edu
UC Santa Cruz - News_Events

Cepheus B: Trigger-Happy Star Formation


This composite image, combining data from the Chandra X-ray Observatory and the Spitzer Space Telescope shows the molecular cloud Cepheus B, located in our Galaxy about 2,400 light years from the Earth. A molecular cloud is a region containing cool interstellar gas and dust left over from the formation of the galaxy and mostly contains molecular hydrogen. The Spitzer data, in red, green and blue shows the molecular cloud (in the bottom part of the image) plus young stars in and around Cepheus B, and the Chandra data in violet shows the young stars in the field.

The Chandra observations allowed the astronomers to pick out young stars within and near Cepheus B, identified by their strong X-ray emission. The Spitzer data showed whether the young stars have a so-called "protoplanetary" disk around them. Such disks only exist in very young systems where planets are still forming, so their presence is an indication of the age of a star system.

These data provide an excellent opportunity to test a model for how stars form. The new study suggests that star formation in Cepheus B is mainly triggered by radiation from one bright, massive star (HD 217086) outside the molecular cloud. According to the particular model of triggered star formation that was tested -- called the radiation-driven implosion (RDI) model -- radiation from this massive star drives a compression wave into the cloud triggering star formation in the interior, while evaporating the cloud's outer layers.

The labeled version of the image (rollover the image above) shows important regions in and around Cepheus B. The "inner layer" shows the Cepheus B region itself, where the stars are mostly about one million years old and about 70-80% of them have protoplanetary disks. The "intermediate layer" shows the area immediately next to Cepheus B, where the stars are two to three million years old and about 60% of them have disks, while in the "outer layer" the stars are about three to five million years old and about 30% of them have disks. This increase in age as the stars are further away from Cepheus B is exactly what is predicted from the RDI model of triggered star formation.

Different types of triggered star formation have been observed in other environments. For example, the formation of our solar system was thought to have been triggered by a supernova explosion, In the star-forming region W5, a "collect-and-collapse" mechanism is thought to apply, where shock fronts generated by massive stars sweep up material as they progress outwards. Eventually the accumulated gas becomes dense enough to collapse and form hundreds of stars. The RDI mechanism is also thought to be responsible for the formation of dozens of stars in W5. The main cause of star formation that does not involve triggering is where a cloud of gas cools, gravity gets the upper hand, and the cloud falls in on itself.

Fast Facts for Cepheus B:

Scale: Image is 15 arcmin across
Category: Normal Stars & Star Clusters, White Dwarfs & Planetary Nebulas
Coordinates: (J2000) RA 22h 56m 46.99s | Dec +62° 40' 0.0012"
Constellation: Cepheus
Observation Date: 03/11/2003
Observation Time: 8 hours
Obs. ID: 3502
Color Code: X-ray (Violet); IR (Red, Green, Blue)
Instrument: ACIS
References: Getman, K.V., et al. (2009), ApJ, 699, 1454

Huge new planet tells of game of planetary billiards

A team of scientists has found a new planet which orbits the wrong way around its host star. The planet, named WASP-17, and orbiting a star 1000 light years away, was found by the UK's WASP project in collaboration with Geneva Observatory. The discovery, which casts new light on how planetary systems form and evolve, is being announced today (12th August) in a paper submitted to Astrophysical Journal.

Since planets form out of the same swirling gas cloud that creates a star, they are expected to orbit in the same direction that the star spins. Graduate students David Anderson, of Keele University, and Amaury Triaud, of Geneva Observatory, were surprised to find that WASP-17 is orbiting the wrong way, making it the first planet known to have a ``retrograde'' orbit. The likely explanation is that WASP-17 was involved in a near collision with another planet early in its history.

WASP-17 appears to have been the victim of a game of planetary billiards, flung into its unusual orbit by a close encounter with a ``big brother'' planet. Professor Coel Hellier, of Keele University, remarks: "Shakespeare said that two planets could no more occupy the same orbit than two kings could rule England; WASP-17 shows that he was right.”

David Anderson added “Newly formed solar systems can be violent places. Our own moon is thought to have been created when a Mars-sized planet collided with the recently formed Earth and threw up a cloud of debris that turned into the moon. A near collision during the early, violent stage of this planetary system could well have caused a gravitational slingshot, flinging WASP-17 into its backwards orbit.”

The first sign that WASP-17 was unusual was its large size. Though it is only half the mass of Jupiter it is bloated to nearly twice Jupiter's size, making it the largest planet known.

Astronomers have long wondered why some extra-solar planets are far bigger than expected, and WASP-17 points to the explanation. Scattered into a highly elliptical, retrograde orbit, it would have been subjected to intense tides. Tidal compression and stretching would have heated the gas-giant planet to its current, hugely bloated extent. "This planet is only as dense as expanded polystyrene, seventy times less dense than the planet we're standing on", notes Prof. Hellier.

Professor Keith Mason, Chief Executive of the Science and Technology Facilities Council, which funded the research, said, “This is a fascinating new find and another triumph for the WASP team. Not only are they locating these far flung and mysterious planets but revealing more about how planetary systems, such as our own Solar System, formed and evolved. The WASP team has proved once again why this project is currently the World's most successful project searching for transiting exoplanets.”

WASP-17 is the 17th new exoplanet (planet outside our solar system) found by the Wide Area Search for Planets (WASP) consortium of UK universities. The WASP team detected the planet using an array of cameras that monitor hundreds of thousands of stars, searching for small dips in their light when a planet transits in front of them. Geneva Observatory then measured the mass of WASP-17, showing that it was the right mass to be a planet. The WASP-South camera array that led to the discovery of WASP-17 is hosted by the South African Astronomical Observatory.

Note to Editors

The discovery paper for WASP-17 is available at astro-ph and has been submitted to Astrophysical Journal. A forthcoming paper led by Amaury Triaud confirms the retrograde orbit and studies the orbital dynamics in greater depth.

The WASP Project (Wide Area Search for Planets) is the UK's leading extra-solar planet detection program and includes Keele University, St. Andrews University, Queen's University Belfast, Leicester University, the Open University, and the Isaac Newton Group. WASP collaborates with the Geneva Observatory, Switzerland, who have a world-leading programme of planet discovery using the Coralie and HARPS spectrographs.

Shakespeare's Henry IV, Part 1, Act 5, Scene 4:
"Two stars keep not their motion in one sphere, Nor can one England brooke a double reign, Of Harry Percy, and the Prince of Wales."
(The word "stars" referred to planets in the cosmology of Shakespeare's time.)

"Transit": Term for a planet passing in front of its star, blocking a tiny fraction of its light.

"Retrograde": Term for an orbit in the opposite direction to the rotation of the star being orbited. All Solar System planets are in ``prograde'' orbits around our sun, orbiting in the same direction that the sun is spinning. "Extra-solar planet": A planet not in our Solar System, instead orbiting another star.

"Elliptical orbit": While the planets in our solar system have orbits that are close to circular, planet orbits can also trace out long, thin ellipses. "Tidal interactions": Just as our moon pulls the earth's oceans, causing tides, a star's gravity would cause tidal bulges on any planet nearby.

Contacts

Julia Short
Press Officer STFC Tel: +44 (0)1793 442 012

Coel Hellier
Keele University Tel: +44 (0)1782 734243 Mobile: +44 (0)7817 182867

Prof. Didier Queloz
Geneva Observatory Tel: +41 22 379 2477

Prof. Andrew Collier-Cameron
University of St. Andrews Tel:+44-1334-463147

Prof. Don Pollacco
Queens University Belfast Tel:+44 (0)2890 973512

Dr. Richard West
University of Leicester tel: +44 (0)116 252 5206

About STFC

Page last updated: 12 August 2009 by Julia Short