Showing posts with label Galaxy Cluster. Show all posts

Wednesday, April 02, 2025

Spying a spiral through a cosmic lens


In the centre is an elliptical galaxy, seen as an oval-shaped glow around a small bright core. Around this is wrapped a broad band of light, appearing like a spiral galaxy stretched and warped into a ring, with bright blue lines drawn through it where the spiral arms have been stretched into circles. A few distant objects are visible around the ring on a black background. Credit: ESA/Webb, NASA & CSA, G. Mahler. Acknowledgement: M. A. McDonald

This new NASA/ESA/CSA James Webb Space Telescope Picture of the Month features a rare cosmic phenomenon called an Einstein ring. What at first appears to be a single, strangely shaped galaxy is actually two galaxies that are separated by a large distance. The closer foreground galaxy sits at the center of the image, while the more distant background galaxy appears to be wrapped around the closer galaxy, forming a ring.

Einstein rings occur when light from a very distant object is bent (or ‘lensed’) about a massive intermediate (or ‘lensing’) object. This is possible because spacetime, the fabric of the Universe itself, is bent by mass, and therefore light travelling through space and time is bent as well. This effect is much too subtle to be observed on a local level, but it sometimes becomes clearly observable when dealing with curvatures of light on enormous, astronomical scales, such as when the light from one galaxy is bent around another galaxy or galaxy cluster.

When the lensed object and the lensing object line up just so, the result is the distinctive Einstein ring shape, which appears as a full circle (as seen here) or a partial circle of light around the lensing object, depending on the precision of the alignment. Objects like these are the ideal laboratory in which to research galaxies too faint and distant to otherwise see.

The lensing galaxy at the center of this Einstein ring is an elliptical galaxy, as can be seen from the galaxy’s bright core and smooth, featureless body. This galaxy belongs to a galaxy cluster named SMACSJ0028.2-7537. The lensed galaxy wrapped around the elliptical galaxy is a spiral galaxy. Even though its image has been warped as its light travelled around the galaxy in its path, individual star clusters and gas structures are clearly visible.

The Webb data used in this image were taken as part of the Strong Lensing and Cluster Evolution (SLICE) survey (programme 5594), which is led by Guillaume Mahler at University of Liège in Belgium, and consists of a team of international astronomers. This survey aims to trace 8 billion years of galaxy cluster evolution by targeting 182 galaxy clusters with Webb’s Near-InfraRed Camera instrument. This image also incorporates data from two of the NASA/ESA Hubble Space Telescope’s instruments, the Wide Field Camera 3 and the Advanced Camera for Surveys.

Links


Sunday, February 02, 2025

Black Holes Can Cook for Themselves, Chandra Study Shows

Perseus Cluster & the Centaurus Cluster
Credit: Perseus Cluster: X-ray: NASA/CXC/SAO/V. Olivares et al.; Optical/IR: DSS; H-alpha: CFHT/SITELLE; Centaurus Cluster: X-ray: NASA/CXC/SAO/V. Olivaresi et al.; Optical/IR: NASA/ESA/STScI; H-alpha: ESO/VLT/MUSE; Image Processing: NASA/CXC/SAO/N. Wolk


Astronomers have taken a crucial step in showing that the most massive black holes in the universe can create their own meals. Data from NASA’s Chandra X-ray Observatory and the Very Large Telescope (VLT) provide new evidence that outbursts from black holes can help cool down gas to feed themselves.

This study was based on observations of seven clusters of galaxies. The centers of galaxy clusters contain the universe’s most massive galaxies, which harbor huge black holes with masses ranging from millions to tens of billions of times that of the Sun. Jets from these black holes are driven by the black holes feasting on gas.

These images show two of the galaxy clusters in the study, the Perseus Cluster and the Centaurus Cluster. Chandra data represented in blue reveals X-rays from filaments of hot gas, and data from the VLT, an optical telescope in Chile, shows cooler filaments in red.

The results support a model where outbursts from the black holes trigger hot gas to cool and form narrow filaments of warm gas. Turbulence in the gas also plays an important role in this triggering process.

According to this model, some of the warm gas in these filaments should then flow into the centers of the galaxies to feed the black holes, causing an outburst. The outburst causes more gas to cool and feed the black holes, leading to further outbursts.

This model predicts there will be a relationship between the brightness of filaments of hot and warm gas in the centers of galaxy clusters. More specifically, in regions where the hot gas is brighter, the warm gas should also be brighter. The team of astronomers has, for the first time, discovered such a relationship, giving critical support for the model.

This result also provides new understanding of these gas-filled filaments, which are important not just for feeding black holes but also for causing new stars to form. This advance was made possible by an innovative technique that isolates the hot filaments in the Chandra X-ray data from other structures, including large cavities in the hot gas created by the black hole’s jets.

The newly found relationship for these filaments shows remarkable similarity to the one found in the tails of jellyfish galaxies, which have had gas stripped away from them as they travel through surrounding gas, forming long tails. This similarity reveals an unexpected cosmic connection between the two objects and implies a similar process is occurring in these objects.

This work was led by Valeria Olivares from the University of Santiago de Chile, and was published Monday in Nature Astronomy and is available online. The study brought together international experts in optical and X-ray observations and simulations from the United States, Chile, Australia, Canada, and Italy. The work relied on the capabilities of the MUSE (Multi Unit Spectroscopic Explorer) instrument on the VLT, which generates 3D views of the universe.

NASA's Marshall Space Flight Center in Huntsville, Alabama, manages the Chandra program. The Smithsonian Astrophysical Observatory's Chandra X-ray Center controls science operations from Cambridge, Massachusetts, and flight operations from Burlington, Massachusetts.


Visual Description:

This release features composite images shown side-by-side of two different galaxy clusters, each with a central black hole surrounded by patches and filaments of gas. The galaxy clusters, known as Perseus and Centaurus, are two of seven galaxy clusters observed as part of an international study led by the University of Santiago de Chile.

In each image, a patch of purple with neon pink veins floats in the blackness of space, surrounded by flecks of light. At the center of each patch is a glowing, bright white dot. The bright white dots are black holes. The purple patches represent hot X-ray gas, and the neon pink veins represent filaments of warm gas. According to the model published in the study, jets from the black holes impact the hot X-ray gas. This gas cools into warm filaments, with some warm gas flowing back into the black hole. The return flow of warm gas causes jets to again cool the hot gas, triggering the cycle once again.

While the images of the two galaxy clusters are broadly similar, there are significant visual differences. In the image of the Perseus Cluster on the left, the surrounding flecks of light are larger and brighter, making the individual galaxies they represent easier to discern. Here, the purple gas has a blue tint, and the hot pink filaments appear solid, as if rendered with quivering strokes of a paintbrush. In the image of the Centaurus Cluster on the right, the purple gas appears softer, with a more diffuse quality. The filaments are rendered in more detail, with feathery edges, and gradation in color ranging from pale pink to neon red.


Fast Facts for Perseus Cluster:

Credit: X-ray: NASA/CXC/SAO/V. Olivares et al.; Optical/IR: DSS; H-alpha: CFHT/SITELLE; Image Processing: NASA/CXC/SAO/N. Wolk
Scale: Image is about 6.4 arcmin (450,000 light-years) across.
Category: Groups and Clusters of Galaxies
Coordinates (J2000): RA 3h 19m 47.71 | Dec +41° 31´ 15.8"
Constellation: Perseus
Observation Dates: 29 observations between Sep 20, 1999 and Nov 7, 2016
Observation Time: 416 hours 45 minutes (17 days 8 hours 45 minutes)
Obs. ID: 428, 502, 503, 3209, 3404, 1513, 4289, 4946, 4947, 3939-4953, 6139, 6145, 6146, 11713-11716, 12025, 12033, 12036, 12037, 19568, 19913-19915

Instrument: ACIS
References: Olivares, V. et al. 2025, Nature Astronomy; arXiv:2501.01902
Color Code: X-ray: blue; Optical: red, green, blue; H-alpha: red
Distance Estimate: About 240 million light-years from Earth


Fast Facts for Centaurus Cluster:

Credit: X-ray: NASA/CXC/SAO/V. Olivaresi et al.; Optical/IR: NASA/ESA/STScI; H-alpha: ESO/VLT/MUSE; Image Processing: NASA/CXC/SAO/N. Wolk
Scale: Image is about 1.4 arcmin (57,000 light-years) across.
Category: Groups and Clusters of Galaxies
Coordinates (J2000): RA 12h 48m 49.2s | Dec -41° 18´ 43.8"
Constellation: Centaurus
Observation Dates: 16 observations from May 22, 2000 to Jun 05, 2014
Observation Time: 240 hours 1 minute (10 days 1 minutes)
Obs. ID: 504 ,505 ,1560 ,4190, 4191, 4954, 4955 ,5310, 16223-16225 ,16534 ,16607-16610
Instrument: ACIS
References: Olivares, V. et al. 2025, Nature Astronomy; arXiv:2501.01902
Color Code: X-ray: blue; Optical/IR: red, green, blue; H-alpha: red
Distance Estimate: About 145 million light-years from Earth


Thursday, January 09, 2025

A Treasure Trove of Unseen Stars Seen Beyond the 'Dragon Arc'

Abell 370, a galaxy cluster located nearly 4 billion light-years away from Earth features several arcs of light, including the "Dragon Arc" (lower left of center). These arcs are caused by gravitational lensing: Light from distant galaxies far behind the massive galaxy cluster coming toward Earth is bent around Abell 370 by its massive gravity, resulting in contorted images.  Credit: NASA.High Resolution Image

The massive, yet invisible halo of dark matter of a galaxy cluster works as a "macrolens,", while lone, unbound stars drifting through the cluster act as additional "microlenses, multiplying the factor of magnification.  Credit: Yoshinobu Fudamoto. High Resolution Image

In this zoomed-in detail of the Hubble image of Abell 370, the host galaxy where the 44 stars were discovered appears several times: in a normal image (left), and a distorted image appearing as a drawn-out smear of light.  Credit: NASA. High Resolution Image


An international team of astronomers took pictures of more than 40 individual stars in a galaxy so far away its light dates back to when the universe was only half its present age.

Cambridge, MA — Looking halfway across the observable universe and expecting to see individual stars is considered a non-starter in astronomy, a bit like raising a pair of binoculars at the moon in hopes of making out individual grains of dust inside its craters. Thanks to a cosmic quirk of nature, however, an international team of astronomers did just that.

Using NASA's James Webb Space Telescope (JWST), postdoctoral researcher Fengwu Sun at the Center for Astrophysics | Harvard & Smithsonian (CfA) and his team observed a galaxy nearly 6.5 billion light-years from Earth, at a time when the universe was half its current age. In this distant galaxy, the team identified 44 individual stars, made visible thanks to an effect known as gravitational lensing and JWST's high light collecting power.

Published in the journal Nature Astronomy, the discovery marks this record-breaking achievement – the largest number of individual stars detected in the distant universe. It also provides a way to investigate one of the universe's greatest mysteries – dark matter.

"This groundbreaking discovery demonstrates, for the first time, that studying large numbers of individual stars in a distant galaxy is possible," Sun, a co-author on the study, said. “While previous studies with the Hubble Space Telescope found around seven stars, we now have the capability to resolve stars that were previously outside of our capability. Importantly, observing more individual stars will also help us better understand dark matter in the lensing plane of these galaxies and stars, which we couldn’t do with only the handful of individual stars observed previously."

CfA's Sun found this treasure trove of stars while inspecting JWST images of a galaxy known as the Dragon Arc, located along the line of sight from Earth behind a massive cluster of galaxies called Abell 370. Due to its gravitational lensing effect, Abell 370 stretches the Dragon Arc's signature spiral into an elongated shape – like a hall of mirrors of cosmic proportions.

The research team carefully analyzed colors of each of the stars inside the Dragon Arc and found that many are red supergiants, similar to Betelgeuse in the constellation of Orion, which is in the final stages of its life. This contrasts with earlier discoveries, which predominantly identified blue "supergiants" similar to Rigel and Deneb, which are among the brightest stars in the night sky. According to the researchers, this difference in stellar types also highlights the unique power of JWST observations at infrared wavelengths that could reveal stars at lower temperatures.

"When we discovered these individual stars, we were actually looking for a background galaxy that is lensing-magnified by the galaxies in this massive cluster,” said Sun. “But when we processed the data, we realized that there were what appeared to be a lot of individual star points. It was an exciting find because it was the first time we were able to see so many individual stars so far away."

Sun, in particular, is excited for the next opportunity to study these red supergiants. "We know more about red supergiants in our local galactic neighborhood because they are closer and we can take better images and spectra, and sometimes even resolve the stars. We can use the knowledge we’ve gained from studying red supergiants in the local universe to interpret what happens next for them at such an early epoch of galaxy formation in future studies."

Most galaxies, including the Milky Way, contain tens of billions of stars. In nearby galaxies such as the Andromeda galaxy, astronomers can observe stars one by one. However, in galaxies billions of light-years away, stars appear blended together as their light needs to travel for billions of light-years before it reaches us, presenting a long-standing challenge to scientists studying how galaxies form and evolve.

"To us, galaxies that are very far away usually look like a diffuse, fuzzy blob," said lead study author Yoshinobu Fudamoto, an assistant professor at Chiba University in Japan. "But actually, those blobs consist of many, many individual stars. We just can't resolve them with our telescopes."

Recent advances in astronomy have opened new possibilities by leveraging gravitational lensing – a natural magnification effect caused by the strong gravitational fields of massive objects. As predicted by Albert Einstein, gravitational lenses can amplify the light of distant stars by factors of hundreds or even thousands, making them detectable with sensitive instruments like JWST.

"These findings have typically been limited to just one or two stars per galaxy," Fudamoto said. "To study stellar populations in a statistically meaningful way, we need many more observations of individual stars."

Future JWST observations are expected to capture more magnified stars in the Dragon Arc galaxy. These efforts could lead to detailed studies of hundreds of stars in distant galaxies. Moreover, observations of individual stars could provide insight into the structure of gravitational lenses and even shed light on the elusive nature of dark matter.


About the Center for Astrophysics | Harvard & Smithsonian

The Center for Astrophysics | Harvard & Smithsonian is a collaboration between Harvard and the Smithsonian designed to ask—and ultimately answer—humanity's greatest unresolved questions about the nature of the universe. The Center for Astrophysics is headquartered in Cambridge, MA, with research facilities across the U.S. and around the world.


Resource

Y. Fudamoto, F. Sun, et al, "More than Forty Gravitationally Magnified Stars in a Galaxy at Redshift of 0.725," Nature Astronomy., doi: 10.1038/s41550-024-02432-3


Media Contact:

Amy C. Oliver
Public Affairs Officer, Fred Lawrence Whipple Observatory
Center for Astrophysics | Harvard & Smithsonian

amy.oliver@cfa.harvard.edu


Tuesday, October 22, 2024

Zoom into the first page of Euclid’s great cosmic atlas

This mosaic made by ESA’s Euclid space telescope contains 260 observations collected between 25 March and 8 April 2024. This is 1% of the comprehensive survey that Euclid will capture during six years. In just two weeks, Euclid covered 132 square degrees of the Southern Sky, more than 500 times the area of the full Moon as seen from Earth. The mosaic is 208 gigapixel.
© ESA/Euclid/Euclid Consortium/NASA, CEA Paris-Saclay, image processing by J.-C. Cuillandre, E. Bertin, G. Anselmi (CC BY-SA 3.0 IGO)

This graphic provides an overview of the mosaic and zoomed-in images released by ESA’s Euclid mission on 15 October 2024. On the top left, an all-sky map (41 000 square degrees) is visible with the location of Euclid’s mosaic on the Southern Sky highlighted in yellow. The mosaic contains 260 observations made between 25 March and 8 April 2024. In just two weeks, Euclid covered 132 square degrees of the Southern Sky, more than 500 times the area of the full Moon as seen from Earth. On the top right, Euclid’s field-of-view in one observation is compared to the area of the full Moon. The mosaic shows the locations of the various zoomed-in images. Above the separate images, the zoom factor is given (from 3 to 600 times enlarged compared to the original mosaic). ©
ESA/Euclid/Euclid Consortium/NASA, CEA Paris-Saclay, image processing by J.-C. Cuillandre, E. Bertin, G. Anselmi; ESA/Gaia/DPAC; ESA/Planck Collaboration (CC BY-SA 3.0 IGO)
T
his image shows an area of the mosaic released by ESA’s Euclid space telescope on 15 October 2024. The area is zoomed in twelve times compared to the large mosaic. In the middle left, spiral galaxy NGC 2188 is visible edge-on at a distance of 25 million light-years. In the top right corner, galaxy cluster Abell 3381 is now clearly noticeable, 678 million light-years away from us. ©
ESA/Euclid/Euclid Consortium/NASA, CEA Paris-Saclay, image processing by J.-C. Cuillandre, E. Bertin, G. Anselmi (CC BY-SA 3.0 IGO)

This image shows an area of the mosaic released by ESA’s Euclid space telescope on 15 October 2024. The area is zoomed in 36 times compared to the large mosaic. In this image, the core of galaxy cluster Abell 3381 is visible, 678 million light-years away from us. The image shows many different galaxies of various shapes and sizes, from massive elliptical to modest spiral galaxies, down to tiny and dim dwarf galaxies. © ESA/Euclid/Euclid Consortium/NASA, CEA Paris-Saclay, image processing by J.-C. Cuillandre, E. Bertin, G. Anselmi (CC BY-SA 3.0 IGO)

This image shows an area of the mosaic released by ESA’s Euclid space telescope on 15 October 2024. The area is zoomed in 150 times compared to the large mosaic. On the left of the image, Euclid captured two galaxies (called ESO 364-G035 and G036) interacting with each other, 420 million light-years from us. On the right of the image, galaxy cluster Abell 3381 is visible, 678 million light-years away from us. ©
ESA/Euclid/Euclid Consortium/NASA, CEA Paris-Saclay, image processing by J.-C. Cuillandre, E. Bertin, G. Anselmi (CC BY-SA 3.0 IGO)


Euclid reveals the first deep view into the cosmos, spanning an area of 500 full moons in the sky.


On October 15, 2024, the ESA Euclid space mission will unveil the first piece of its massive map of the universe, showing millions of stars and galaxies. The captured strip across the sky demonstrates the stunning data quality at all levels, from panoramic views of the universe to the details of structures inside individual galaxies. The Max Planck Institute for Extraterrestrial Physics (MPE) is also playing a key role in Euclid and is, as well everyone involved in science and technology, delighted with the results.

The first part of the final map, which is a very large mosaic of 208 gigapixels, is revealed today at the International Astronautical Congress in Milan, Italy, by ESA’s Director General Josef Aschbacher and Director of Science Carole Mundell.

The mosaic contains 260 observations made between 25 March and 8 April 2024. In just two weeks, Euclid covered 132 square degrees of the Southern Sky in pristine detail, more than 500 times the area of the full Moon.

“Euclid has turned its keen eye to the sky and is working through its observation programme. Scientists and engineers are happy to be able to reap the rewards of 15 years of preparation,” says Frank Grupp. He is a physicist at the Max Planck Institute for Extraterrestrial Physics (MPE) in Garching and Ludwig Maximilian University (LMU) in Munich and the German project manager of Euclid.

This mosaic accounts for 1% of the wide survey that Euclid will capture over six years. During this survey, the telescope observes the shapes, distances and motions of billions of galaxies out to 10 billion light-years. Doing this will create the largest cosmic 3D map ever made.

This first piece of the map already contains some 14 million galaxies that could be used to study the hidden influence of dark matter and dark energy on the Universe. It also contains tens of millions of stars in our own Milky Way.

“This stunning image is the first piece of a map that will reveal more than one third of the sky in six years. This is just 1% of the map, and yet it is full of a variety of sources that will help scientists discover new ways to describe the Universe,” says Valeria Pettorino, Euclid Project Scientist at ESA.

The spacecraft’s sensitive cameras captured an incredible number of objects in great detail. Zooming very deep into the mosaic, we can still clearly see the intricate structure of a spiral galaxy.

A special feature visible in the mosaic is dim clouds between the stars in our galaxy; they appear in light blue against the black background of space. They are a mix of gas and dust, also called ‘galactic cirrus’ because they look like cirrus clouds. Euclid can see these clouds with its super sensitive visible light camera because they reflect optical light from the Milky Way. The clouds also shine in far-infrared light, as seen by ESA’s Planck mission.

The mosaic released today is a teaser for what’s to come from the Euclid mission. Since the mission started its routine science observations in February, 12% of the survey has been completed. The resulting images already deliver a glimpse of the challenge for the data collection and processing infrastructure. Never before has an astronomical space mission delivered so much data in such a short time – around 100 GB of images and spectra are sent to Earth every day. A central concern of the project is the daily processing of this data.

For this purpose, the Euclid consortium has set up a European network of nine data centres, including the German Science Data Center (SDC-DE), including 7,000 processors, which will handle 10% of the data. A team of six scientists and IT specialists develops algorithms and maintains the hardware.

“The constantly changing software and hardware presents our team with major challenges to assure the timely processing,” says Maximilian Fabricius (LMU and MPE), head of the SDC-DE. “However, we are proud of how well everything is now coming together and that we are now on track for processing for the first public data release.”

The release of 53 square degrees of the survey, including a preview of the Euclid Deep Field areas, is planned for March 2025. The mission’s first year of cosmology data will be released to the community in 2026.

The mosaic released by ESA Euclid space telescope accounts for 1% of the wide survey that Euclid will capture over six years. The location and actual size of the mosaic on the Southern Sky is shown in yellow. This all-sky view is an overlay of Gaia’s star map from its second data release in 2018 and Planck’s dust map from 2014. ©
ESA/Euclid/Euclid Consortium/NASA; ESA/Gaia/DPAC; ESA and the Planck Collaboration CC BY-SA 3.0 IGO

About Euclid

Euclid was launched in July 2023 and started its routine science observations on 14 February 2024. In November 2023 and May 2024, the world got its first glimpses of the quality of Euclid’s images.

Euclid is a European mission built and operated by the ESA, with contributions from NASA. The Euclid Consortium – consisting of more than 2000 scientists from 300 institutes in 15 European countries, the USA, Canada and Japan – is responsible for providing the scientific instruments, such as the VIS and NISP cameras, and scientific data analysis. ESA selected Thales Alenia Space as the prime contractor for constructing the satellite and its service module. Airbus Defence and Space was chosen to develop the payload module, including the telescope. NASA provided the detectors of the Near-Infrared Spectrometer and Photometer, NISP. Euclid is a medium-class mission in ESA’s Cosmic Vision Programme.

From Germany, the Max Planck Institute for Astronomy in Heidelberg, the Max Planck Institute for Extraterrestrial Physics in Garching, the Ludwig Maximilian University in Munich, the University of Bonn, the Ruhr University Bochum, the University of Bielefeld, and the German Space Agency at the German Aerospace Centre (DLR) in Bonn are participating in the Euclid project.

The German Space Agency at DLR coordinates the German ESA contributions and provides funding of 60 million euros from the National Space Programme for the participating German research institutes.

With around 21%, Germany is the most significant contributor to the ESA science programme.

This news item is based on the ESA press release, which is published at the same time.


Contacts:

Dr. Markus Nielbock
National coordinator for communication of the German research institutes of the Euclid Consortium
tel:+49 6221 528-134

pr@mpia.de Euclid Consortium
Max Planck Institute for Astronomy, Heidelberg, Germany

Prof. Dr. Ralf Bender
Director
tel:+49 89 30000-3702

bender@mpe.mpg.de
Ludwig Maximilian University Munich
Max Planck Institute for Extraterrestrial Physics, Garching, Germany

Prof. Dr. Hans-Walter Rix
Director
tel:+49 6221 528-210

rix@mpia.de
Max Planck Institute for Astronomy, Heidelberg, Germany

Dr. Frank Grupp
tel:+49 89 30000-3956

fgrupp@mpe.mpg.de
Ludwig Maximilian University Munich
Max Planck Institute for Extraterrestrial Physics, Garching, Germany


Links

Download: Download images here


Tuesday, October 08, 2024

SN H0pe

A two-panel image. In the left panel, dozens of small galaxies are scattered on the black background of space. Just to the left of the center, there is a long, red arc. At its left is a cluster of a few white galaxies that look like a glowing orb. To the right of the center, the red arc and glowing orb of galaxies at the left appear to be mirrored. The curved and distorted galaxy image on the right side is highlighted with a white box. Lines extend from the box’s corners to the right panel, which shows an enlarged view of the curved galaxy. Three faint points of light are circled. Credit: NASA, ESA, CSA, STScI, B. Frye (University of Arizona), R. Windhorst (Arizona State University), S. Cohen (Arizona State University), J. D’Silva (University of Western Australia, Perth), A. Koekemoer (Space Telescope Science Institute), J. Summers (Arizona State University).


Webb researchers discover lensed supernova, confirm Hubble Tension

Measuring the Hubble constant, the rate at which the Universe is expanding, is an active area of research among astronomers around the world who analyze data from both ground- and space-based observatories. The NASA/ESA/CSA James Webb Space Telescope has already contributed to this ongoing discussion. Earlier this year, astronomers used Webb data containing Cepheid variables and Type Ia supernovae, reliable distance markers to measure the Universe’s expansion rate, to confirm the NASA/ESA Hubble Space Telescope’s previous measurements.

Now, researchers are using an independent method of measurement to further improve the precision of the Hubble constant — gravitationally lensed supernovae. Researchers from different institutions around the world are leading this effort after Webb’s discovery of three points of light in the direction of a distant and densely populated cluster of galaxies.

This is an image from Webb’s NIRCam (Near-Infrared Camera) of the galaxy cluster PLCK G165.7+67.0, also known as G165, on the left shows the magnifying effect a foreground cluster can have on the distant Universe beyond. The foreground cluster is 3.6 billion light-years away from Earth. The zoomed region on the right shows the supernova H0pe triply imaged (labeled with white dashed circles) due to gravitational lensing. 

This field was selected for observation due to its high rate of star formation of more than 300 solar masses per year, an attribute that correlates with higher supernova rates. SN H0pe is one of the most distant Type Ia supernovae observed to date. The measured Hubble constant value matches other measurements in the local Universe, and is somewhat in tension with values obtained when the Universe was young. Future Webb observations in Cycle 3 will improve on the uncertainties.

In this image blue represents light at 0.9, 1.15, and 1.5 microns (F090W + F115W + F150W), green is 2.0 and 2.77 microns (F200W + F277W), and red is 3.56, 4.1, and 4.44 microns (F356W + F410M + F444W).

Note: This post highlights data from Webb science in progress, which has not yet been through the peer-review process.

Links


Thursday, September 26, 2024

NASA's Chandra Finds Galaxy Cluster That Crosses the Streams

 
Zwicky 8338
Credit X-ray: NASA/CXC/Xiamen Univ./C. Ge; Optical: DESI collaboration; Image Processing: NASA/CXC/SAO/N. Wolk


Astronomers using NASA’s Chandra X-ray Observatory have found a galaxy cluster has two streams of superheated gas crossing one another. This result shows that crossing the streams may lead to the creation of new structure.

Researchers have discovered an enormous, comet-like tail of hot gas — spanning over 1.6 million light-years long — trailing behind a galaxy within the galaxy cluster called Zwicky 8338 (Z8338 for short). This tail, spawned as the galaxy had some of its gas stripped off by the hot gas it is hurtling through, has split into two streams.

This is the second pair of tails trailing behind a galaxy in this system. Previously, astronomers discovered a shorter pair of tails from a different galaxy near this latest one. This newer and longer set of tails was only seen because of a deeper observation with Chandra that revealed the fainter X-rays.

Tails in Zwicky 8338
Credit: X-ray: NASA/CXC/Xiamen Univ./C. Ge; Optical: DESI collaboration; 
Image Processing: NASA/CXC/SAO/N. Wolk)

Astronomers now have evidence that these streams trailing behind the speeding galaxies have crossed one another. Z8338 is a chaotic landscape of galaxies, superheated gas, and shock waves (akin to sonic booms created by supersonic jets) in one relatively small region of space. These galaxies are in motion because they were part of two galaxy clusters that collided with each other to create Z8338.

This new composite image shows this spectacle. X-rays from Chandra (represented in purple) outline the multimillion-degree gas that outweighs all of the galaxies in the cluster. The Chandra data also shows where this gas has been jettisoned behind the moving galaxies. Meanwhile an optical image from the Dark Energy Survey from the Cerro Tololo Inter-American Observatory in Chile shows the individual galaxies peppered throughout the same field of view.

The original gas tail discovered in Z8338 is about 800,000 light-years long and is seen as vertical in this image (see the labeled version). The researchers think the gas in this tail is being stripped away from a large galaxy as it travels through the galaxy cluster. The head of the tail is a cloud of relatively cool gas about 100,000 light-years away from the galaxy it was stripped from. This tail is also separated into two parts.

The team proposes that the detachment of the tail from the large galaxy may have been caused by the passage of the other, longer tail. Under this scenario, the tail detached from the galaxy because of the crossing of the streams.

The results give useful information about the detachment and destruction of clouds of cooler gas like those seen in the head of the detached tail. This work shows that the cloud can survive for at least 30 million years after it is detached. During that time, a new generation of stars and planets may form within it.

The Z8338 galaxy cluster and its jumble of galactic streams are located about 670 million light-years from Earth. A paper describing these results appeared in the Aug. 8, 2023, issue of the Monthly Notices of the Royal Astronomical Society and is available online at: https://academic.oup.com/mnras/article/525/1/1365/7239302.

NASA's Marshall Space Flight Center manages the Chandra program. The Smithsonian Astrophysical Observatory's Chandra X-ray Center controls science operations from Cambridge, Massachusetts, and flight operations from Burlington, Massachusetts.


Visual Description:

This release features a composite image of two pairs of hot gas tails found inside a single galaxy cluster. The image is presented both labeled and unlabeled, with color-coded ovals encircling the hot gas tails.

In both the labeled and unlabeled versions of the image, mottled purple gas speckles a region of space dotted with distant flecks of red and white. Also present in this region of space are several glowing golden dots. These dots are individual galaxies that together form the cluster Zwicky 8338.

To our right of center is a glowing golden galaxy with a mottled V shaped cloud of purple above it. Yellow labels identify the two arms of the V as tails trailing behind the hurtling galaxy below.

To our left of center is another golden galaxy, this one surrounded by purple gas. Behind it, opening toward our right in the shape of a widening V lying on its side, are two more mottled purple clouds. Labeled in white, these newly-discovered gas tails are even larger than the previously discovered tails labeled in yellow. These tails, which overlap with the galaxy on our right, are over 1.6 million light-years long.


Fast Facts for Zwicky 8338:

Scale: Image is about 20 arcmin (3.8 million light-years) across.
Category:Groups & Clusters of Galaxies, Normal Galaxies & Starburst Galaxies
Coordinates (J2000): RA 18h 11m 01.6s | Dec +49° 54´ 42.2"
Constellation: Hercules
Observation Dates: 3 observations from Jan 04 2013 to Dec 27 2016
Observation Time: 19 hours 20 minutes
Obs. ID: 15163, 18281, 19978
Instrument: ACIS
References: Ge, C. et al, 2023, MNRAS, 525, 1365; arXiv:2308.00328
Color Code: X-ray: purple; Optical: red, green, and blue.
Distance Estimate: About 670 million light-years


Thursday, September 05, 2024

NASA's Webb Reveals Distorted Galaxy Forming Cosmic Question Mark

The galaxy cluster MACS-J0417.5-1154 is so massive it is warping the fabric of space-time and distorting the appearance of galaxies behind it, an effect known as gravitational lensing. This natural phenomenon magnifies distant galaxies and can also make them appear in an image multiple times, as NASA’s James Webb Space Telescope saw here. Two distant, interacting galaxies — a face-on spiral and a dusty red galaxy seen from the side — appear multiple times, tracing a familiar shape across the sky. Active star formation, and the face-on galaxy’s remarkably intact spiral shape, indicate that these galaxies’ interaction is just beginning. Credits: Image: NASA, ESA, CSA, STScI, Vicente Estrada-Carpenter (Saint Mary's University)
See a side-by-side comparison of how the Hubble Space Telescope and Webb each viewed this same region of space:
https://webbtelescope.org/contents/media/images/2024/128/01J6CXQZWPPN3NHPJQYY4WZG1R.

A cosmic question mark appears amid a powerful gravitational lens in the James Webb Space Telescope’s wide-field view of the galaxy cluster MACS-J0417.5-1154. Gravitational lensing occurs when something is so massive, like this galaxy cluster, that it warps the fabric of space-time itself, creating a natural funhouse-mirror effect that also magnifies galaxies behind it.

The rarely seen type of lensing captured here, which astronomers term hyperbolic umbilic, created five repeated images of one galaxy pair. The red, elongated member of this pair traces the familiar shape of a question mark across the sky due to the distortion, with another unrelated galaxy happening to be in just the right space-time to appear like the question mark’s dot – especially for humans who love to recognize familiar shapes and patterns. Credits: Image: NASA, ESA, CSA, STScI, Vicente Estrada-Carpenter (Saint Mary's University)

See more detail in the question mark galaxy here and see the repeated images of the galaxies labeled here.

NASA’s Hubble Space Telescope has also observed the galaxy cluster MACS-J0417.5-1154, but the dusty red galaxy that appears multiple times to form a question mark shape is much more prominent in the Webb image. The infrared light that Webb detects is better able to pass through the cosmic dust of its home galaxy to reach the telescope. Astronomers used Hubble’s ultraviolet observations to help determine where star formation is happening in both the red galaxy and its close companion, a face-on spiral galaxy. Credits: Image: NASA, ESA, CSA, STScI, Vicente Estrada-Carpenter (Saint Mary's University)


It’s 7 billion years ago, and the universe’s heyday of star formation is beginning to slow. What might our Milky Way galaxy have looked like at that time? Astronomers using NASA’s James Webb Space Telescope have found clues in the form of a cosmic question mark, the result of a rare alignment across light-years of space.

We know of only three or four occurrences of similar gravitational lens configurations in the observable universe, which makes this find exciting, as it demonstrates the power of Webb and suggests maybe now we will find more of these,” said astronomer Guillaume Desprez of Saint Mary’s University in Halifax, Nova Scotia, a member of the team presenting the Webb results.

While this region has been observed previously with NASA’s Hubble Space Telescope, the dusty red galaxy that forms the intriguing question-mark shape only came into view with Webb. This is a result of the wavelengths of light that Hubble detects getting trapped in cosmic dust, while longer wavelengths of infrared light are able to pass through and be detected by Webb’s instruments.

Astronomers used both telescopes to observe the galaxy cluster MACS-J0417.5-1154, which acts like a magnifying glass because the cluster is so massive it warps the fabric of space-time. This allows astronomers to see enhanced detail in much more distant galaxies behind the cluster. However, the same gravitational effects that magnify the galaxies also cause distortion, resulting in galaxies that appear smeared across the sky in arcs and even appear multiple times. These optical illusions in space are called gravitational lensing.

The red galaxy revealed by Webb, along with a spiral galaxy it is interacting with that was previously detected by Hubble, are being magnified and distorted in an unusual way, which requires a particular, rare alignment between the distant galaxies, the lens, and the observer — something astronomers call a hyperbolic umbilic gravitational lens. This accounts for the five images of the galaxy pair seen in Webb’s image, four of which trace the top of the question mark. The dot of the question mark is an unrelated galaxy that happens to be in the right place and space-time, from our perspective.

In addition to producing a case study of the Webb NIRISS (Near-Infrared Imager and Slitless Spectrograph) instrument’s ability to detect star formation locations within a galaxy billions of light-years away, the research team also couldn’t resist highlighting the question mark shape. “This is just cool looking. Amazing images like this are why I got into astronomy when I was young,” said astronomer Marcin Sawicki of Saint Mary’s University, one of the lead researchers on the team. “Knowing when, where, and how star formation occurs within galaxies is crucial to understanding how galaxies have evolved over the history of the universe,” said astronomer Vicente Estrada-Carpenter of Saint Mary’s University, who used both Hubble’s ultraviolet and Webb’s infrared data to show where new stars are forming in the galaxies. The results show that star formation is widespread in both. The spectral data also confirmed that the newfound dusty galaxy is located at the same distance as the face-on spiral galaxy, and they are likely beginning to interact.

“Both galaxies in the Question Mark Pair show active star formation in several compact regions, likely a result of gas from the two galaxies colliding,” said Estrada-Carpenter. “However, neither galaxy’s shape appears too disrupted, so we are probably seeing the beginning of their interaction with each other.”

“These galaxies, seen billions of years ago when star formation was at its peak, are similar to the mass that the Milky Way galaxy would have been at that time. Webb is allowing us to study what the teenage years of our own galaxy would have been like,” said Sawicki.

The Webb images and spectra in this research came from the Canadian NIRISS Unbiased Cluster Survey (CANUCS). The research paper is published in the Monthly Notices of the Royal Astronomical Society.

The James Webb Space Telescope is the world’s premier space science observatory. Webb is solving mysteries in our solar system, looking beyond to distant worlds around other stars, and probing the mysterious structures and origins of our universe and our place in it. Webb is an international program led by NASA with its partners, ESA (European Space Agency) and CSA (Canadian Space Agency).


About This Release

Credits:

Media Contact:

Leah Ramsay
Space Telescope Science Institute, Baltimore, Maryland

Christine Pulliam
Space Telescope Science Institute, Baltimore, Maryland

Permissions: Content Use Policy

Contact Us: Direct inquiries to the News Team.

Related Links and Documents


Sunday, July 21, 2024

Jellyfish Galaxy (JO204)


Detail: This galaxy located in the Sextans constellation is not interacting with another galaxy through mutual gravitation like the Jellyfish Galaxy posted on July 4, 2024.

Intergalactic hot gas fills the spaces between galaxies in a galaxy cluster. When a galaxy moves through this intergalactic gas, it experiences intense pressure, causing the gas within the galaxy to be stripped away. The galaxy's blueish jellyfish tentacle-like structure is thought to have formed when its disk gas was stripped away in this manner. Credit: NAOJ

Distance from Earth: 600 million light-years
Instrument: Hyper Suprime-Cam (HSC)


Thursday, July 11, 2024

Signs of the First Stars in a Distant Galaxy

An artist's impression of the first stars in the universe going supernova.
Credit:
NAOJ, CC BY 4.0

JWST image of the galaxy RX J2129–z8He II, which is gravitationally lensed by the foreground galaxy cluster RX J2129. Credit: Wang et al. 2024

The galaxy RX J2129–z8He II is remarkable for its high redshift, sloped spectrum, and strong emission lines. New research suggests that the elusive first stars could be responsible for the galaxy’s properties.

The Hunt for the First Stars

Long ago, the universe was substantially less picturesque than it is today; neutral hydrogen gas absorbed all visible light and rendered the universe opaque. When the first stars glimmered into existence and assembled into the first galaxies, they began to chip away at the opaque universe, carving out increasingly large bubbles of transparent gas. The nature of the first stars, also called Population III stars, is of great interest to astronomers, but tracking them down is easier said than done. While galaxies composed only of the first generation of stars may be out of reach, shielded from view by clouds of neutral gas, galaxies in which Population III stars mingle with later stellar generations might be easier to spot.

Thirteen Billion Years Ago in a Galaxy Far, Far Away

Recently, a research team led by Xin Wang (University of Chinese Academy of Sciences) may have identified such a galaxy. Using images from JWST, Wang and collaborators picked out the galaxy RX J2129–z8He II, which even in the eyes of the world’s most powerful infrared telescope is a barely discernible red smudge. JWST spectra of this galaxy place it at a redshift of z = 8.1623, just 613 million years after the Big Bang. At this time, stars and galaxies were still busily ionizing the universe, transforming it from opaque to transparent.

RX J2129–z8He II’s spectrum is tilted sharply toward short wavelengths, more so than any other known galaxy beyond a redshift of z = 7, and it’s marked by several prominent emission lines, including one from singly ionized helium atoms. These factors suggest that the galaxy contains a powerful source of ultraviolet radiation. In the local universe, emission from singly ionized helium is somewhat rare, arising from massive stars that have lost their atmospheres, binary systems containing a star and either a black hole or a neutron star, and galaxies with accreting supermassive black holes. None of these sources are likely to be the cause of the galaxy’s helium emission line. Instead, Wang’s team posits, massive Population III stars could be the source of the ionizing ultraviolet photons.

JWST spectrum of RX J2129–z8He II, with an inset image showing the He II line. The flux increases toward shorter wavelengths before being attenuated by the intergalactic medium (IGM). Credit: Wang et al. 2024

Are Population III Stars Responsible?

To test this theory, Wang’s team used photoionization models to simulate the properties of a galaxy containing Population III stars as well as stars from later generations. They found that a collection of Population III stars with a total mass of 780,000 solar masses could reproduce the observed emission lines in the galaxy’s spectrum. Previous modeling suggests that this quantity of Population III stars is reasonable for a galaxy at that time period.

As for how a galaxy could host Population III stars alongside their stellar descendants, Wang’s team suggests that new Population III stars could form belatedly in pockets of pristine gas that weren’t swept up into stars in the first round of star formation, or in gas that spilled into the galaxy from the surrounding circumgalactic medium. This study marks a promising advance in the search for the first generation of stars. In addition to identifying RX J2129–z8He II as a possible home for Population III stars, Wang’s team gained a better sense for the spectral signatures of these stars, which can be used to identify other galaxies that may host them.

By Kerry Hensley

Citation

“A Strong He II λ1640 Emitter with an Extremely Blue UV Spectral Slope at z = 8.16: Presence of Population III Stars?” Xin Wang et al 2024 ApJL 967 L42. doi:10.3847/2041-8213/ad4ced


Sunday, June 23, 2024

Seeing Triple

SN H0pe

What at first appears to be a glowing strand of molten iron in the image above is something far wilder: a distant galaxy whose light has been stretched into galactic taffy by the immense gravity of an intervening galaxy cluster. This phenomenon, known as strong gravitational lensing, multiplies and magnifies images of faraway sources, allowing astronomers to use massive objects like galaxy clusters as natural telescopes. Look closely at the zoomed-in version of the image: three points of light stand out against the glow of the lensed galaxy. These three dots are multiple images of a single supernova cataloged as SN H0pe. Researchers plan to use this rare multiply imaged supernova to calculate the Hubble constant, which quantifies the universe’s expansion rate. Using observations from JWST, a team led by Justin Pierel (Space Telescope Science Institute) calculated the time delay of the light from the images, finding arrival times offset by 49 and 117 days. The value of the Hubble constant derived from these observations will be reported in a future publication. In the meantime, be sure to check out the details of these initial calculations in the article linked below.

Citation

“JWST Photometric Time-Delay and Magnification Measurements for the Triply Imaged Type Ia “SN H0pe” at z = 1.78,” J. D. R. Pierel et al 2024 ApJ 967 50. doi:10.3847/1538-4357/ad3c43


Thursday, May 23, 2024

Spotted — "Death Star" Black Holes in Action

Abell 478 - NGC 5044
Credit: X-ray: NASA/CXC/Univ. of Bologna/F. Ubertosi; Image Processing: NASA/CXC/SAO/N. Wolk


A team of astronomers have studied 16 supermassive black holes that are firing powerful beams into space, to track where these beams, or jets, are pointing now and where they were aimed in the past, as reported in our latest press release. Using NASA’s Chandra X-ray Observatory and the U.S. National Science Foundation (NSF) National Radio Astronomical Observatory’s (NRAO) Very Large Baseline Array (VLBA), they found that some of the beams have changed directions by large amounts.

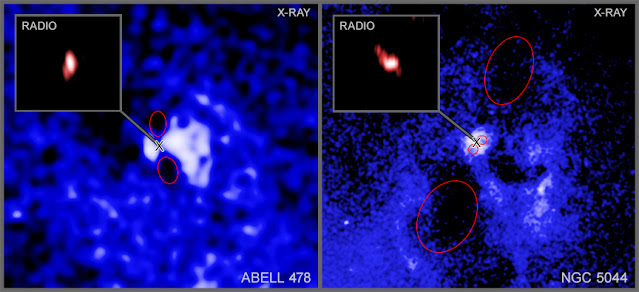
These two Chandra images show hot gas in the middle of the galaxy cluster Abell 478 (left) and the galaxy group NGC 5044 (right). The center of each image contains one of the sixteen black holes firing beams outwards. Each black hole is in the center of a galaxy embedded in the hot gas.

By mousing over the images, labels and the radio images appear. Ellipses show a pair of cavities in the hot gas for Abell 478 (left) and ellipses show two pairs of cavities for NGC 5044 (right). These cavities were carved out by the beams millions of years ago, giving the directions of the beams in the past. An X shows the location of each supermassive black hole.

Abell 478 and NGC 5044 (Labeled). Credit: X-ray: NASA/CXC/Univ. of Bologna/F. Ubertosi; Insets Radio: NSF/NRAO/VLBA; Wide field Image: Optical/IR: Univ. of Hawaii/Pan-STARRS; Image Processing: NASA/CXC/SAO/N. Wolk

The VLBA images are shown as insets, which reveal where the beams are currently pointing, as seen from Earth. The radio images are both much smaller than the X-ray images. For Abell 478 the radio image is about 3% of the width of the Chandra image and for NGC 5044 the radio image is about 4% of the Chandra image’s width.

A comparison between the Chandra and VLBA images shows that the beams for Abell 478 changed direction by about 35 degrees and the beams for NGC 5044 changed direction by about 70 degrees.

Across the entire sample the researchers found that about a third of the 16 galaxies have beams that are pointing in completely different directions than they were before. Some have changed directions by nearly 90 degrees in some cases, and over timescales between one million years and a few tens of millions of years. Given that the black holes are of the order of 10 billion years old, this represents a relatively rapid change for these galaxies.

Wide Field Views of Abell 478 [Left] and NGC 5044 [Right]. Credit: X-ray: NASA/CXC/Univ. of Bologna/F. Ubertosi et al.; Optical/IR: Univ. of Hawaii/Pan-STARRS; IR: NASA/ESA/JPL/CalTech/Herschel Space Telescope

Black holes generate beams when material falls onto them via a spinning disk of matter and some of it then gets redirected outward. The direction of the beams from each of these giant black holes, which are likely spinning, is thought to align with the rotation axis of the black hole, meaning that the beams point along a line connecting the poles.

These beams are thought to be perpendicular to the disk. If material falls towards the black holes at a different angle that is not parallel to the disk, it could affect the direction of the black hole’s rotation axes, changing the direction of the beams.

Scientists think that beams from black holes and the cavities they carve out play an important role in how many stars form in their galaxies. The beams pump energy into the hot gas in and around the galaxy, preventing it from cooling down enough to form huge numbers of new stars. If the beams change directions by large amounts, they can tamp down star formation across much larger areas of the galaxy.

The paper describing these results was published in the January 20th, 2024 issue of The Astrophysical Journal, and is available here. The authors are Francesco Ubertosi (University of Bologna in Italy), Gerritt Schellenberger (Center for Astrophysics | Harvard & Smithsonian), Ewan O’Sullivan (CfA), Jan Vrtilek (CfA), Simona Giacintucci (Naval Research Laboratory), Laurence David (CfA), William Forman (CfA), Myriam Gitti (University of Bologna), Tiziana Venturi (National Institute of Astrophysics—Institute of Radio Astronomy in Italy), Christine Jones (CfA), and Fabrizio Brighenti (University of Bologna).

NASA's Marshall Space Flight Center manages the Chandra program. The Smithsonian Astrophysical Observatory's Chandra X-ray Center controls science from Cambridge Massachusetts and flight operations from Burlington, Massachusetts.


Visual Description:

This image contains two X-ray images presented side by side, separated by a thin, gray line. On the left is an image of galaxy cluster Abell 478, and on the right is an image of galaxy group NGC 5044.

The X-ray image of Abell 478 resembles a gooey, blue substance that has been spilled on a black canvas. Most of the image is covered in this blue goo texture, which is hot gas in X-ray light, however there are cavities where no blue texture is present. At the center of the image is a bright, white region. Within the white region, too small to identify, exists Abell 478's supermassive black hole.

The X-ray image of NGC 5044, on our right, is more pixelated than the image of Abell 478. It resembles blue television static or noise, that is present on a television when no transmission signal is detected. Most of the image is covered in this blue static, however there are cavities where no blue static is present. At the center of the image is a bright, white region. Within the white region, too small to identify, exists NGC 5044's supermassive black hole.


Fast Facts for Abell 478:

Scale: Image is about 2 arcmin (650,000 light-years) across.
Category: Groups and Clusters of Galaxies
Coordinates (J2000): RA 4h 13m 20.7s | Dec +10° 27´ 56"
Constellation: Taurus
Observation Dates: 6 observations from Jan 27, 2001 to Jul 29, 2006
Observation Time: 27 hours 58 minutes (1 day 3 hours 58 minutes)
Obs. ID: 1669, 6102, 6928, 7231-7233
Instrument: ACIS
References: Ubertosi, F. et al, 2024, ApJ, 961, 134; arXiv:2313.02283
Color Code: X-ray: blue and white;
Distance Estimate: About 1.2 billion light-years from Earth (z=0.088)


Fast Facts for NGC 5044:

Scale: Image is about 2.4 arcmin (87,000 light-years) across.
Category: Groups and Clusters of Galaxies
Coordinates (J2000): RA 13h 15m 23.9s | Dec -16° 23´ 07.5"
Constellation: Virgo
Observation Dates: 9 observations from Mar 3, 2000 to Aug 23, 2015
Observation Time: 156 hours 34 minutes (6 days 12 hours and 34 minutes)
Obs. ID: 798, 3225, 3664, 9399, 17195, 17196, 17653, 17654, 17666
Instrument: ACIS
References: Ubertosi, F. et al, 2024, ApJ, 961, 134; arXiv:2313.02283
Color Code: X-ray: blue and white;
Distance Estimate: About 130 million light-years from Earth (z=0.009)