Friday, June 28, 2019

Scientists determine origin of Fast Radio Burst detected by ASKAP

Artist’s impression of CSIRO’s Australian SKA Pathfinder (ASKAP) radio telescope finding a fast radio burst and determining its precise location. The KECK, VLT and Gemini South optical telescopes joined ASKAP with follow-up observations to image the host galaxy. Credit: CSIRO/Dr Andrew Howells. Hi-res image

Perth, Australia, Friday 28 June 2019 – An Australian-led international team of astronomers has determined the precise location of a powerful one-off burst of cosmic radio waves. The discovery was made with CSIRO’s new Australian Square Kilometre Array Pathfinder (ASKAP) radio telescope in Western Australia. The galaxy from which the burst originated was then imaged by three of the world’s largest optical telescopes – Keck, Gemini South and ESO’s Very Large Telescope.

The results were announced this week by PhD student Wael Farah (Swinburne University, Melbourne, Australia) at the annual meeting of the European Astronomical Society (EWASS2019) in Lyon, France, and are published in the journal Science.

Fast radio bursts last less than a millisecond, making it difficult to accurately determine where they have come from. The team developed new technology to freeze and save ASKAP data less than a second after a burst arrives at the telescope. This technology was used to pinpoint the location of FRB 180924 to its home galaxy (DES J214425.25−405400.81). The team made a high-resolution map showing that the burst originated in the outskirts of a Milky Way-sized galaxy about four billion light-years away. To find out more about the home galaxy, the team imaged it with the European Southern Observatory’s 8-m Very Large Telescope in Chile and measured its distance with the 10-m Keck telescope in Hawai’i and the 8-m Gemini South telescope in Chile.

The cause of fast radio bursts remains unknown but the ability to determine their exact location is a big leap towards solving this mystery. Evan Keane, SKA Project Scientist and winner of the MERAC Prize for Observational Astrophysics this week for his groundbreaking work on FRBs, has been closely involved in the field. “In order to fully exploit the potential of FRBs as cosmological probes, it’s essential to be able to localise them this precisely, and ASKAP has done just that for the first time. It’s an amazing step for FRB science. The ultimate goal will be to go deeper in redshift and localise thousands of FRBs, this is where SKA will come in.” he said.


Wednesday, June 26, 2019

Cluster Merger: Galaxy Clusters Caught in a First Kiss

This image show the separate galaxy clusters 1E2215 and 1E2216, located about 1.2 billion light years from Earth, captured as they enter a critical phase of merging. Chandra’s X-ray data were combined with a radio image from the Giant Metrewave Radio Telescope in India and an optical image from the Sloan Digital Sky Survey that shows galaxies and stars in the field of view.  Credit: X-ray: NASA/CXC/RIKEN/L. Gu et al; Radio: NCRA/TIFR/GMRT; Optical: SDSS 


For the first time, astronomers have found two giant clusters of galaxies that are just about to collide, as reported in a new press release by RIKEN. This observation is important in understanding the formation of structure in the Universe, sincelarge-scale structures—such as galaxies and clusters of galaxies—are thought to grow by collisions and mergers.

The composite image shows the separate galaxy clusters 1E2215 and 1E2216, located about 1.2 billion light years from Earth, captured as they enter a critical phase of merging. Chandra’s X-ray data (blue) have been combined with a radio image from the Giant Metrewave Radio Telescope in India (red). These images were then overlaid on an optical image from the Sloan Digital Sky Survey that shows galaxies and stars in the field of view.

The discovery of 1E2215 and 1E2216 at this stage of merging has enabled astronomers to test their computer simulations of these important collisions. This new result provides evidence of a shock wave that is generated early in the merging process and travels out away from the collision in a perpendicular direction.

Because the merging process takes much longer than a human lifetime, astronomers only see snapshots of the various stages of these collisions. A separate graphic shows 1E2215 and 1E2216, plus two systems at earlier stages before collision (Abell 399/Abell 401, and Abell 1758), and one where the collision has already occurred (CIZA J2242.8). This series of images represents the sequential steps a galaxy cluster would undergo. A labeled version shows the separation between the two clusters and the amount of time, measured in billions of years, before or after impact.

In this cluster sequence graphic, only X-ray and radio data are shown. For Abell 399 and Abell 401, the X-ray data are from ROSAT and the radio data are from GMRT. In the Abell 1758 image and the 1E2215 and 1E2216 image, the X-ray are from Chandra and the radio data come from GMRT. Finally, the X-ray data in CIZA J2242.8 are from ESA’s XMM-Newton, while the radio data are from the Westerbork Synthesis Radio Telescope in the Netherlands. Credit: X-ray: NASA/CXC/RIKEN/L. Gu et al; Radio: NCRA/TIFR/GMRT; Optical: SDSS

Clusters of galaxies are the largest known objects held together by gravity and consist of hundreds of galaxies that each contain hundreds of billions of stars. Ever since the Big Bang, these objects have been growing by colliding and merging with each other. Due to their large size, with diameters of a few million light years, these collisions can take about a billion years to complete. After the dust has settled, the two colliding clusters will have merged into one bigger cluster.

The result was published in Nature Astronomy on June 24, 2019, by first author Liyi Gu of the RIKEN national science institute in Japan and the SRON Netherlands Institute for Space Research and collaborators. NASA's Marshall Space Flight Center in Huntsville, Alabama, manages the Chandra program for NASA's Science Mission Directorate in Washington. The Smithsonian Astrophysical Observatory in Cambridge, Massachusetts, controls Chandra's science and flight operations.


Fast Facts for Cluster Merger:

Scale: About 30 arcmin across (10 million light years)
Category: Groups & Clusters of Galaxies
Coordinates (J2000): RA 22h 18m 20.3s | Dec -03° 49' 41"
Constellation: Aquarius
Observation Date: 5 pointings from July 23 to July 29, 2018
Observation Time: 40 hours (1 day 16 hours)
Obs. ID: 21131-21134, 20778
Instrument: ACIS
References: Gu, L. et al., 2019, Nature Astronomy, in press
Color Code: X-ray: Blue; Radio: Pink; Optical: Red, Green, Blue
Distance Estimate: About 1.2 billion light years (z=0.09)


Tuesday, June 25, 2019

Hubble Finds Tiny “Electric Soccer Balls” in Space, Helps Solve Interstellar Mystery

This is an artist's concept depicting the presence of buckyballs in space. Buckyballs, which consist of 60 carbon atoms arranged like soccer balls, have been detected in space before by scientists using NASA's Spitzer Space Telescope. The new result is the first time an electrically charged (ionized) version has been found in the interstellar medium. Credits: NASA/JPL-Caltech. Original caption

Scientists using NASA’s Hubble Space Telescope have confirmed the presence of electrically-charged molecules in space shaped like soccer balls, shedding light on the mysterious contents of the interstellar medium (ISM) – the gas and dust that fills interstellar space.

Since stars and planets form from collapsing clouds of gas and dust in space, “The diffuse ISM can be considered as the starting point for the chemical processes that ultimately give rise to planets and life,” said Martin Cordiner of the Catholic University of America, Washington. “So fully identifying its contents provides information on the ingredients available to create stars and planets.” Cordiner, who is stationed at NASA’s Goddard Space Flight Center in Greenbelt, Maryland, is lead author of a paper on this research published April 22nd in the Astrophysical Journal Letters.

The molecules identified by Cordiner and his team are a form of carbon called “Buckminsterfullerene,” also known as “Buckyballs,” which consists of 60 carbon atoms (C60) arranged in a hollow sphere. C60 has been found in some rare cases on Earth in rocks and minerals, and can also turn up in high-temperature combustion soot.

C60 has been seen in space before. However, this is the first time an electrically charged (ionized) version has been confirmed to be present in the diffuse ISM. The C60 gets ionized when ultraviolet light from stars tears off an electron from the molecule, giving the C60 a positive charge (C60+). “The diffuse ISM was historically considered too harsh and tenuous an environment for appreciable abundances of large molecules to occur,” said Cordiner. “Prior to the detection of C60, the largest known molecules in space were only 12 atoms in size. Our confirmation of C60+ shows just how complex astrochemistry can get, even in the lowest density, most strongly ultraviolet-irradiated environments in the Galaxy.”

Life as we know it is based on carbon-bearing molecules, and this discovery shows complex carbon molecules can form and survive in the harsh environment of interstellar space. “In some ways, life can be thought of as the ultimate in chemical complexity,” said Cordiner. “The presence of C60 unequivocally demonstrates a high level of chemical complexity intrinsic to space environments, and points toward a strong likelihood for other extremely complex, carbon-bearing molecules arising spontaneously in space.”

Most of the ISM is hydrogen and helium, but it’s spiked with many compounds that haven’t been identified. Since interstellar space is so remote, scientists study how it affects the light from distant stars to identify its contents. As starlight passes through space, elements and compounds in the ISM absorb and block certain colors (wavelengths) of the light. When scientists analyze starlight by separating it into its component colors (spectrum), the colors that have been absorbed appear dim or are absent. Each element or compound has a unique absorption pattern that acts as a fingerprint allowing it to be identified. However, some absorption patterns from the ISM cover a broader range of colors, which appear different from any known atom or molecule on Earth. These absorption patterns are called Diffuse Interstellar Bands (DIBs). Their identity has remained a mystery ever since they were discovered by Mary Lea Heger, who published observations of the first two DIBs in 1922.

A DIB can be assigned by finding a precise match with the absorption fingerprint of a substance in the laboratory. However, there are millions of different molecular structures to try, so it would take many lifetimes to test them all.

“Today, more than 400 DIBs are known, but (apart from the few newly attributed to C60+), none has been conclusively identified,” said Cordiner. “Together, the appearance of the DIBs indicate the presence of a large amount of carbon-rich molecules in space, some of which may eventually participate in the chemistry that gives rise to life. However, the composition and characteristics of this material will remain unknown until the remaining DIBs are assigned.”

Decades of laboratory studies have failed to find a precise match with any DIBs until the work on C60+. In the new work, the team was able to match the absorption pattern seen from C60+ in the laboratory to that from Hubble observations of the ISM, confirming the recently claimed assignment by a team from University of Basel, Switzerland, whose laboratory studies provided the required C60+ comparison data. The big problem for detecting C60+ using conventional, ground-based telescopes, is that atmospheric water vapor blocks the view of the C60+ absorption pattern. However, orbiting above most of the atmosphere in space, the Hubble telescope has a clear, unobstructed view. Nevertheless, they still had to push Hubble far beyond its usual sensitivity limits to stand a chance of detecting the faint fingerprints of C60+.

The observed stars were all blue supergiants, located in the plane of our Galaxy, the Milky Way. The Milky Way's interstellar material is primarily located in a relatively flat disk, so lines of sight to stars in the Galactic plane traverse the greatest quantities of interstellar matter, and therefore show the strongest absorption features due to interstellar molecules.

The detection of C60+ in the diffuse ISM supports the team’s expectations that very large, carbon-bearing molecules are likely candidates to explain many of the remaining, unidentified DIBs. This suggests that future laboratory efforts measure the absorption patterns of compounds related to C60+, to help identify some of the remaining DIBs.

The team is seeking to detect C60+ in more environments to see just how widespread buckyballs are in the Universe. According to Cordiner, based on their observations so far, it seems that C60+ is very widespread in the Galaxy.

This work was funded by NASA under a grant from the Space Telescope Science Institute. The Hubble Space Telescope is a project of international cooperation between NASA and ESA (European Space Agency). NASA's Goddard Space Flight Center in Greenbelt, Maryland, manages the telescope. The Space Telescope Science Institute (STScI) in Baltimore, Maryland, conducts Hubble science operations. STScI is operated for NASA by the Association of Universities for Research in Astronomy in Washington, D.C. NASA is exploring our Solar System and beyond, uncovering worlds, stars, and cosmic mysteries near and far with our powerful fleet of space and ground-based missions.

Bill Steigerwald

NASA Goddard Space Flight Center, Greenbelt, Maryland

william.a.steigerwald@nasa.gov

Editor: Bill Steigerwald


Monday, June 24, 2019

Subaru Telescope Identifies the Outermost Edge of our Milky Way System

Figure 1: The Milky Way and Halo component. 
Credit: Tohoku University

A team of researchers identified the outermost edge of the Milky Way Galaxy - the Galaxy that humans reside in. Using the Subaru Telescope, the researchers examined the boundary of the stellar system that makes up our Galaxy. The ultimate size of our Galaxy is 520,000 light years in radius, 20 times larger than the distance between the Galactic Center and our solar system (26,000 light years) (Figure 1). Stars that reach these outermost regions of the Galaxy during their orbital motions are ancient stellar populations with ages as old as 12 billion years. The spatial extent in which these ancient stars wonder is, therefore, important for our understanding of the Milky Way's formation.

Our Galaxy holds a broadly extended halo component, in addition to the bright Milky Way in the form of the stellar disk component. The halo contains about a billion ancient stars and 150 globular clusters with ages as old as 12 billion years (Figure 1). The halo thus contains the remnants of long-lived stars and star clusters that formed in the first stage of the Galaxy. This suggests that the Galaxy was quite large in its beginning before the later formation of the younger, disk component.

Investigating the extent of this halo component in the Galaxy is similar to identifying the outer boundary of a forest whilst similarly being inside the forest and observing the trees. In other words, it is an arduous task. So called blue horizontal branch (BHB) stars as well as RR Lyr variables are ideal indicators for tracing the halo component. This is because they are naturally bright enough to determine the distance to and from them. However, the Galaxy is so large that it is impossible to identify the halo traces located at the outer boundary using 2.5 to 4 meter-diameter telescopes.

The team of researchers led by Tohoku University graduate student, Tetsuya Fukushima and his supervisor Masashi Chiba used the Hyper Suprime-Cam (HSC) digital camera on the 8.2 meter diameter Subaru Telescope. It enabled them to capture remote, very faint halo tracers at the outer edge of the Galaxy. The team carefully selected the BHB stars from the on-going survey program (SSP: Subaru Strategic Program) data against other contaminants having similar colors such as so-called blue straggler stars, white dwarfs, quasars and distant galaxies.

Using the data from HSC-SSP, the team derived the spatial density of the BHB stars over the Galaxy halo. While this density generally decreases the further you go from the Galactic center, the team discovered a sharp drop in density at around 520,000 light years away from the Galactic center. Thus, the team had finally reached the outermost edge of the Galaxy that we reside in. This is about 20 times larger than the distance between our Solar system and the Galaxy center.

Twelve billion years ago, successive merging of small galaxies confined by dark matter halos occurred. Key to understanding this is measuring the distribution of the halo component to ascertain the volume. This merging process differs from galaxy to galaxy. Our neighbor, the Andromeda Galaxy, is reported to have an extended halo component as large as 538,000 (at the very least) light years in its radius. It is, therefore, systematically larger when compared to the Galaxy halo. The researchers are planning to further map out this ancient component of the Galaxy after the final completion of the HSC-SSP.


These results were published in Publications of the Astronomical Society of Japan (Fukushima et al. 2019, "The stellar halo of the Milky Way traced by blue horizontal-branch stars in the Subaru Hyper Suprime-Cam Survey"). A preprint is available here. This research is supported by KAKENHI Grant Numbers Nos. JP25287062, JP16H01086, JP17H01101, JP18H04334, JP18H04359, JP18J00277, and JP18J11326.

Links:


 Source: Subaru Telescope


Saturday, June 22, 2019

Cool halo gas caught spinning like galatic disks

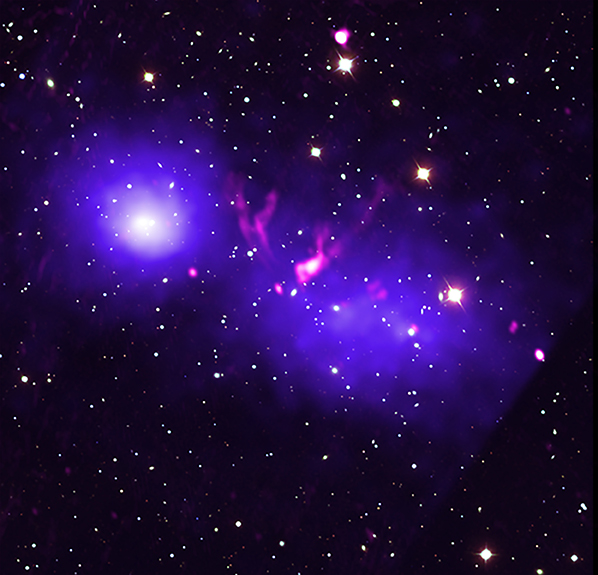
J165930+373527 is among the galaxies detected with corotating halo gas. this high-resolution nirc2 image (red) combined with hubble space telescope wfc3 imaging (blue and green) resolves the galactic disk. the galactic rotation was measured from w. m. keck observatory and apache point observatory emission-line spectra.


Corotation Found to be Typical, Suggesting Cool Halo Gas Prolongs Galaxy Growth

Maunakea, Hawaii – A group of astronomers led by Crystal Martin and Stephanie Ho of the University of California, Santa Barbara, has discovered a dizzying cosmic choreography among typical star-forming galaxies; their cool halo gas appears to be in step with the galactic disks, spinning in the same direction.

The researchers used W. M. Keck Observatory to obtain the first-ever direct observational evidence showing that corotating halo gas is not only possible, but common. Their findings suggest that the whirling gas halo will eventually spiral in towards the disk.

“This is a major breakthrough in understanding how galactic disks grow,” said Martin, Professor of Physics at UC Santa Barbara and lead author of the study. “Galaxies are surrounded by massive reservoirs of gas that extend far beyond the visible portions of galaxies. Until now, it has remained a mystery how exactly this material is transported to galactic disks where it can fuel the next generation of star formation.”

The study is published in today’s issue of The Astrophysical Journal and shows the combined results of 50 standard star-forming galaxies taken over a period of several years.

Nearly a decade ago, theoretical models predicted that the angular momentum of the spinning cool halo gas partially offsets the gravitational force pulling it towards the galaxy, thereby slowing down the gas accretion rate and lengthening the period of disk growth.

The team’s results confirm this theory, which show that the angular momentum of the halo gas is high enough to slow down the infall rate but not so high as to shut down feeding the galactic disk entirely.

Figure 1: Artist conception of gas streams (blue) feeding a galactic disk. The inflow fuels new star formation, and because the infalling gas is spinning, the size of the disk grows. Image credit: James Josephides, Swinburne Astronomy Productions.


Methodology


The astronomers first obtained spectra of bright quasars behind star-forming galaxies to detect the invisible halo gas by its absorption-line signature in the quasar spectra. Next, the researchers used Keck Observatory’s laser guide star adaptive optics (LGSAO) system and near-infrared camera (NIRC2) on the Keck II telescope, along with Hubble Space Telescope’s Wide Field Camera 3 (WFC3), to obtain high-resolution images of the galaxies.

“What sets this work apart from previous studies is that our team also used the quasar as a reference ‘star’ for Keck’s laser guide star AO system,” said co-author Stephanie Ho, a physics graduate student at UC Santa Barbara. “This method removed the blurring caused by the atmosphere and produced the detailed images we needed to resolve the galactic disks and geometrically determine the orientation of the galactic disks in three-dimensional space.”

The team then measured the Doppler shifts of the gas clouds using the Low Resolution Imaging Spectrometer (LRIS) at Keck Observatory, as well as obtaining spectra from Apache Point Observatory. This enabled the researchers to determine what direction the gas is spinning and how fast. The data proved that the gas is rotating in the same direction as the galaxy, and the angular momentum of the gas is not stronger than the force of gravity, meaning the gas will spiral into the galactic disk.

“Just as ice skaters build up momentum and spin when they bring their arms inward, the halo gas is likely spinning today because it was once at much larger distances where it was deposited by galactic winds, stripped from satellite galaxies, or directed toward the galaxy by a cosmic filament,” said Martin.

Next Steps


The next step for Martin and her team is to measure the rate at which the halo gas is being pulled into the galactic disk. Comparing the inflow rate to the star formation rate will provide a better timeline of the evolution of normal star-forming galaxies, and explain how galactic disks continue to grow over very long timescales that span billions of years.


About adaptive optics


The astronomers first obtained spectra of bright quasars behind star-forming galaxies to detect the invisible halo gas by its absorption-line signature in the quasar spectra. Next, the researchers used Keck Observatory’s laser guide star adaptive optics (LGSAO) system and near-infrared camera (NIRC2) on the Keck II telescope, along with Hubble Space Telescope’s Wide Field Camera 3 (WFC3), to obtain high-resolution images of the galaxies.

“What sets this work apart from previous studies is that our team also used the quasar as a reference ‘star’ for Keck’s laser guide star AO system,” said co-author Stephanie Ho, a physics graduate student at UC Santa Barbara. “This method removed the blurring caused by the atmosphere and produced the detailed images we needed to resolve the galactic disks and geometrically determine the orientation of the galactic disks in three-dimensional space.”

The team then measured the Doppler shifts of the gas clouds using the Low Resolution Imaging Spectrometer (LRIS) at Keck Observatory, as well as obtaining spectra from Apache Point Observatory. This enabled the researchers to determine what direction the gas is spinning and how fast. The data proved that the gas is rotating in the same direction as the galaxy, and the angular momentum of the gas is not stronger than the force of gravity, meaning the gas will spiral into the galactic disk.

“Just as ice skaters build up momentum and spin when they bring their arms inward, the halo gas is likely spinning today because it was once at much larger distances where it was deposited by galactic winds, stripped from satellite galaxies, or directed toward the galaxy by a cosmic filament,” said Martin.
About NIRC2


The Near-Infrared Camera, second generation (NIRC2) works in combination with the Keck II adaptive optics system to obtain very sharp images at near-infrared wavelengths, achieving spatial resolutions comparable to or better than those achieved by the Hubble Space Telescope at optical wavelengths. NIRC2 is probably best known for helping to provide definitive proof of a central massive black hole at the center of our galaxy. Astronomers also use NIRC2 to map surface features of solar system bodies, detect planets orbiting other stars, and study detailed morphology of distant galaxies.

About LRIS


The Low Resolution Imaging Spectrometer (LRIS) is a very versatile visible-wavelength imaging and spectroscopy instrument commissioned in 1993 and operating at the Cassegrain focus of Keck I. Since it has been commissioned it has seen two major upgrades to further enhance its capabilities: addition of a second, blue arm optimized for shorter wavelengths of light; and the installation of detectors that are much more sensitive at the longest (red)wavelengths. Each arm is optimized for the wavelengths it covers. This large range of wavelength coverage, combined with the instrument’s high sensitivity, allows the study of everything from comets (which have interesting features in the ultraviolet part of the spectrum), to the blue light from star formation, to the red light of very distant objects. LRIS also records the spectra of up to 50 objects simultaneously, especially useful for studies of clusters of galaxies in the most distant reaches, and earliest times, of the universe. LRIS was used in observing distant supernovae by astronomers who received the Nobel Prize in Physics in2011 for research determining that the universe was speeding up in its expansion.

About W.M. Keck Observatory


The W. M. Keck Observatory telescopes are the most scientifically productive on Earth. The two, 10-meter optical/infrared telescopes atop Maunakea on the Island of Hawaii feature a suite of advanced instruments including imagers, multi-object spectrographs, high-resolution spectrographs, integral-field spectrometers, and world-leading laser guide star adaptive optics systems. The data presented herein were obtained at the W. M. Keck Observatory, which is operated as a scientific partnership among the California Institute of Technology, the University of California, and the National Aeronautics and Space Administration. The Observatory was made possible by the generous financial support of the W. M. Keck Foundation. The authors recognize and acknowledge the very significant cultural role that the summit of Maunakea has always had within the Native Hawaiian community. We are most fortunate to have the opportunity to conduct observations from this mountain.


Thursday, June 20, 2019

Planetary Rings of Uranus ‘Glow’ in Cold Light

Artist impression of the planet Uranus and its dark ring system. Rather than observing the reflected sunlight from these rings, astronomers have imaged the millimeter and mid-infrared “glow” naturally emitted by the frigidly cold particles of the rings themselves. Credit: NRAO/AUI/NSF; S. Dagnello

Fig. 1: Composite image of Uranus’s atmosphere and rings at radio wavelengths, taken with the Atacama Large Millimeter/submillimeter Array (ALMA) in December 2017. The image shows thermal emission, or heat, from the rings of Uranus for the first time, enabling scientists to determine their temperature is a frigid 77 K (-320 F). Dark bands in Uranus’s atmosphere at these wavelengths show the presence of radiolight-absorbing molecules, in particular hydrogen sulfide (H2S) gas, whereas bright regions like the north polar spot contain very few of these molecules.Credit: ALMA (ESO/NAOJ/NRAO); Edward M. Molter and Imke de Pater)

The rings of Uranus are invisible to all but the largest telescopes — they weren’t even discovered until 1977 — and they stand out as surprisingly bright in new thermal images of the planet taken by two large telescopes in Chile.

The thermal glow gives astronomers another window onto the rings, which have been seen only because they reflect a little light in the visible, or optical, range and in the near-infrared. The new images taken by the Atacama Large Millimeter/submillimeter Array (ALMA) and the Very Large Telescope (VLT) allowed the team for the first time to measure the temperature of the rings: a cool 77 Kelvin, or 77 degrees above absolute zero — the boiling temperature of liquid nitrogen and equivalent to 320 degrees below zero Fahrenheit.

The observations also confirm that Uranus’s brightest and densest ring, called the epsilon ring, differs from the other known ring systems within our solar system, in particular the spectacularly beautiful rings of Saturn.

“Saturn’s mainly icy rings are broad, bright and have a range of particle sizes, from micron-sized dust in the innermost D ring, to tens of meters in size in the main rings,” said Imke de Pater, a UC Berkeley professor of astronomy. “The small end is missing in the main rings of Uranus; the brightest ring, epsilon, is composed of golf ball-sized and larger rocks.”

By comparison, Jupiter’s rings contain mostly small, micron-sized particles (a micron is a thousandth of a millimeter). Neptune’s rings are also mostly dust, and even Uranus has broad sheets of dust between its narrow main rings.

“We already know that the epsilon ring is a bit weird, because we don’t see the smaller stuff,” said graduate student Edward Molter. “Something has been sweeping the smaller stuff out, or it’s all glomming together. We just don’t know. This is a step toward understanding their composition and whether all of the rings came from the same source material, or are different for each ring.”

Rings could be former asteroids captured by the planet’s gravity, remnants of moons that crashed into one another and shattered, the remains of moons torn apart when they got too close to Uranus, or debris remaining from the time of formation 4.5 billion years ago.

The new data were published this week in The Astronomical Journal. De Pater and Molter led the ALMA observations, while Michael Roman and Leigh Fletcher from the University of Leicester in the United Kingdom led the VLT observations.

“The rings of Uranus are compositionally different from Saturn’s main ring, in the sense that in optical and infrared, the albedo is much lower: they are really dark, like charcoal,” Molter said. “They are also extremely narrow compared to the rings of Saturn. The widest, the epsilon ring, varies from 20 to 100 kilometers wide, whereas Saturn’s are hundreds or tens of thousands of kilometers wide.”

The lack of dust-sized particles in Uranus’s main rings was first noted when Voyager 2 flew by the planet in 1986 and photographed them. The spacecraft was unable to measure the temperature of the rings, however.

To date, astronomers have counted a total of 13 rings around the planet, with some bands of dust between the rings. The rings differ in other ways from those of Saturn.

“It’s cool that we can even do this with the instruments we have,” Molter said. “I was just trying to image the planet as best I could and I saw the rings. It was amazing.”

Both the VLT and ALMA observations were designed to explore the temperature structure of Uranus’ atmosphere, with VLT probing shorter wavelengths than ALMA.

“We were astonished to see the rings jump out clearly when we reduced the data for the first time,” Fletcher said.

This presents an exciting opportunity for the upcoming James Webb Space Telescope, which will be able provide vastly improved spectroscopic constraints on the Uranian rings in the coming decade.
The National Radio Astronomy Observatory is a facility of the National Science Foundation, operated under cooperative agreement by Associated Universities, Inc.


Contact:

Charles E. Blue
Public Information Officer
cblue@nrao.edu
434-296-0314


Reference: “Thermal emission from the Uranian ring system,” E.M. Molter, et al., the Astrophysical Journal. Preprint: https://arxiv.org/abs/1905.12566

The Atacama Large Millimeter/submillimeter Array (ALMA), an international astronomy facility, is a partnership of the European Organisation for Astronomical Research in the Southern Hemisphere (ESO), the U.S. National Science Foundation (NSF) and the National Institutes of Natural Sciences (NINS) of Japan in cooperation with the Republic of Chile. ALMA is funded by ESO on behalf of its Member States, by NSF in cooperation with the National Research Council of Canada (NRC) and the Ministry of Science and Technology (MOST) and by NINS in cooperation with the Academia Sinica (AS) in Taiwan and the Korea Astronomy and Space Science Institute (KASI).

ALMA construction and operations are led by ESO on behalf of its Member States; by the National Radio Astronomy Observatory (NRAO), managed by Associated Universities, Inc. (AUI), on behalf of North America; and by the National Astronomical Observatory of Japan (NAOJ) on behalf of East Asia. The Joint ALMA Observatory (JAO) provides the unified leadership and management of the construction, commissioning and operation of ALMA.

The Berkeley research was funded by the National Aeronautics and Space Administration (NNX16AK14G). Work at the University of Leicester was supported by the European Research Council (GIANTCLIMES) under the European Union’s Horizon 2020 research and innovation program (723890).


Wednesday, June 19, 2019

Does the Gas in Galaxy Clusters Flow Like Honey?

Coma Cluster

Credit X-ray: NASA/CXC/Univ. of Chicago, I. Zhuravleva et al, 
Optical: SDSS Release Date June 


This image represents a deep dataset of the Coma galaxy cluster obtained by NASA's Chandra X-ray Observatory. Researchers have used these data to study how the hot gas in the cluster behaves, as reported in our press release. One intriguing and important aspect to study is how much viscosity, or "stickiness," the hot gas demonstrates in these cosmic giants.

Galaxy clusters are comprised of individual galaxies, hot gas, and dark matter. The hot gas in Coma glows in X-ray light observed by Chandra. Seen as the purple and pink colors in this new composite image, the hot gas contains about six times more mass than all of the combined galaxies in the cluster. The galaxies appear as white in the optical part of the composite image from the Sloan Digital Sky Survey. (The unusual shape of the X-ray emission in the lower right is caused by the edges of the Chandra detectors being visible.)

Despite its abundance, the density of the multimillion-degree gas in Coma, which is permeated by a weak magnetic field, is so low that the particles do not interact with each other very often. Such a low-density, hot gas cannot be studied in a laboratory on Earth, and so scientists must rely on cosmic laboratories such as the one provided by the intergalactic gas in Coma.

The researchers used the Chandra data to probe whether the hot gas was smooth on the smallest scales they could detect. They found that it is not, suggesting that turbulence is present even on these relatively small scales and the viscosity is low.

Why is the viscosity of Coma's hot gas so low? One explanation is the presence of small-scale irregularities in the cluster's magnetic field. These irregularities can deflect particles in the hot gas, which is composed of electrically charged particles, mostly electrons, and protons. These deflections reduce the distance a particle can move freely and, by extension, the gas viscosity.

Knowledge of the viscosity of gas in a galaxy cluster and how easily turbulence develops helps scientists understand the effects of important phenomena such as collisions and mergers with other galaxy clusters, and galaxy groups. Turbulence generated by these powerful events can act as a source of heat, preventing the hot gas in clusters from cooling to form billions of new stars.

A paper describing this research appeared in Nature Astronomy on June 17th, 2019 and is available online. The authors of the paper are Irina Zhuravleva (University of Chicago), Eugene Churazov, (Max Planck Institute for Astrophysics in Garching and the Space Research Institute in Moscow), Alexander Schekochihin (University of Oxford), Steven Allen (Stanford University, SLAC), Alexey Vikhlinin (Harvard-Smithsonian Center for Astrophysics), and Norbert Werner (MTA-Eötvös University Lendulet, Masaryk University, Hiroshima University). NASA's Marshall Space Flight Center in Huntsville, Alabama, manages the Chandra program for NASA's Science Mission Directorate in Washington. The Smithsonian Astrophysical Observatory in Cambridge, Massachusetts, controls Chandra's science and flight operations.


Fast Facts for Coma Cluster:

Scale: Image is about 25 arcmin (2.2 million light years) across.
Category: Groups & Clusters of Galaxies
Coordinates (J2000): RA 12h 59m 42s | Dec +27° 56´ 40.9"
Constellation: Coma Berenices
Observation Date: 36 pointings from March 2008 to March 2017
Observation Time: 416 hours 40 minutes (17 days 8 hours 40 minutes)
Obs. ID: 9714, 10672, 13993–13996, 14406, 14410, 14411, 14415, 18271–18276, 18761, 18791–18798, 19998, 20010, 20011, 20027–20031, 20037–20039
Instrument: ACIS
References: Zhuravleva, I. et al, 2019, Nature Astronomy, arXiv:1906.06346
Color Code: X-ray: purple; Optical: white
Distance Estimate: About 320 million light years (z=0.023)


Tuesday, June 18, 2019

Two Earth-like planets around one of the smallest stars, and a slim chance someone there might see Earth


An international team of astronomers has found two Earth-like planets around one of the smallest known stars known as “Teegarden’s star.” The planets, which orbit in the star’s habitable zone where liquid water is possible, are only a quarter and a third more massive than the Earth, respectively. The discovery helps complete our picture of the statistics of exoplanet prevalence, correcting implicit biases in earlier observations. Incidentally, hypothetical observers on those planets would soon be in a uniquely favorable position to detect our Earth, using the so-called transit method. The results have just been published in the journal Astronomy & Astrophysics.

By now, astronomers have detected more than 4000 exoplanets, that is, planets orbiting stars other than the Sun. But our view of the alien worlds out there is highly biased. The standard methods of (indirectly) detecting exoplanets all require precise measurements of the host star’s light, and such measurements are much easier for stars that are about as bright as our Sun. Most stars within our galaxy are dimmer and more reddish than that, and for those stars, exoplanet detection has been difficult – potentially biasing the conclusions astronomers might want to draw about the prevalence and properties of exoplanets in general!

The CARMENES instrument at Calar Alto Observatory, which saw “first light” in early 2016, is a twin spectrograph optimized for targeting just such dim, reddish stars. Martin Kürster, leading scientist for CARMENES at the Max Planck Institute for Astronomy, says: “CARMENES can help us correct our biases by studying the by far most common stars in our galaxy. The instrument is sensitive enough to detect Earth-like, potentially habitable planets around such stars.”

One of the more than 300 red dwarf stars targeted by CARMENES was “Teegarden’s star,” in the constellation Aries, named for NASA scientist Bonnard J. Teegarden who found the star in data that had been collected for tracking asteroids. With just 8% of the Sun’s mass, around 10% of the Sun’s radius and a reddish 2900 K in temperature, Teegarden’s star is one of the smallest stars in our neigbourhood. At a distance of just 12.5 light-years, it is also one of the closest stars. Following the usual conventions, the two planets have been designated "Teegarden b" and "Teegarden c".

Mathias Zechmeister of Göttingen University (formerly at MPIA), lead author of the study, says: “We observed this star for three years, looking for periodic variations in its velocity. The data clearly show the existence of two planets.” Following the usual naming conventions, the planets have been designated Teegarden b and Teegarden c.

The so-called radial velocity method used for the detection allows for the measurement of a planets’ minimum mass, and estimates for their probable mass. The planets around Teegarden’s star have minimum masses of 1.05 and 1.1 Earth masses, respectively, with best mass estimates of 1.25 and 1.33 Earth masses, making them somewhat Earth-like. Both planets orbit inside their star’s habitable zone, where liquid water is possible, although one of the planets would need to have a rather special atmosphere in order to allow for water on its surface. Estimates put the system’s age at around 8 billion years, nearly twice as old as Earth, allowing plenty of time for the evolution of life.

Incidentally, within a few decades, it would be easier for hypothetical intelligent beings on one of those planets to detect Earth than the other way around: Between the years 2044 and 2496, Teegarden’s star will be positioned to see the Solar System edge on, and its inhabitants should be able to detect Earth using the so-called transit method as they see our planet pass directly in front of the disk of the Sun.

By that time, Earth’s astronomers can be expected to have raised the stakes already: the similarities to Earth and potential habitability make the two planets prime candidates for further in-depth study by the next generation of Earth-based telescopes, in pursuit of one of the most exciting goals of modern astronomy: detecting life on another planet.


Science Contact

Martin Kürster
Head of the Technical Departments, Project Coordinator, Astronomer
Phone: +49 6221 528-214
Email: kuerster@mpia.de
Room: 123

Links:  Technischen Abteilungen -Technical Departments

Public Information Officer

Markus Pössel
Public Information Officer
Phone:+49 6221 528-261
Email: pr@mpia.de


Background information


The results have been published as M. Zechmeister et al. 2019, “The CARMENES search for exoplanets around M dwarfs: Two temperate Earth-mass planet candidates around Teegarden’s Star” in the journal Astronomy & Astrophysics.

The CARMENES (Calar Alto high-Resolution search for M dwarfs with Exoearths with Near-infrared and optical Échelle Spectrographs) instrument is a high-resolution optical and near infrared spectrograph. The project is carried out by the universities of Göttingen, Hamburg, Heidelberg, and Madrid, the Max-Planck Institut für Astronomie Heidelberg, Institutes of the Consejo Superior de Investigaciones Científicas in Barcelona, Granada, and Madrid, Thüringer Landessternwarte, Instituto de Astrofísica de Canarias, and Calar-Alto Observatory. In the framework of CARMENES, German and Spanish scientists have been searching for planets around stars in the solar neighbourhood since 2016. The new planets are number ten and eleven among the project’s discoveries.


Monday, June 17, 2019

NASA’s Fermi Mission Reveals its Highest-energy Gamma-ray Bursts

This illustration shows NASA’s Fermi Gamma-ray Space Telescope, which observes the sky in gamma rays, the highest-energy form of light. Credit: NASA's Goddard Space Flight Center

For 10 years, NASA’s Fermi Gamma-ray Space Telescope has scanned the sky for gamma-ray bursts (GRBs), the universe’s most luminous explosions. A new catalog of the highest-energy blasts provides scientists with fresh insights into how they work.

“Each burst is in some way unique,” said Magnus Axelsson, an astrophysicist at Stockholm University in Sweden. “It’s only when we can study large samples, as in this catalog, that we begin to understand the common features of GRBs. These in turn give us clues to the physical mechanisms at work.”

The catalog was published in the June 13 edition of The Astrophysical Journal and is now available online. More than 120 authors contributed to the paper, led by Axelsson, Elisabetta Bissaldi at the National Institute of Nuclear Physics and Polytechnic University in Bari, Italy, and Nicola Omodei and Giacomo Vianello at Stanford University in California.

GRBs emit gamma rays, the highest-energy form of light. Most GRBs occur when some types of massive stars run out of fuel and collapse to create new black holes. Others happen when two neutron stars, superdense remnants of stellar explosions, merge. Both kinds of cataclysmic events create jets of particles that move near the speed of light. The gamma rays are produced in collisions of fast-moving material inside the jets and when the jets interact with the environment around the star.

Astronomers can distinguish the two GRB classes by the duration of their lower-energy gamma rays. Short bursts from neutron star mergers last less than 2 seconds, while long bursts typically continue for a minute or more. The new catalog, which includes 17 short and 169 long bursts, describes 186 events seen by Fermi’s Large Area Telescope (LAT) over the last 10 years.

Fermi observes these powerful bursts using two instruments. The LAT sees about one-fifth of the sky at any time and records gamma rays with energies above 30 million electron volts (MeV) — millions of times the energy of visible light. The Gamma-ray Burst Monitor (GBM) sees the entire sky that isn’t blocked by Earth and detects lower-energy emission. All told, the GBM has detected more than 2,300 GRBs so far.

Below is a sample of five record-setting and intriguing events from the LAT catalog that have helped scientists learn more about GRBs.

1. GRB 081102B

The short burst 081102B, which occurred in the constellation Boötes on Nov. 2, 2008, is the briefest LAT-detected GRB, lasting just one-tenth of a second. Although this burst appeared in Fermi’s first year of observations, it wasn’t included in an earlier version of the collection published in 2013.

“The first LAT catalog only identified 35 GRBs,” Bissaldi said. “Thanks to improved data analysis techniques, we were able to confirm some of the marginal observations in that sample, as well as identify five times as many bursts for the new catalog.”

2. GRB 160623A

Long-lived burst 160623A, spotted on June 23, 2016, in the constellation Cygnus, kept shining for almost 10 hours at LAT energies — the longest burst in the catalog. But at the lower energies recorded by Fermi's GBM instrument, it was detected for only 107 seconds. This stark difference between the instruments confirms a trend hinted at in the first LAT catalog. For both long and short bursts, the high-energy gamma-ray emission lasts longer than the low-energy emission and happens later.

 3. GRB 13042A

The highest-energy individual gamma ray detected by Fermi’s LAT reached 94 billion electron volts (GeV) and traveled 3.8 billion light-years from the constellation Leo. It was emitted by 130427A, which also holds the record for the most gamma rays — 17 — with energies above 10 GeV.

A popular model proposed that charged particles in the jet, moving at nearly the speed of light, encounter a shock wave and suddenly change direction, emitting gamma rays as a result. But this model can’t account for the record-setting light from this burst, forcing scientists to rethink their theories.

The original findings on 130427A show that the LAT instrument tracked its emission for twice as long as indicated in the catalog. Due to the large sample size, the team adopted the same standardized analysis for all GRBs, resulting in slightly different numbers than reported in the earlier study. 

4. GRB 08916C


The farthest known GRB occurred 12.2 billion light-years away in the constellation Carina. Called 080916C, researchers calculate the explosion contained the power of 9,000 supernovae.

Telescopes can observe GRBs out to these great distances because they are so bright, but pinpointing their exact distance is difficult. Distances are only known for 34 of the 186 events in the new catalog.

5. GRB 090510B

The known distance to 090510 helped test Einstein’s theory that the fabric of space-time is smooth and continuous. Fermi detected both a high-energy and a low-energy gamma ray at nearly the same instant. Having traveled the same distance in the same amount of time, they showed that all light, no matter its energy, moves at the same speed through the vacuum of space.

“The total gamma-ray emission from 090510 lasted less than 3 minutes, yet it allowed us to probe this very fundamental question about the physics of our cosmos,” Omodei said. “GRBs are really one of the most spectacular astronomical events that we witness.”

What's Missing?

GRB 170817A marked the first time light and ripples in space-time, called gravitational waves, were detected from the merger of two neutron stars. The event was captured by the Laser Interferometer Gravitational Wave Observatory (LIGO), the Virgo interferometer and Fermi's GBM instrument, but it wasn’t observed by the LAT because the instrument was switched off as the spacecraft passed through a region of Fermi’s orbit where particle activity is high.

“Now that LIGO and Virgo have begun another observation period, the astrophysics community will be on the lookout for more joint GRB and gravitational wave events” said Judy Racusin, a co-author and a Fermi deputy project scientist at NASA’s Goddard Space Flight Center in Greenbelt, Maryland. “This catalog was a monumental team effort, and the result helps us learn about the population of these events and prepares us for delving into future groundbreaking finds.”

The Fermi Gamma-ray Space Telescope is an astrophysics and particle physics partnership managed by NASA's Goddard Space Flight Center in Greenbelt, Maryland. Fermi was developed in collaboration with the U.S. Department of Energy, with important contributions from academic institutions and partners in France, Germany, Italy, Japan, Sweden and the United States.

By Jeanette Kazmierczak
NASA’s Goddard Space Flight Center, Greenbelt, Md.

Editor: Rob Garner


Friday, June 14, 2019

Magnetic Field May Be Keeping Milky Way’s Black Hole Quiet

Streamlines showing magnetic fields layered over a color image of the dusty ring around the Milky Way’s massive black hole. The Y-shaped structure is warm material falling toward the black hole, which is located near where the two arms of the Y-shape intersect. The streamlines reveal that the magnetic field closely follows the shape of the dusty structure. Each of the blue arms has its own field that is totally distinct from the rest of the ring, shown in pink. Credits: Dust and magnetic fields: NASA/SOFIA; Star field image: NASA/Hubble Space Telescope

Supermassive black holes exist at the center of most galaxies, and our Milky Way is no exception. But many other galaxies have highly active black holes, meaning a lot of material is falling into them, emitting high-energy radiation in this “feeding” process. The Milky Way’s central black hole, on the other hand, is relatively quiet. New observations from NASA’s Stratospheric Observatory for Infrared Astronomy, SOFIA, are helping scientists understand the differences between active and quiet black holes.

These results give unprecedented information about the strong magnetic field at the center of the Milky Way galaxy. Scientists used SOFIA’s newest instrument, the High-resolution Airborne Wideband Camera-Plus, HAWC+, to make these measurements.

Magnetic fields are invisible forces that influence the paths of charged particles, and have significant effects on the motions and evolution of matter throughout the universe. But magnetic fields cannot be imaged directly, so their role is not well understood. The HAWC+ instrument detects polarized far-infrared light, which is invisible to human eyes, emitted by celestial dust grains. These grains align perpendicular to magnetic fields. From the SOFIA results, astronomers can map the shape and infer the strength of the otherwise invisible magnetic field, helping to visualize this fundamental force of nature.

“This is one of the first instances where we can really see how magnetic fields and interstellar matter interact with each other,” noted Joan Schmelz, Universities Space Research Center astrophysicist at NASA Ames Research Center in California’s Silicon Valley, and a co-author on a paper describing the observations.  “HAWC+ is a game-changer.”

Previous observations from SOFIA show the tilted ring of gas and dust orbiting the Milky Way’s black hole, which is called Sagittarius A* (pronounced “Sagittarius A-star”). But the new HAWC+ data provide a unique view of the magnetic field in this area, which appears to trace the region’s history over the past 100,000 years.

Details of these SOFIA magnetic field observations were presented at the June 2019 meeting of the American Astronomical Society and will be submitted to the Astrophysical Journal.

The gravity of the black hole dominates the dynamics of the center of the Milky Way, but the role of the magnetic field has been a mystery. The new observations with HAWC+ reveal that the magnetic field is strong enough to constrain the turbulent motions of gas. If the magnetic field channels the gas so it flows into the black hole itself, the black hole is active, because it is eating a lot of gas. 

However, if the magnetic field channels the gas so it flows into an orbit around the black hole, then the black hole is quiet because it’s not ingesting any gas that would otherwise eventually form new stars.

Researchers combined mid- and far-infrared images from SOFIA’s cameras with new streamlines that visualize the direction of the magnetic field. The blue y-shaped structure (see figure) is warm material falling toward the black hole, which is located near where the two arms of the y-shape intersect. Layering the structure of the magnetic field over the image reveals that the magnetic field follows the shape of the dusty structure. Each of the blue arms has its own field component that is totally distinct from the rest of the ring, shown in pink. But there are also places where the field veers away from the main dust structures, such as the top and bottom endpoints of the ring.

“The spiral shape of the magnetic field channels the gas into an orbit around the black hole,” said Darren Dowell, a scientist at NASA’s Jet Propulsion Laboratory, principal investigator for the HAWC+ instrument, and lead author of the study. “This could explain why our black hole is quiet while others are active.”

The new SOFIA and HAWC+ observations help determine how material in the extreme environment of a supermassive black hole interacts with it, including addressing a longstanding question of why the central black hole in the Milky Way is relatively faint while those in other galaxies are so bright. 

SOFIA, the Stratospheric Observatory for Infrared Astronomy, is a Boeing 747SP jetliner modified to carry a 106-inch diameter telescope. It is a joint project of NASA and the German Aerospace Center, DLR. NASA’s Ames Research Center in California’s Silicon Valley manages the SOFIA program, science and mission operations in cooperation with the Universities Space Research Association headquartered in Columbia, Maryland, and the German SOFIA Institute (DSI) at the University of Stuttgart. The aircraft is maintained and operated from NASA’s Armstrong Flight Research Center Building 703, in Palmdale, California. The HAWC+ instrument was developed and delivered to NASA by a multi-institution team led by the Jet Propulsion Laboratory in Pasadena, California.


Written by Kassandra Bell and Joan Schmelz


Editor: Kassandra Bell


Media Contacts


Nicholas Veronico
SOFIA Science Center
Ames Research Center, Silicon Valley, California
650-604-4589 / 650-224-8726

nicholas.a.veronico@nasa.gov

Elizabeth Landau
NASA Headquarters, Washington
818-359-3241

elandau@jpl.nasa.gov

Calla Cofield
Jet Propulsion Laboratory, Pasadena, Calif.
626-808-2469

calla.e.cofield@jpl.nasa.gov


Thursday, June 13, 2019

The Formative Years: Giant Planets vs. Brown Dwarfs


GPI Survey from Franck Marchis on Vimeo.


Animation showing the 617 observations conducted during GPIES from November 2014 to April 2019 (right) and the location of the stars in the southern sky (left). Open circles indicate system (like 51 Eri at 2 o’clock) which have been visited multiple times. Stars indicated by a red dot have a disk of material. Blue dots are planetary systems (with one planet at least). Brown dot are binary systems with a brown dwarf. Credits: P. Kalas, D. Savransky, R. De Rosa and GPIES.

Based on preliminary results from a new Gemini Observatory survey of 531 stars with the Gemini Planet Imager (GPI), it appears more and more likely that large planets and brown dwarfs have very different roots.

The GPI Exoplanet Survey (GPIES), one of the largest and most sensitive direct imaging exoplanet surveys to date, is still ongoing at the Gemini South telescope in Chile. “From our analysis of the first 300 stars observed, we are already seeing strong trends,” said Eric L. Nielsen of Stanford University, who is the lead author of the study, published in The Astronomical Journal.

In November 2014, GPI Principal Investigator Bruce Macintosh of Stanford University and his international team set out to observe almost 600 young nearby stars with the newly commissioned instrument. GPI was funded with support from the Gemini Observatory partnership, with the largest portion from the US National Science Foundation (NSF). The NSF, and the Canadian National Research Council (NRC; also a Gemini partner), funded researchers participating in GPIES.

Imaging a planet around another star is a difficult technical challenge possible with only a few instruments. Exoplanets are small, faint, and very close to their host star — distinguishing an orbiting planet from its star is like resolving the width of a dime from several miles away. Even the brightest planets are ten thousand times fainter than their parent star. GPI can see planets up to a million times fainter, much more sensitive than previous planet-imaging instruments. “GPI is a great tool for studying planets, and the Gemini Observatory gave us time to do a careful, systematic survey,” said Macintosh.

GPIES is now coming to an end. From the first 300 stars, GPIES has detected six giant planets and three brown dwarfs. “This analysis of the first 300 stars observed by GPIES represents the largest, most sensitive direct imaging survey for giant planets published to date,” added Macintosh.
Brown dwarfs are more massive than planets, but not massive enough to fuse hydrogen like stars. “Our analysis of this Gemini survey suggests that wide-separation giant planets may have formed differently from their brown dwarf cousins,” Nielsen said.

The team’s paper advances the idea that massive planets form due to the slow accumulation of material surrounding a young star, while brown dwarfs come about due to rapid gravitational collapse. “It’s a bit like the difference between a gentle light rain and a thunderstorm,” said Macintosh.

“With six detected planets and three detected brown dwarfs from our survey, along with unprecedented sensitivity to planets a few times the mass of Jupiter at orbital distances well beyond Jupiter’s, we can now answer some key questions, especially about where and how these objects form,” Nielsen said.

This discovery may answer a longstanding question as to whether brown dwarfs — intermediate-mass objects — are born more like stars or planets. Stars form from the top down by the gravitational collapse of large primordial clouds of gas and dust, while planets are thought — but have not been confirmed — to form from the bottom up by the assembly of small rocky bodies that then grow into larger ones, a process also termed “core accretion.”

“What the GPIES team’s analysis shows is that the properties of brown dwarfs and giant planets run completely counter to each other,” said Eugene Chiang, professor of astronomy at the University of California Berkeley and a co-author of the paper. “Whereas more massive brown dwarfs outnumber less massive brown dwarfs, for giant planets the trend is reversed: less massive planets outnumber more massive ones. Moreover, brown dwarfs tend to be found far from their host stars, while giant planets concentrate closer in. These opposing trends point to brown dwarfs forming top-down, and giant planets forming bottom-up.”

More Surprises

Of the 300 stars surveyed thus far, 123 are at least 1.5 times more massive than our Sun. One of the most striking results of the GPI survey is that all hosts of detected planets are among these higher-mass stars — even though it is easier to see a giant planet orbiting a fainter, more Sun-like star. Astronomers have suspected this relationship for years, but the GPIES survey has unambiguously confirmed it. This finding also supports the bottom-up formation scenario for planets.

One of the study’s greatest surprises has been how different other planetary systems are from our own. Our Solar System has small rocky planets in the inner parts and giant gas planets in the outer parts. But the very first exoplanets discovered reversed this trend, with giant planets skimming closer to their stars than does moon-sized Mercury. Furthermore, radial-velocity studies — which rely on the fact that a star experiences a gravitationally induced “wobble” when it is orbited by a planet — have shown that the number of giant planets increases with distance from the star out to about Jupiter’s orbit. But the GPIES team’s preliminary results, which probe still larger distances, has shown that giant planets become less numerous farther out.

“The region in the middle could be where you're most likely to find planets larger than Jupiter around other stars," added Nielsen, “which is very interesting since this is where we see Jupiter and Saturn in our own Solar System.” In this regard, the location of Jupiter in our own Solar System may fit the overall exoplanet trend.

But a surprise from all exoplanet surveys is how intrinsically rare giant planets seem to be around Sun-like stars, and how different other solar systems are. The Kepler mission discovered far more small and close-in planets — two or more “super-Earth” planets per Sun-like star, densely packed into inner solar systems much more crowded than our own. Extrapolation of simple models suggested GPI would find a dozen giant planets or more, but it only saw six. Putting it all together, giant planets may be present around only a minority of stars like our own.

In January 2019, GPIES observed its 531st, and final, new star, and the team is currently following up the remaining candidates to determine which are truly planets and which are distant background stars impersonating giant planets.

The next-generation telescopes — such as NASA’s James Webb Space Telescope and WFIRST mission, the Giant Magellan Telescope, Thirty Meter Telescope, and Extremely Large Telescope — should be able to push the boundaries of study, imaging planets much closer to their star and overlapping with other techniques, producing a full accounting of giant planet and brown dwarf populations from 1 to 1,000 AU.

“Further observations of additional higher mass stars can test whether this trend is real,” said Macintosh, “especially as our survey is limited by the number of bright, young nearby stars available for study by direct imagers like GPI.”


Science Contacts:

Media Contact:
  • Peter Michaud
    Gemini Observatory, PIO Manager
    Email:
    pmichaud@gemini.edu
    Desk phone: 808-974-2510
    Cell phone: 808-936-6643


Background:

GPI is specifically designed to search for planets and brown dwarfs around other stars, using a mask known as a coronagraph to partially block a star’s light. Together with adaptive optics correcting for turbulence in the Earth’s atmosphere and advanced image processing, researchers can search the star’s neighborhood for Jupiter-like exoplanets and brown dwarfs up to a million times fainter than the host star.

In our Solar System, Jupiter is the largest planet, being about 318 times as massive as the Earth and lying about five times farther from the Sun than does the Earth. Brown dwarfs range from 13 to 90 times the mass of Jupiter; and while they can be up to a tenth the mass of the Sun, they lack the nuclear fusion in their core to burn as a star — so they lie somewhere between a diminutive star and a super-planet.

An early success of GPIES was the discovery of 51 Eridani b in December 2014, a planet about two-and-a-half times more massive than Jupiter, that orbits its star beyond the distance that Saturn orbits our own Sun. The host star, 51 Eridani, is just 97 light-years away, and is only 26 million years old (nearby and young, by astronomy standards). The star had been observed by multiple planet-imaging surveys with a variety of telescopes and instruments, but its planet was not detected until GPI’s superior instrumentation was able to suppress the starlight enough for the planet to be visible.

GPIES also discovered the brown dwarf HR 2562 B, which is at a separation similar to that between the Sun and Uranus, and is 30 times more massive than Jupiter.

Most exoplanets discovered thus far, including those found by NASA’s Kepler spacecraft, are found via indirect methods, such as observing a dimming in the star’s light as the orbiting planet eclipses its parent star, or by observing the star’s wobble as the planet’s gravity tugs on the star. These methods have been very successful, but they only probe the central regions of planetary systems. Those regions outside the orbit of Jupiter, where the giant planets are in our Solar System, are usually out of their reach. GPI, however, endeavors to directly detect planets in this parameter space by taking a picture of them alongside their parent stars.

The Gemini results support those from these other techniques, including a recent study of exoplanets discovered by the radial velocity method that found the most likely separation for a giant planet around Sun-like stars is about 3 AU. The finding that brown dwarfs occur with a frequency of only about 1%, independent of stellar mass, is also consistent with previous results from direct imaging surveys.