Tuesday, January 31, 2023

Featured Image: Outflows from the Silver Coin Galaxy

NGC 253

The Silver Coin Galaxy, also known as NGC 253, is one of the nearest examples of a starburst galaxy — one that forms new stars faster than typical galaxies. In visible light, the nearly edge-on Silver Coin looks like a bright, narrow ellipse mottled with dark dust clouds. X-ray data tell a different story, though, as the image above shows. While the optical emission (H-alpha; green) is confined to the galaxy’s tilted disk, the X-ray emission (blue) extends perpendicular to the disk, tracing immense outflows powered by the galaxy’s fervent star formation. Millimeter emission (red) rounds out the three-color image. Using images and spectra from the Chandra X-ray Observatory, Sebastian Lopez (The Ohio State University) and collaborators investigated the physical properties of the galaxy’s outflows, finding that the galactic winds expel roughly 6 solar masses of gas each year. Spectral analysis revealed that the innermost region of the outflows are chemically enriched, providing a potential source for the metals found in the sparse gas between the Milky Way and its galactic neighbors. For more details about this windy starburst galaxy, be sure to check out the full article linked below!

By Kerry Hensley

Citation

“X-Ray Properties of NGC 253’s Starburst-Driven Outflow,” Sebastian Lopez et al 2023 ApJ 942 108. doi:10.3847/1538-4357/aca65e


Monday, January 30, 2023

The Curious Case of the Dwarf Galaxy Pegasus W


What appears to be a normal field of stars is actually an ultra-faint dwarf galaxy; this Hubble Space Telescope image shows just the stars belonging to the tiny galaxy Leo IV, with the background galaxies removed. Credit: NASA, ESA, and T. Brown (STScI)

Title: Pegasus W: An Ultra-Faint Dwarf Galaxy Outside the Halo of M31 Not Quenched by Reionization
Authors: Kristen B. McQuinn et al.
First Author’s Institution: Rutgers University
Status: Accepted to ApJ


Our local patch of the universe is populated by a number of galaxies — the so-called “Local Group,” consisting of our very own Milky Way, the similar-in-mass Andromeda Galaxy (Messier 31), and between 50 and 100 known “dwarf” or low-mass galaxies. The faintest, least massive of these, termed ultra-faint dwarfs, range in mass from a few thousand solar masses down to just a few hundred solar masses! Ultra-faint dwarfs in the Local Group are of immense interest to astronomers, since they can be used to study a variety of phenomena ranging from dark matter dynamics to stellar feedback, and from chemical evolution to ram pressure stripping. Owing to the low mass and weak gravitational potentials of ultra-faint dwarfs, these various physical processes often have outsize effects on their stars and gas, making them ideal objects for study.

Today’s authors report the discovery of a new ultra-faint dwarf named Pegasus W and analyse some of its interesting properties. Most ultra-faint dwarfs are extremely difficult to detect as they are faint and often diffuse — in fact, looking at a simple image of one may not even reveal its presence, as Figure 1 shows! Therefore, they are often detected by looking for statistical overdensities of stars in large sky surveys, and that’s exactly how Pegasus W was discovered from Dark Energy Spectroscopic Instrument (DESI) data. The authors of today’s article then followed up with Hubble Space Telescope imaging to study the stellar populations in the galaxy.


Figure 1: Left-hand panel shows a Hubble Space Telescope image of the area of the sky where Pegasus W is located. The right panel shows a view of the stellar density distribution, with the contours highlighting the over-density of stars that indicates the presence of Pegasus W. Credit: Adapted from McQuinn et al. 2023

Pegasus W is about 3 million light-years from the Milky Way. It’s closer to Andromeda, but still outside Andromeda’s virial radius (a measure of how far a galaxy’s gravitational influence extends). Therefore, it is not considered a satellite of Andromeda but rather an isolated ultra-faint dwarf galaxy. It is also quite faint, with a V-band absolute magnitude of about −7.2 and an estimated stellar mass of only 6.5 x 10⁴ solar masses!

One of the most important properties of a galaxy is its star formation history — a fossil record of how it assembled and grew over time. Local Group dwarf galaxies are especially well suited for star formation history studies because of how nearby they are. The Local Group is the only place in the entire universe where we can get resolved photometry (imaging) of the individual stars in a galaxy, whereas for all other galaxies farther away we can only observe their starlight as an unresolved blob! This is key for measuring accurate star formation histories, since resolved stellar imaging allows us to build a colour–magnitude diagram for a galaxy — a plot of all its stars comparing their luminosities to their temperatures. After constructing a galaxy’s colour–magnitude diagram, we can fit stellar evolution models to it to figure out how old its various stellar populations are, and this allows us to reverse-engineer the entire record of how it formed its stars over cosmic time!

Figure 2 shows how this analysis was carried out for Pegasus W. The top-left panel shows the observed colour–magnitude diagram for the galaxy, with the top right being the best-fit diagram from stellar evolution modelling. The bottom left shows the residuals (i.e., what results from subtracting the model from the data). The residual significance diagram on the bottom right shows a checkerboard pattern, which indicates that the model is a good fit.


Figure 2: Top left: Observed colour–magnitude diagram for Pegasus W from resolved stellar imaging. Top right: Colour–magnitude diagram reconstruction using stellar evolution models. Bottom left: Residual resulting from subtracting the model from the data. Bottom right: Residual significance diagram showing that the model is a good fit. Credit: McQuinn et al. 2023
 
Figure 3 shows the star formation history that the authors inferred for Pegasus W. The y axis shows the fraction of its final stellar mass, and the x axis shows lookback time from present day (right-hand side being present day and the left-hand edge representing the Big Bang). The red curve shows the growth of Pegasus W’s stellar mass over time, with the orange shaded region representing the uncertainty on the star formation history.
 

Figure 3: Star formation history for Pegasus W, showing the fraction of its present-day stellar mass at various points in time from the Big Bang (left-hand edge) to present day (right-hand edge). The orange shaded region represents the error on the star formation history, while the grey shaded region represents the epoch of reionisation. Credit: McQuinn et al. 2023

 
The authors note what is most unique about Pegasus W: most ultra-faint dwarfs known to date have very short star formation histories at very early times. That is, most ultra-faint dwarfs formed all their stars at early cosmic times and were quenched (ceased forming stars) over 10 billion years ago. Astronomers believe that this early quenching was likely due to cosmic reionisation, when the hydrogen gas in the universe went from neutral to ionised due to radiation from the first stars and galaxies. However, as Figure 3 shows, Pegasus W does not appear to have quenched during reionisation (indicated by the vertical grey shaded region) and continued forming stars well after!

The puzzle of Pegasus W’s star formation history is likely to generate significant debate amongst astronomers studying galaxy evolution and reionisation. The authors note that better photometric data and perhaps even spectroscopy would help improve the uncertainty on the star formation history measurements, and that JWST is likely to help shed more light on this mystery in coming years.

Original astrobite edited by Isabella Trierweiler.

By Astrobites


About the author, Pratik Gandhi:

I’m a 3rd-year astrophysics PhD student at UC Davis, originally from Mumbai, India. I study galaxy formation and evolution, and am really excited about the use of both simulations and observations in the study of galaxies. I am interested in science communication, teaching, and social issues in academia. Also a huge fan of Star Trek, with Deep Space Nine and The Next Generation being my favourites!


Saturday, January 28, 2023

The Corgi of Exoplanets: Methane Mystery on HAT-P-18b

An artist’s depiction of a transiting exoplanet with an escaping helium tail
Credit:
ESA/Hubble, NASA, M. Kornmesserr, CC BY 4.0

With JWST up and running, astronomers are getting a first look at the quirks of individual exoplanets. Features never before examined are coming into view: for instance, a recent study has revealed that while HAT-P-18b may not have much methane, it does have a tiny tail.


A subsample of the data, orange, and the best-fit model, blue, showing the helium absorption signature. The y-axis is in units of transit depth, meaning enhanced absorption appears as a positive bump. Credit: Fu et al. 2022

JWST Shows Off, Finds a Corgi

Now more than a year past its launch, JWST is finally doing what it was designed to do: collecting photons and wowing astronomers with the precision of its data. One of the earliest flexes of its scientific power occurred last summer, when it trained its attention on the transit of a Jupiter-sized, Saturn-mass exoplanet named HAT-P-18b.

While the team, led by Guangwei Fu (Johns Hopkins University), found several molecules in the upper atmosphere of the planet using the Near Infrared Imager and Slitless Spectrograph (NIRISS) instrument, what they didn’t find was more surprising.

The first of these surprises was a helium absorption signature, but not surrounding the planet: instead, their results indicate that HAT-P-18b is dragging along a faint tail of escaping helium. Similar features have been spotted trailing behind other planets, but this one was so subtle that it was previously missed by ground based observatories. In other words, HAT-P-18b is the corgi of the exoplanets: it has a tail, but it’s not a dominant structure.


The NIRISS data, black, and several possible model atmospheres to explain it, colored on top. The green and red models were produced assuming equilibrium chemistry. The x-axis denotes wavelength, and the ticks range linearly from 0.5 to 2.5 microns. Credit: Fu et al. 2022

But what about methane?

The second surprise concerned a molecule not displaced from the planet, but possibly missing entirely. One of the primary motivations for targeting HAT-P-18b specifically is its position in a uniquely helpful corner of parameter space for modelers working on a methane mystery.

Hot planets with surface temperatures over 1000K are not expected to have any methane in their atmospheres, since thermodynamics at these extreme conditions prefer other species. However, simple models suggest that any worlds cooler than this should show signs of absorption caused by methane molecules in the upper atmosphere intercepting photons with a specific wavelength.

Strangely, however, this prediction has not panned out in previous studies. Searches of several planets that should have held methane turned up none. This tension called for a closer look: were the assumptions baked into the models wrong, or was there something strange about the first worlds surveyed? With an equilibrium temperature of 800K, HAT-P-18b was the perfect target to help move the needle one way or another.

Fu and collaborators made no conclusive methane detection, further deepening the model mismatch puzzle. Models which assume the atmosphere is in chemical equilibrium struggled to reproduce the combination of no-methane, yes-water seen in the data, which suggested that some other mechanism(s) were involved to remove the expected gas. Even more striking, other models which made no assumption about an equilibrium also did not confidently prefer including methane in the final fit over leaving it out entirely. In all, JWST revealed HAT-P-18b to be a strange world, one which subverts our expectations of atmospheric chemistry but charms with a helium tail. We’ll have to wait for JWST observations of other planets before we know just how weird either of those traits truly is.

Citation

“Water and an Escaping Helium Tail Detected in the Hazy and Methane-depleted Atmosphere of HAT-P-18b from JWST NIRISS/SOSS,” Guangwei Fu et al 2022 ApJL 940 L35. doi:10.3847/2041-8213/ac9977

By Ben Cassese


Friday, January 27, 2023

Star on a dangerous path provides regular meals for supermassive black hole


The light-curve of the new source, J0456-20, shows four distinctive phases: The X-ray flux plateau phase lasts about two months and then drops rapidly (by a factor of 100) within one week. A faint X-ray stage follows this for about 2-3 months before it starts the X-ray rising phase again. The whole cycle lasts about 220 days. © MPE


This sketch shows the sequence of events that could explain the evolution of the light curve in J0456-20: A star is partially disrupted when coming close to a supermassive black hole (top). The stellar debris forms an accretion disk (blue), with the accretion proceeding in various stages (1-5) with changing emission signatures. Eventually, the fuel is completely exhausted (6) and no more X-ray flares will be detected. © MPE


eROSITA all-sky survey detects repeating X-ray flares in an otherwise quiescent galaxy.

In the eROSITA all-sky survey, scientists at the Max Planck Institute for Extraterrestrial Physics (MPE) have found an interesting repeating event. In an otherwise quiescent galaxy, an X-ray flare repeats every 220 days, indicating that a star orbiting the central black hole “feeds” the gravity monster on subsequent orbits. Such events could be effective tools to explore the accretion process and the gravity field around supermassive black holes in other galaxies.

Most galaxies harbour a supermassive black hole at their centre, and observations suggest a symbiotic growth of the central black hole and the host galaxy. These studies mainly concentrate on ‘active’ galaxies, i.e., those where the central black hole persistently accretes large amounts of matter, which heats up and shines very brightly. However, these active galaxies (or active galactic nuclei, AGN) are vastly outnumbered by quiescent galaxies, in which it is much harder to infer the presence of the nuclear supermassive black hole.

Occasionally, a star might wander too close to the central black hole in a galaxy and be disrupted by its strong tidal forces, in a so called „tidal disruption event“. These events result in the star losing its material to the black hole, temporarily increasing the fuelling rate of the gravity monster, and producing an X-ray flare as the stellar matter is consumed. Occurring roughly once every 10000 years per galaxy, tidal disruption events are rare, and most observed candidates to-date are one-off events that show only a single flare due to the destruction of the star. Recently, a few transients have been reported that show periodic or repeating flares. These could be due to stars that are fortunate to survive their first encounter. Instead of being disrupted completely, the remnant orbits the supermassive black hole, losing parts of its outer layers and fuelling the black hole with each passage.

Such repeating partial disruption events could be effective tools to explore the accretion process around supermassive black holes”, points out Zhu Liu, the lead author of the study at MPE. “With eROSITA we found a very intriguing repeating nuclear transient in an otherwise quiescent galaxy.”

During its all-sky survey, the eROSITA X-ray telescope observed every position on the sky multiple times, thereby uncovering high-energy transients in galaxies that showed no signatures of prior activity at their centres. The new source, J0456-20, discovered in February 2021, is located in a quiescent galaxy about 1 billion light-years away. It is one of the most variable X-ray sources seen by eROSITA, with the X-ray flux dropping by a factor of 100 within a week. In total, the astronomers observed three complete cycles of repeating X-ray flares from the source, with a recurrence time of around 220 days. Follow-up optical observations showed a typical quiescent galaxy, while the repeating X-ray flares strongly suggest a repeating partial tidal disruption event.

“We estimate that the star orbiting the black hole lost the equivalent of 5%, 1.5% and 0.5% of the mass of our Sun in its first, second, and third visit, respectively”, explains Adam Malyali, a postdoc at MPE. “These losses are small enough that the star could survive several partial disruption episodes.”

Through a collaboration with the Australian ATCA facility, the scientists also discovered transient radio emission from J0456-20, indicating the launch of an outflow of gas or a jet. Together with the characteristic X-ray evolution, there is compelling evidence for changes in the structure of the accretion disk around the supermassive black hole. “More follow-up observations are needed to pin down the exact details of the physical processes,” says Andrea Merloni, eROSITA principal investigator. “Nevertheless, the discovery of this repeating X-ray event already provides solid evidence that there are stars in tightly bound orbits around supermassive black holes beyond our own Milky Way galaxy. These offer ideal laboratories to test General Relativity in the strong field regime.”

eROSITA has already found other repeating X-ray sources, e.g. two quasi-periodic eruptions in AGN. In the future, the scientists expect to discover more events with eROSITA, and the upcoming Einstein Probe mission.


Contacts:

Zhu Liu
postdoc
tel.+49 89 30000-3855
fax.+49 89 30000-3569

liuzhu@mpe.mpg.de

Adam Malyali
postdoc
tel.+49 89 30000-3644
fax.+49 89 30000-3644

amalyali@mpe.mpg.de

Andrea Merloni
Senior Scientist
tel.+49 89 30000-3893
fax.+49 89 30000-3569

am@mpe.mpg.de
Original publication:

Zhu Liu, A. Malyali, M. Krumpe et al.
Deciphering the extreme X-ray variability of the nuclear transient eRASSt J045650.3 A&A, 669, A75

Source / DOI

More Information

eROSITA
eROSITA webpages at MPE

XMM-Newton spies black holes eating the same stars again and again
ESA Press Release


Thursday, January 26, 2023

Astronomers create new microwave map of the Milky Way and beyond


Colour shows the polarized microwave emission measured by QUIJOTE. The pattern of lines superposed shows the direction of the magnetic field lines. Credit: The QUIJOTE Collaboration


An international team of scientists have successfully mapped the magnetic field of our galaxy, the Milky Way, using telescopes that observe the sky in the microwave range. The new research is published in Monthly Notices of the Royal Astronomical Society.

The team used the QUIJOTE (Q-U-I JOint TEnerife) Collaboration, sited at the Teide Observatory on Tenerife in the Canary Islands. This comprises two 2.5 m diameter telescopes, which observe the sky in the microwave part of the electromagnetic spectrum.

Led by the Instituto de Astrofísica de Canarias (IAC), the mapping began in 2012. Almost a decade later, the Collaboration has presented a series of 6 scientific articles, giving the most accurate description to date of the polarization of the emission of the Milky Way at microwave wavelengths. Polarization is a property of transverse waves such as light waves that specifies the direction of the oscillations of the waves and signifies the presence of a magnetic field.

The studies complement earlier space missions dedicated to the study of the cosmic microwave background radiation (CMB), the fossil radiation left behind by the Big Bang, which gave a detailed insight into the early history of the cosmos.

As well as mapping the magnetic structure of the Milky Way, the QUIJOTE data has also proved useful in other scenarios. The new data are also a unique tool for studying the anomalous microwave emission (AME), a type of emission first detected 25 years ago. AME is thought to be produced by the rotation of very small particles of dust in the interstellar medium, which tend to be oriented by the presence of the galactic magnetic field.

The new results allowed the team to obtain information about the structure of the magnetic field of the Milky Way, as well as helping to understand the energetic processes which took place close to the birth of the Universe. To measure signals from that time, scientists need to first eliminate the veil of emission associated with our own Galaxy. The new maps provided by QUIJOTE do just that, allowing us to better understand these elusive signals from the wider Universe.

The maps from QUIJOTE have also permitted the study of a recently detected excess of microwave emission from the centre of our Galaxy. The origin of this emission is currently unknown, but it could be connected to the decay processes of dark matter particles. With QUIJOTE, the team have confirmed the existence of this excess of radiation, and have found some evidence that it could be polarized.

Finally, the new maps from QUIJOTE have permitted the systematic study of over 700 sources of emission in radio and microwaves, of both Galactic and extragalactic origin, meaning that the data is helping scientists to decipher signals coming from beyond our galaxy, including the cosmic microwave background radiation.

“These new maps give a detailed description in a new frequency range, from 10 to 40 GHz, complementing those from space missions such as Planck and WMAP”, comments José Alberto Rubiño, lead scientist of the QUIJOTE Collaboration. “We have characterized the synchrotron emission from our Galaxy with unprecedented accuracy. This radiation is the result of the emission by charged particles moving at velocities close to that of light within the Galactic magnetic field. These maps, the result of almost 9,000 hours of observation, are a unique tool for studying magnetism in the universe” he adds.

“One of the most interesting results we have found is that the polarized synchrotron emission from our Galaxy is much more variable than had been thought” comments Elena de la Hoz, a researcher at the Instituto de Física de Cantabria (IFCA). “The results we have obtained are a reference to help future experiments make reliable detections of the CMB signal” she adds.

“Scientific evidence suggests that the Universe went through a phase of rapid expansion, called inflation, a fraction of a second after the Big Bang. If this is correct, we would expect to find some observable consequences when we study the polarization of the cosmic microwave background. Measuring those expected features is difficult, because they are small in amplitude, but also because they are less bright than the polarized emission from our own galaxy.” notes Rubiño, “However, if we finally measure them, we will have indirect information of the physical conditions in the very early stages of our Universe, when the energy scales were much higher than those that we can access or study from the ground. This has enormous implications for our understanding of fundamental physics.”

“The maps from QUIJOTE have also permitted the study of the microwave emission from the centre of our Galaxy. Recently an excess of microwave emission has been detected from this region, whose origin is unknown, but whose origin could be connected to the decay processes of dark matter particles. With QUIJOTE we have confirmed the existence of this excess of radiation, and have found some evidence that it could be polarized” comments Federica Guidi, a researcher at the Institut d'Astrophysique de Paris (IAP, Francia).


Media contacts:

Gurjeet Kahlon
Royal Astronomical Society
Mob: +44 (0)7802 877700

press@ras.ac.uk

Dr Robert Massey
Royal Astronomical Society
Mob: +44 (0)7802 877699

press@ras.ac.uk

Science Contacts:

Professor Jose Alberto Rubino-Martin
Institute of Astrophysics of the Canary Islands

jalberto@iac.es

Dr Denis Tramonte
Purple Mountain Observatory

tramonte@pmo.ac.cn

Dr Federica Guidi
Paris Institute of Astrophysics

federica.guidi@iap.fr

Dr Frederick Poidevin
Institute of Astrophysics of the Canary Islands

fpoidevin@iac.es

Elena de la Hoz
The Institute of Physics of Cantabria/Unican

delahoz@ifca.unican.es

Dr Diego Herranz
The Institute of Physics of Cantabria

herranz@ifca.unican.es


Further information

The QUIJOTE (Q-U-I JOint TEnerife) CMB Experiment is a scientific collaboration between the Instituto de Astrofísica de Canarias (Tenerife, Spain), the Instituto de Física de Cantabria (Santander, Spain), the Departamento de Ingenieria de COMunicaciones (Santander, Spain), the Jodrell Bank Observatory (Manchester, UK), the Cavendish Laboratory (Cambridge, UK), and the IDOM company (Spain). It started operations in November 2012, and it consists in two telescopes and three instruments dedicated to measure the polarization of the microwave sky in the frequency range between 10 GHz and 40GHz, and at angular scales of one degree.

The work appears in ‘
QUIJOTE scientific results – IV. A northern sky survey in intensity and polarization at 10–20 GHz with the Multi-Frequency Instrument’, Rubiño-Martin et al., published in Monthly Notices of the Royal Astronomical Society, in press.

The press release includes information obtained from 5 other papers:
Notes for editors

The Royal Astronomical Society (RAS), founded in 1820, encourages and promotes the study of astronomy, solar-system science, geophysics and closely related branches of science. The RAS organises scientific meetings, publishes international research and review journals, recognises outstanding achievements by the award of medals and prizes, maintains an extensive library, supports education through grants and outreach activities and represents UK astronomy nationally and internationally. Its more than 4,000 members (Fellows), a third based overseas, include scientific researchers in universities, observatories and laboratories as well as historians of astronomy and others.

The RAS accepts papers for its journals based on the principle of peer review, in which fellow experts on the editorial boards accept the paper as worth considering. The Society issues press releases based on a similar principle, but the organisations and scientists concerned have overall responsibility for their content.


Wednesday, January 25, 2023

Direct Imaging Uncovers a Giant Planet-Like Brown Dwarf in the Hyades Cluster


Figure 1: Image of the brown dwarf HIP 21152 B, discovered as the companion of the star HIP 21152. The star mark and arrow indicate the positions of the host star and HIP 21152 B, respectively. The host star is masked in the image. HIP 21152 is a young Sun-like star, about 750 million years old, and belongs to the Hyades Cluster, one of the nearest open clusters, located 160 light-years away in the direction of the constellation Taurus. As a group of young stars born at almost the same time, the Hyades Cluster is an important research target for studying the evolution of stars and planets, and has attracted the attention of many astronomers. HIP 21152 B is the first confirmed example of a directly-imaged brown dwarf companion in the Hyades cluster. Click here to see a movie of three imaging observations taken from October 2020 to October 2021. Credit: Astrobiology Center

A brown dwarf orbiting the Sun-like star HIP 21152 was discovered using the Subaru Telescope's Extreme Adaptive Optics System. HIP 21152 B was found to be the lightest brown dwarf with an accurately determined mass, approaching the mass of a giant planet. HIP 21152 B is expected to be a benchmark object for the study of the evolution of giant planets and brown dwarfs and their atmospheres.

Brown dwarfs (Note 1) are an interesting type of objects that is intermediate between a star and a planet in terms of mass and not found in our Solar System. They are also useful for studying the evolution and the atmosphere of giant planets, because Jupiter-like planets and lighter brown dwarfs are expected to have similar characteristics.

Brown dwarfs drift alone in space or orbit around stars. While thousands of brown dwarfs have been found since the first discovery in 1995, companion-type brown dwarfs are rare, with a frequency of only a few per 100 stars. For this reason, astronomers have tried to establish an efficient way to find companion brown dwarfs.

An international team including astronomers from the Astrobiology Center; the National Astronomical Observatory of Japan; Tokyo Institute of Technology; the University of California, Santa Barbara; and NASA has developed a new method to efficiently discover companion brown dwarfs and giant planets. Furthermore, they applied that method to imaging surveys with the Subaru Telescope. This search adopts information on the "proper motion" of stars in our Galaxy, which is the motion of stars with their own unique velocities. When a companion object orbits a star, the proper motion of the host star is accelerated by the gravity from the companion. However, the acceleration caused by a brown dwarf or planet is very small, making it challenging to measure the change precisely.

However, a turning point came with ESA's astrometry satellite Gaia (Note 2), the successor to the Hipparcos satellite. The calculation of the difference between the measurements from the two satellites now allows for deriving minute accelerations in proper motion (Figure 2 left). Using data from both telescopes, the research team analyzed the acceleration of proper motion for stars near the Sun, and selected stars that may be accompanied by giant planets or brown dwarfs. They then proceeded with direct imaging observations using Subaru Telescope's high contrast instruments, SCExAO and CHARIS, leading to the discovery of a brown dwarf "HIP 21152 B" orbiting the star HIP 21152.


Figure 2: (Left) Schematic of the acceleration of proper motion. If a companion is present around a star, it’s gravity accelerates the proper motion of the star, causing a difference in the proper motion measurements between the Hipparcos and Gaia satellites. (Right) Orbit modeling of HIP 21152 B. The open circles and blue circles indicate the predicted and observed positions of HIP 21152 B in the numbered years, respectively. The thick black oval shows the best-fit orbit. Other thin ovals represent other possible orbits, which are color-coded by the derived mass of HIP 21152 B. A magnified view of the area around the observed locations is shown in the lower left. Credit: Astrobiology Center

The team determined the orbit of HIP 21152 B using a combination of a total of four direct imaging observations by the Subaru Telescope and Keck Telescope, line-of-sight velocities of the host star measured by HIDES on the Okayama 188-cm Reflector Telescope, and the proper motion data from Gaia and Hipparcos. The companion's mass is derived from the orbit, as indicated by Kepler's law. The actual orbital analysis (Figure 2, right) determined the mass of HIP 21152 B to be 22-36 Jupiter masses. Brown dwarfs with such accurately determined masses are rare (Note 3). HIP 21152 B was also found to be the lightest brown dwarf among those with accurately determined masses, approaching planetary masses (Note 4).

HIP 21152 B will help characterize the atmospheres of brown dwarfs and giant planets. The team also obtained the spectrum of HIP 21152 B (Figure 3), showing that its atmospheric characteristics can be classified as being in the transition stage between two brown dwarf spectral types, L-type and T-type. Strong absorption from methane is shown in the atmosphere of a T-type brown dwarf, while an L-type brown dwarf shows little of it in the atmosphere. This spectral transition is strongly related to atmospheric temperature and the presence of clouds. Interestingly, the well-known directly-imaged planets around HR 8799 show a similar spectrum. In this respect, it is again crucial that the most fundamental characteristics of HIP 21152 B, namely its mass and age, are accurately determined. Masayuki Kuzuhara, a project assistant professor at the Astrobiology Center, who led the research, says, "This result can provide an important clue to understand the atmospheres of giant planets and brown dwarfs based on how and when they show atmospheric characteristics similar to those seen in the planets of the HR 8799 system and HIP 21152 B. It is expected that HIP 21152 B will play an important role as a benchmark for future progress in astronomy and planetary science."


Figure 3: Spectrum of HIP 21152 B obtained with SCExAO and CHARIS on the Subaru Telescope (blue line). Wavelengths where absorption by water vapor and methane occur are indicated by the horizontal lines above (Note 5). The absorption by those molecules in the atmosphere of HIP 21152 B produces concavities in the spectrum. Credit: Astrobiology Center

As this observation project is still ongoing, even more discoveries are expected. The Subaru Telescope's direct imaging instruments continue to be improved, making new observational capabilities ready for science operation. With the progress in the efficient exploration and the development and improvement of Subaru Telescope's instruments, various important discoveries will continue to be made in the future.

These results were published in the Astrophysical Journal Letters on July 27, 2022 (Kuzuhara et al., "Direct-imaging Discovery and Dynamical Mass of a Substellar Companion Orbiting an Accelerating Hyades Sun-like Star with SCExAO/CHARIS".) It was also featured in AAS Nova, which highlights outstanding research in the AAS journals (Featured Image: First Images of a Substellar Companion in the Hyades).


Notes:

(Note 1) There are several ways to define a "brown dwarf" but the most generally accepted is objects with masses as high as 13 and 80 times that of Jupiter. Objects with such masses do not fuse hydrogen (unlike stars) but do fuse deuterium (unlike planets). In contrast, heavy planets and light brown dwarfs are very similar, and it is thought that there is no need to distinguish between them except for their mass.

(Note 2) Gaia is a space telescope launched in 2013 for high-precision astrometry. It measures distances and proper motions of about one billion astronomical objects with unprecedented precision.


(Note 3) So far, the main method used to estimate the mass of brown dwarfs has been the "evolutionary models," which predict the luminosity and temperature of a brown dwarf as it ages. Then the observed luminosity and temperature are used to determine the mass of the brown dwarf using these models. However, this method could result in an inaccurate estimation of mass due to uncertainties in the evolutionary model and the age (usually, a brown dwarf is assumed to be as young as its host star or the associated cluster). HIP 21152 B belongs to the Hyades cluster, so its age is accurately determined, but the evolutionary model remains uncertain. The evolutionary model inferred mass of HIP 21152 B is 1.3 times larger than the mass determined from the orbital analysis.

(Note 4) A European team independently imaged HIP 21152 B (myScience article). Meanwhile, the study led by Kuzuhara is the first to prove that HIP 21152 B orbits its host star and to derive its dynamical mass. Very recently, a U.S. team also reported the independent detection of HIP 21152 B.

(Note 5) The absorption wavelengths of the molecules are displayed based on the web tool provided by the University of Geneva.

Relevant Links


Tuesday, January 24, 2023

Webb Unveils Dark Side of Pre-stellar Ice Chemistry

Chamaeleon I Molecular Cloud (NIRCam Image)
Credits: Image: NASA, ESA, CSA
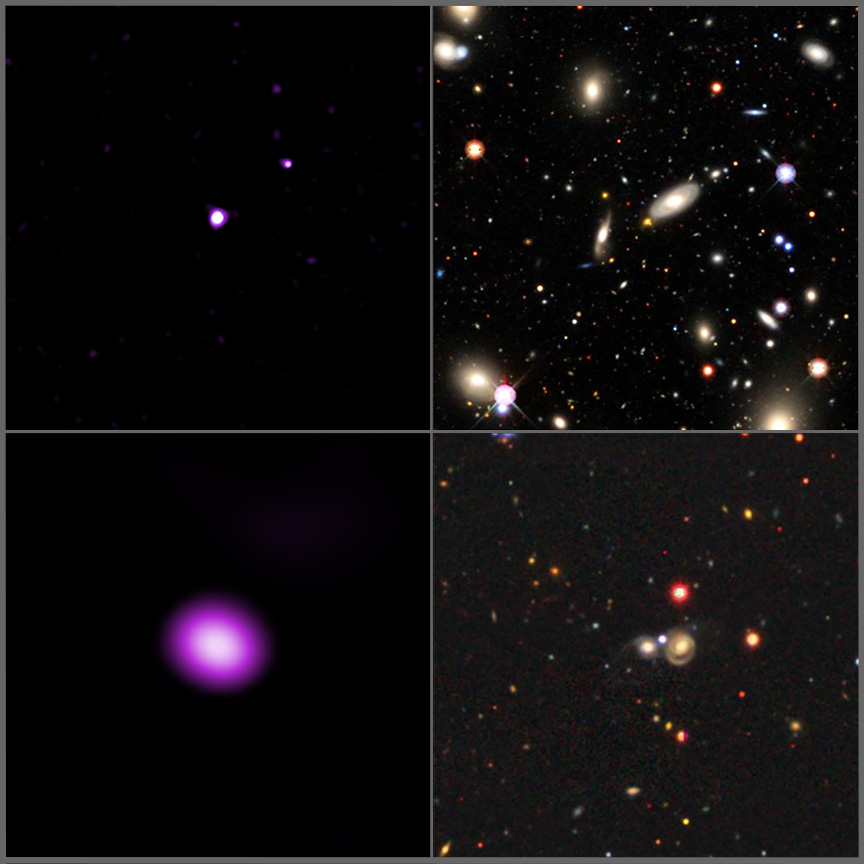
Science: Fengwu Sun (Steward Observatory), Zak Smith (The Open University), IceAge ERS Team
Image Processing: M. Zamani (ESA/Webb)


Chamaeleon I Dark Cloud (NIRCam, NIRSpec, and MIRI Spectra)
Credits: Illustration: NASA, ESA, CSA, Joseph Olmsted (STScI)
Science: Klaus Pontoppidan (STScI), Nicolas M. Crouzet (LEI), Zak Smith (The Open University), Melissa McClure (Leiden Observatory)


If you want to build a habitable planet, ices are a vital ingredient because they are the main source of several key elements — namely carbon, hydrogen, oxygen, nitrogen, and sulfur (referred to here as CHONS). These elements are important ingredients in both planetary atmospheres and molecules like sugars, alcohols, and simple amino acids.

An international team of astronomers using NASA’s James Webb Space Telescope has obtained an in-depth inventory of the deepest, coldest ices measured to date in a molecular cloud. In addition to simple ices like water, the team was able to identify frozen forms of a wide range of molecules, from carbonyl sulfide, ammonia, and methane, to the simplest complex organic molecule, methanol. (The researchers considered organic molecules to be complex when having six or more atoms.) This is the most comprehensive census to date of the icy ingredients available to make future generations of stars and planets, before they are heated during the formation of young stars.

“Our results provide insights into the initial, dark chemistry stage of the formation of ice on the interstellar dust grains that will grow into the centimeter-sized pebbles from which planets form in disks,” said Melissa McClure, an astronomer at Leiden Observatory in the Netherlands, who is the principal investigator of the observing program and lead author of the paper describing this result. “These observations open a new window on the formation pathways for the simple and complex molecules that are needed to make the building blocks of life.”

In addition to the identified molecules, the team found evidence for molecules more complex than methanol, and, although they didn't definitively attribute these signals to specific molecules, this proves for the first time that complex molecules form in the icy depths of molecular clouds before stars are born.

“Our identification of complex organic molecules, like methanol and potentially ethanol, also suggests that the many star and planetary systems developing in this particular cloud will inherit molecules in a fairly advanced chemical state,” added Will Rocha, an astronomer at Leiden Observatory who contributed to this discovery. “This could mean that the presence of precursors to prebiotic molecules in planetary systems is a common result of star formation, rather than a unique feature of our own solar system.”

By detecting the sulfur-bearing ice carbonyl sulfide, the researchers were able to estimate the amount of sulfur embedded in icy pre-stellar dust grains for the first time. While the amount measured is larger than previously observed, it is still less than the total amount expected to be present in this cloud, based on its density. This is true for the other CHONS elements as well. A key challenge for astronomers is understanding where these elements are hiding: in ices, soot-like materials, or rocks. The amount of CHONS in each type of material determines how much of these elements end up in exoplanet atmospheres and how much in their interiors.

"The fact that we haven't seen all of the CHONS that we expect may indicate that they are locked up in more rocky or sooty materials that we cannot measure,” explained McClure. “This could allow a greater diversity in the bulk composition of terrestrial planets.

Chemical characterization of the ices was accomplished by studying how starlight from beyond the molecular cloud was absorbed by icy molecules within the cloud at specific infrared wavelengths visible to Webb. This process leaves behind chemical fingerprints known as absorption lines which can be compared with laboratory data to identify which ices are present in the molecular cloud. In this study, the team targeted ices buried in a particularly cold, dense, and difficult-to-investigate region of the Chamaeleon I molecular cloud, a region roughly 500 light-years from Earth which is currently in the process of forming dozens of young stars.

“We simply couldn't have observed these ices without Webb,” elaborated Klaus Pontoppidan, Webb project scientist at the Space Telescope Science Institute in Baltimore, Maryland, who was involved in this research. “The ices show up as dips against a continuum of background starlight. In regions that are this cold and dense, much of the light from the background star is blocked, and Webb’s exquisite sensitivity was necessary to detect the starlight and therefore identify the ices in the molecular cloud.”

This research forms part of the Ice Age project, one of Webb's 13 Early Release Science programs. These observations are designed to showcase Webb’s observing capabilities and to allow the astronomical community to learn how to get the best from its instruments. The Ice Age team has already planned further observations, and hopes to trace out the journey of ices from their formation through to the assemblage of icy comets. “This is just the first in a series of spectral snapshots that we will obtain to see how the ices evolve from their initial synthesis to the comet-forming regions of protoplanetary disks,” concluded McClure. “This will tell us which mixture of ices — and therefore which elements — can eventually be delivered to the surfaces of terrestrial exoplanets or incorporated into the atmospheres of giant gas or ice planets.”

These results were published in the Jan. 23 issue of Nature Astronomy.

The James Webb Space Telescope is the world's premier space science observatory. Webb will solve mysteries in our solar system, look beyond to distant worlds around other stars, and probe the mysterious structures and origins of our universe and our place in it. Webb is an international program led by NASA with its partners, ESA (European Space Agency) and the Canadian Space Agency.


About This Release

Credits: Media Contact:

Bethany Downer
European Space Agency, Paris, France

Christine Pulliam
Space Telescope Science Institute, Baltimore, Maryland


Permissions: Content Use Policy

Contact Us: Direct inquiries to the News Team.

Related Links and Documents


Monday, January 23, 2023

Discovery of the Largest-class Monster Supercluster of Galaxies in the Universe 5.5 Billion Light-Years Away


Figure 1: This color composite image of a supercluster was captured by the Subaru Telescope's prime focus camera. The white contours in the center show the density distribution of galaxies, and the red regions indicate intense concentrations of dark matter. The numbered squares depict the locations of galaxy clusters associated with the supercluster. The surrounding panels are magnified views of these 19 clusters, showing the clusters of red galaxies that are common in galaxy clusters. The moon in the upper left depicts the apparent size of the full moon to provide a sense of scale. (Credit: NAOJ)

A team led by the National Astronomical Observatory of Japan (NAOJ) and Hiroshima University has discovered a massive supercluster of galaxies about 5.5 billion light-years away, based on the Big Data from the Subaru Telescope. Not only is there a strong concentration of galaxies and dark matter across an area of the sky roughly the size of 15 full moons, but there are at least 19 galaxy clusters associated with it, making it the largest supercluster ever identified in the Universe beyond 5 billion light years away.

Galaxies are comprised of gas and countless stars; and galaxy clusters, which are amalgamations of such galaxies, are known as the largest gravitationally-bound structures in the Universe. However, there is a still larger structure in the Universe called a supercluster, which develops after galaxy clusters further assemble. While superclusters extend over an area of about 100 megaparsecs (about 500 times the size of the Milky Way), the definition of a supercluster itself is still ambiguous; its true nature and what is going on inside it are still shrouded in mystery. In fact, the Milky Way is also inside the Laniakea supercluster, consisting of multiple galaxy clusters and superclusters (Note 1).

Hyper Suprime-Cam (HSC) on the Subaru Telescope has made a deep, wide-field survey, equivalent to 4,400 times the apparent size of the full moon, reaching over 10 billion light-years. The high-quality imaging data obtained from this program is currently the best resource for searching for unknown galaxy superclusters.

The research team examined the total stellar mass and dark matter distribution in the largest density excesses among the nearly 100 supercluster candidates (Note 2), which were discovered by the same team in the past (Note 3). As a result, the team detected a supercluster structure consisting of at least 19 clusters of galaxies centered on three dark matter-dense regions (Figure 1).

Comparison with cosmological simulations suggests that this supercluster has a dark matter mass about 10 times the mass of the Virgo supercluster in the local Universe. On top of that, two giant structures equivalent to superclusters have been identified immediately outside of the cluster, which means that the discovered supercluster may be a precursor to supermassive structures such as the Laniakea supercluster, the largest in the nearby Universe.

The lead author, Dr. Rhythm Shimakawa, Project Assistant Professor at NAOJ, says, "Indeed, the probability of finding such a supercluster about 5.5 billion light-years away, was 50-50 based on the data from the Subaru Telescope's strategic program. We plan to further investigate the three-dimensional structure and the morphology of the galaxies by using such instruments as Subaru Telescope’s PFS (wide field spectrograph) and the Euclid space telescope in the near future."

These results appeared as Shimakawa et al. "King Ghidorah Supercluster: Mapping the light and dark matter in a new supercluster at z = 0.55 using the Subaru Hyper Suprime-Cam" in Monthly Notices of the Royal Astronomical Society Letters on November 26, 2022.

Notes:

(Note 1) It is known that our Milky Way is located inside the Virgo supercluster, the core of which is composed of the Virgo cluster. The definition of a supercluster itself is still ambiguous, and thus in some cases, the term "supercluster" is also used to refer to a giant structure that envelops smaller superclusters.

(Note2) The distribution of dark matter was obtained using the weak gravitational lensing effect. The gravitational lensing effect is a phenomenon in which light emitted from distant galaxies appears distorted or brightened due to the bending of the light path when it passes through a strong gravitational field such as a galaxy cluster in the foreground. Weak gravitational lensing refers to relatively weak cases of this phenomenon. The supercluster in this study is the largest structure over 5 billion light-years away ever identified by weak gravitational lensing analysis.

(Note 3) "Subaru Hyper Suprime-Cam excavates colossal over- and underdense structures over 360 deg2 out to z = 1", Shimakawa et al, 2021, MNRAS


Friday, January 20, 2023

Knock, Knock. Who’s There? A Free-Floating Planet! Knock, Knock. Who’s There?

An illustration of a free-floating planet
Credit: NASA’s Goddard Space Flight Center Conceptual Image Lab

Title: Formation History of HD106906 and the Vertical Warping of Debris Disks by an External Inclined Companion
Authors: Nathaniel Moore et al.
First Author’s Institution: Georgia Institute of Technology
Status: Accepted to ApJ


When early astronomers theorized how planets formed, they often used the solar system as a model, mainly because that was all we had observationally available at the time. The thing is, the solar system is pretty “well behaved” — the planets are more or less in the same orbital plane, and their orbits are not too eccentric (i.e., they are closer to being circles than ellipses). However, as more exoplanets are found, astronomers begin to question their ideas for how planets formed. The binary system HD 106906, for example, has an asymmetrical debris disk and a planet that is not in the same plane as the disk and is separated from the stars by 730 astronomical units (au; for reference, Earth is 1 au away from the Sun). This system has an unusual architecture, and the authors of today’s article try to theorize how this system formed. Understanding the formation of an usual system like this one allows us to expand our knowledge of planet formation beyond the simplicity of such well-behaved systems such as our own!

There are two main theories for the formation of planets: core accretion and gravitational instability (also called the gas-collapse model). Figure 1 shows the two different scenarios. In both cases, the planets form in a protoplanetary disk, which means that the planets initially start in the same orbital plane. A system like HD 106906 challenges this notion, since it has a very massive planet far away from the disk and in a different orbital plane. The authors of this article explore the idea that the planet HD 106906 b actually formed from the disk, but a recent (about 1–5 million years ago) close encounter with a free-floating planet knocked the planet away from the disk into an eccentric orbit, and the interactions from this close encounter actually caused the disk to become more eccentric as well. The authors explore this idea using N-body simulations (a simulation of how bodies interact over a period of time) of the system combined with simulations of how the observational data would look for this scenario. They then compare the simulations to real observations.


Figure 1. The two possible scenarios for planet formation: accretion model (“bottom-up”) and gravitational instability (“top-down”). Click to enlarge. Credit: NASA and A. Feild (STScI); CC BY 4.0

Companion and Disk Interactions

The authors first try to determine whether the HD 106906 system has been like this for a long time or if its current configuration is the result of a recent event. To do this, they simulate different variations of the planet’s eccentricity, inclination, and semi-major axis. For the simulations, they include the effects of radiation pressure. They also use two different central body configurations: one with a binary star system and another with a single central body and an extra J2 potential term, which emulates the binary system but is more computationally efficient. The main results from these simulations are shown in Figure 2.


Figure 2: The simulations at 1 million years (top left), 5 million years, (bottom left) and 10 million years (bottom right) compared to the Crotts et al. 2021 original observations. After a million years, the simulated disk is very similar to the real image. By 5 and 10 million years, the appearance (size and brightness) of the disk exceeds the observational constraints. Credit: Moore et al. 2023

The simulations lead the authors to conclude that the disk and planet have likely been in this configuration for only 1–5 Myr, which for the system’s age of 13 Myr is quite recent. If it had been there for longer than that, the simulations for 5 and 10 Myr would have been within the observational constraints from the real data.


Figure 3: The free-floating planet, represented in red, can simply “fly by” the system, leaving the original configuration mostly unchanged; be exchanged with the original planet (blue), which then gets ejected; or be captured into the system. Credit: Moore et al. 2023

Knock, Knock. Who’s There?

Next, the authors simulate a close encounter between a 11±1 Jupiter-mass free-floating planet and the native planet of the HD 106906 system to see if this can cause the system’s current arrangement. Figure 3 shows the possible outcomes of simulations of this (un)expected visit. The authors simulate 100,000 initial conditions and see their outcomes. These 100,000 conditions are obtained such that the closest approach distance of the planets is less than 50 au (if it winds up being more than that, the initial condition is rejected).

The team’s final results are shown in Figure 4. From the figure, we can see that a few outcomes in which either the free-floating planet stays in the system or the native planet stays in the system agree with observations. The authors conclude that an encounter with a free-floating planet is a possible explanation for the current architecture of this system. The close encounter only reproduces observational results 0.2% of the time, but this system is quite unusual — so a low probability of a system forming like this is expected!


Figure 4: The final results of the close encounter simulations of the free-floating planet and the HD 106906 system. The dots within the dashed square fall within the expected observational constraints of the companion (i.e., that agree with current estimates for the orbital eccentricity, semi-major axis, and inclination of the companion). The blue dots represent the outcomes that agree with observations where the native planet remains bound to the system. The red dots represent the outcomes where the free-floating planet remains bound to the system. The gray dots represent the other parameters of the 100,000 simulations. Credit: Moore et al. 2022

By Astrobites

Original astrobite edited by H Perry Hatchfield.


About the author, Clarissa Do O:

I am a third-year physics graduate student at UC San Diego. I study exoplanet orbital dynamics and also work on exoplanet instrumentation. My current work is on the adaptive optics upgrade of the Gemini Planet Imager 2.0, an instrument that aims to directly image and characterize exoplanets.


Thursday, January 19, 2023

Study finds active galactic nuclei are even more powerful than thought

An artist’s impression of what the dust around a quasar might look like from a light year away
Credit: Peter Z. Harrington
Licence type:
Attribution (CC BY 4.0)

A new study indicates that scientists have substantially underestimated the energy output of active galactic nuclei by not recognising the extent to which their light is dimmed by dust. The work is published in Monthly Notices of the Royal Astronomical Society.

Powered by supermassive black holes swallowing matter in the centres of galaxies, active galactic nuclei are the most powerful compact steady sources of energy in the universe. The brightest active galactic nuclei have long been known to far outshine the combined light of the billions of stars in their host galaxies. Although the possibility of dust dimming the light from active galactic nuclei has been recognised for a long time, the amount has been considered controversial and was widely believed to be negligible.

Now, the new research reveals that the energy output of active galactic nuclei is underestimated. The team reached this conclusion by studying the reddening effect of dust on the light fromone of the most well-studied active galactic nuclei, known as NGC 5548. Just as the Earth’s atmosphere makes the Sun appear redder as well as dimmer at sunset, so dust in active galactic nuclei also makes them appear redder than they really are. The amount of reddening correlates with the amount of dimming.

Scientists quantify the colours of an object by measuring the ratios of the intensity of its light at different wavelengths. While we know what the unreddened colour of the Sun is, there has been much debate over the unreddened colours of the various types of emission from active galactic nuclei. This is because, although simple theories predict the intrinsic, unreddened colours, there were doubts about whether these simple theories applied to active galactic nuclei.

In the new study of NGC 5548, the UCSC researchers used seven different indicators of the amount of dust and found them all to be in good agreement. Furthermore, the dimming of NGC 5548 due to dust was found to be large, more than ten times the dimming caused by dust as we look out of our own galaxy, the Milky Way.

The colours of NGC 5548 are typical of other active galactic nuclei, which has wide- ranging implications. Because of the dimming effects of dust, active galactic nuclei are even more powerful than had been realised. The results imply that in the ultraviolet, where most of the energy is radiated, a typical active galactic nucleus is putting out an order of magnitude more energy than previously thought.

Another implication is that active galactic nuclei are very similar, and what had hitherto been thought to be major fundamental differences between them are really just the consequences of different amounts of reddening by dust.

“When there are intervening small particles along our line of sight, this makes things behind them look dimmer. We see this at sunset on any clear day when the sun looks fainter,” said Dr Martin Gaskell, a research associate in astronomy and astrophysics at UC Santa Cruz and lead author of the paper. “The good agreement between the different indicators of the amount of reddening was a pleasant surprise,” said Gaskell. “It strongly supports simple theories of emission from active galactic nuclei. Exotic explanations of colours are not needed. This makes life simpler for researchers and is speeding up our understanding of what happens as black holes swallow material,” Gaskell said.


Media contacts:

Gurjeet Kahlon
Royal Astronomical Society
Mob: +44 (0)7802 877700

press@ras.ac.uk

Dr Robert Massey
Royal Astronomical Society
Mob: +44 (0)7802 877699

press@ras.ac.uk

Science contacts:

Dr Martin Gaskell
University of California Santa Cruz

mgaskell@ucsc.edu


Further information

Gaskell’s co-authors—Frances Anderson (now at Harvey Mudd College), Sufia Birmingham (now at Princeton University), and Samhita Ghosh (now at UC Berkeley)—worked on thisproject as high school seniors participating in the UCSC Science Internship Program.

The work appears in ‘Estimating reddening of the continuum and broad-line region of active galactic nuclei: the mean reddening of NGC 5548 and the size of the accretion disc ’, Gaskell et al., published in Monthly Notices of the Royal Astronomical Society, in press.

Notes for editors

The Royal Astronomical Society (RAS), founded in 1820, encourages and promotes the study of astronomy, solar-system science, geophysics and closely related branches of science. The RAS organises scientific meetings, publishes international research and review journals, recognises outstanding achievements by the award of medals and prizes, maintains an extensive library, supports education through grants and outreach activities and represents UK astronomy nationally and internationally. Its more than 4,000 members (Fellows), a third based overseas, include scientific researchers in universities, observatories and laboratories as well as historians of astronomy and others.

The RAS accepts papers for its journals based on the principle of peer review, in which fellow experts on the editorial boards accept the paper as worth considering. The Society issues press releases based on a similar principle, but the organisations and scientists concerned have overall responsibility for their content.


Wednesday, January 18, 2023

XBONGS: Astronomers Dig Out Buried Black Holes With NASA's Chandra

SDSS J011522.18+001518.5 - SDSS J155627.74+241758.9
Credit: X-ray: NASA/CXC/SAO/D. Kim et al.; Optical/IR: Legacy Surveys/D. Lang (Perimeter Institute)


This panel of images represents a survey that used data from NASA’s Chandra X-ray Observatory to uncover hundreds of previously “hidden” black holes. This result helps astronomers conduct a more accurate census of supermassive black holes that exist in the centers of most large galaxies, as reported in our latest press release.

This graphic shows two of the galaxies from the new study, with Chandra X-ray data in purple and optical data from the Sloan Digital Sky Survey (SDSS) in red, green and blue. These black holes were found in galaxies that are dim in optical light, but bright in X-rays. Astronomers have dubbed these “XBONGs” (for X-ray bright, optically normal galaxies). While scientists have been aware of XBONGs for several decades, an explanation for their unusual properties has been unclear.

Labeled X-ray and optical images of SDSS J011522.18+001518.5 and SDSS J155627.74+241758.9
Credit: X-ray: NASA/CXC/SAO/D. Kim et al.; Optical/IR: Legacy Surveys/D. Lang (Perimeter Institute)

The team made this advance by comparing data from the Chandra Source Catalog — an online public repository of data from the mission’s first 15 years — with those from SDSS. Chandra’s sharp images, matching the quality of those from SDSS, and the large amount of data in the Chandra Source Catalog made it possible for the researchers to detect 817 XBONG candidates — more than ten times the number known before Chandra was in operation. Further study revealed that about half of these XBONGs represent a population of previously-hidden black holes.

The black holes in this study belong to the “supermassive” category, meaning they contain millions or even billions of times the mass of the Sun. Their presence can be revealed by radiation from material they are actively pulling in as they grow, but some of these black holes are enshrouded by material that blocks most light from escaping. X-rays are particularly useful to search for rapidly growing black holes because material swirling around them is superheated to millions of degrees that glow strongly in X-ray wavelengths. A thick cocoon of gas and dust surrounding a black hole will block most or all the light at optical wavelengths. X-rays, however, pass through the cocoon much more easily to be detected by Chandra.

The X-ray sources in this new study are so bright that almost all of them must be from material surrounding rapidly growing supermassive black holes. Data from NASA's Wide-Field Infrared Survey Explorer provides additional evidence that about half of the XBONGs are buried, growing supermassive black holes. These black holes range in distances between 550 million and 7.8 billion light-years from Earth.

Labeled X-ray and optical images of SDSS J102155.55+344103.2.
Credit: X-ray: NASA/CXC/SAO/D. Kim et al.; Optical/IR: Legacy Surveys/D. Lang (Perimeter Institute)

These results were presented by Dong-Woo Kim of the Center for Astrophysics | Harvard & Smithsonian at the 241st meeting of the American Astronomical Society in Seattle, WA. Other members of the research team included Amanda Malnati, an undergraduate at Smith College, and Alyssa Cassidy, a graduate student at the University of British Columbia.

NASA's Marshall Space Flight Center manages the Chandra program. The Smithsonian Astrophysical Observatory's Chandra X-ray Center controls science operations from Cambridge, Massachusetts, and flight operations from Burlington, Massachusetts.


Fast Facts for SDSS J011522.18+001518.5:

Scale: X-ray image is about (2.1 million light-years) across.
Category:
Normal Galaxies & Starburst Galaxies, Black Holes
Coordinates (J2000): RA 1h 15m 22.2s | Dec +00° 15´ 18.6"
Constellation:
Cetus
Observation Date: Nov 1, 2002
Observation Time: hours 27 minutes
Obs. ID: 3204
Instrument:
ACIS
References: Kim, D. et al., AAS Meeting #241, 2023, id, 408.03.
Color Code: X-ray: purple; Optical/IR: red, green, blue
Distance Estimate: About 4.2 billion light-years (z=0.3902)


Fast Facts for SDSS J155627.74+241758.9:

Scale: X-ray image is about (1.3 million light-years) across.
Category:
Normal Galaxies & Starburst Galaxies, Black Holes
Coordinates (J2000): RA 15h 56m 27.7s | Dec +24° 17´ 59.0"
Constellation:
Serpens
Observation Date: Apr 12, 2003
Observation Time: hours 34 minutes
Obs. ID: 3984
Instrument:
ACIS
References: Kim, D. et al., AAS Meeting #241, 2023, id, 408.03.
Color Code: X-ray: purple; Optical/IR: red, green, blue
Distance Estimate: About 1.5 billion light-years (z=0.1182)