Showing posts with label Planetary Atmospheres/Weather. Show all posts

Tuesday, June 10, 2025

Moons of Uranus Surprise Scientists in NASA Hubble Study

The five largest moons of Uranus – sometimes called the “classical moons” -- appear in a jagged, roughly diagonal line from top right to bottom left. These are labeled Titania, Oberon, Umbriel, Miranda and Ariel. Also visible is Ariel’s shadow, which is superimposed on Uranus. Faint, ghostly, Saturn-like rings encircle the blue ice giant. Credits/Science: NASA, ESA, STScI, Christian Soto (STScI). Image Processing: Joseph DePasquale (STScI)

This image of Uranus and its five classical moons -- Titania, Oberon, Umbriel, Miranda and Ariel -- was captured by the Hubble Space Telescope’s. div style="text-align: justify;">Advanced Camera for Surveys (ACS). The image shows a scale bar, compass arrows, and color key for reference. The five largest moons of Uranus – sometimes called the “classical moons” -- appear in a jagged, roughly diagonal line from top right to bottom left. These are labeled Titania, Oberon, Umbriel, Miranda and Ariel. Also visible is Ariel’s shadow, which is superimposed on Uranus. Faint, ghostly, Saturn-like rings encircle the blue ice giant. Credits/Science: NASA, ESA, STScI, Christian Soto (STScI). Image Processing: Joseph DePasquale (STScI). The scale bar is labeled in miles along the top and kilometers along the bottom. The north and east compass arrows show the orientation of the image on the sky. Note that the relationship between north and east on the sky (as seen from below) is flipped relative to direction arrows on a map of the ground (as seen from above). This image shows visible wavelengths of light that have been translated into visible-light colors. The color key shows which ACS filters were used when collecting the light. The color of each filter name is the visible-light color used to represent the light that passes through that filter. Credits/Science: NASA, ESA, STScI, Christian Soto (STScI). Image Processing: Joseph DePasquale (STScI)


Scientists using NASA’s Hubble Space Telescope went looking for evidence of one phenomenon and found quite another.

The research team studied the four largest moons of the ice giant Uranus, the seventh planet from our Sun, searching for signs of ,. interactions between Uranus' magnetosphere and the surfaces of the moons. (A magnetosphere is a region surrounding a celestial body where particles with an electrical charge are affected by the astronomical object’s magnetic field.)

In particular, the team predicted that, based on interactions with Uranus' magnetosphere, the “leading” sides of these tidally locked moons, which always face in the same direction in which they are orbiting the planet, would be brighter than the “trailing” sides, always facing away. This would be due to radiation darkening of their trailing sides by charged particles such as electrons trapped in Uranus’ magnetosphere.

Instead, they found no evidence for darkening on the moons’ trailing sides, and clear evidence for darkening of the leading sides of the outer moons. This surprised the team and indicates that Uranus’ magnetosphere might not interact much with its large moons, contradicting existing data collected over near-infrared wavelengths.

Hubble’s sharp ultraviolet vision and spectroscopic capabilities were critical for allowing the team to investigate the surface conditions on these moons and uncover the surprising finding.

The Complicated Magnetic Environment of ‘Weird’ Uranus

The four moons in this study — Ariel, Umbriel, Titania, and Oberon — are tidally locked to Uranus, so that they always show the same side to the planet. The side of the moon facing the direction of travel is called the leading hemisphere, while the side that faces backward is called the trailing hemisphere. The thinking was that charged particles trapped along the magnetic field lines primarily hit each moon’s trailing side, which would darken that hemisphere.

“Uranus is weird, so it's always been uncertain how much the magnetic field actually interacts with its satellites,” explained principal investigator Richard Cartwright of the Johns Hopkins University’s Applied Physics Laboratory. “For starters, it is tilted by 98 degrees relative to the ecliptic.”

This means Uranus is dramatically tipped relative to the orbital plane of the planets. It rolls very slowly around the Sun on its side as it completes its 84-Earth-year orbit.

“At the time of the Voyager 2 flyby, the magnetosphere of Uranus was tilted by about 59 degrees from the orbital plane of the satellites. So, there's an additional tilt to the magnetic field,” explained Cartwright.

Because Uranus and its magnetic field lines rotate faster than its moons orbit the planet, the magnetic field lines constantly sweep past the moons. If the magnetosphere of Uranus interacts with its moons, charged particles should preferentially hit the surface of the trailing sides.

These charged particles, as well as our galaxy’s cosmic rays, should darken the trailing hemispheres of Ariel, Umbriel, Titania, and Oberon and possibly generate the carbon dioxide detected on these moons. The team expected that, especially for the inner moons Ariel and Umbriel, the trailing hemispheres would be darker than the leading sides in ultraviolet and visible wavelengths.

But that’s not what they found. Instead, the leading and trailing hemispheres of Ariel and Umbriel are actually very similar in brightness. However, the researchers did see a difference between the hemispheres of the two outer moons, Titania and Oberon — not the moons they expected.

Like Bugs on a Windshield

Even stranger, the difference in brightness was the opposite of what they expected. The two outer moons have darker and redder leading hemispheres compared with their trailing hemispheres. The team thinks that dust from some of Uranus’ irregular satellites is coating the leading sides of Titania and Oberon.

Irregular satellites are natural bodies that have large, eccentric, and inclined orbits relative to their parent planet’s equatorial plane. Micrometeorites are constantly hitting the surfaces of Uranus’ irregular satellites, ejecting small bits of material into orbit around the planet.

Over millions of years, this dusty material moves inward toward Uranus and eventually crosses the orbits of Titania and Oberon. These outer moons sweep through the dust and pick it up primarily on their leading hemispheres, which face forward. It's much like bugs hitting the windshield of your car as you drive down a highway.

This material causes Titania and Oberon to have darker and redder leading hemispheres. These outer moons effectively shield the inner moons Ariel and Umbriel from the dust, which is why the inner moons’ hemispheres do not show a difference in brightness.

“We see the same thing happening in the Saturn system and probably the Jupiter system as well,” said co-investigator Bryan Holler of the Space Telescope Science Institute. “This is some of the first evidence we’re seeing of a similar material exchange among the Uranian satellites.”

“So that supports a different explanation,” said Cartwright. “That's dust collection. I didn't even expect to get into that hypothesis, but you know, data always surprise you.”

Based on these findings, Cartwright and his team suspect that Uranus' magnetosphere may be fairly quiescent, or it may be more complicated than previously thought. Perhaps interactions between Uranus' moons and magnetosphere are happening, but for some reason, they’re not causing asymmetry in the leading and trailing hemispheres as researchers suspected. The answer will require further investigation into enigmatic Uranus, its magnetosphere, and its moons.

Hubble’s Unique Ultraviolet Vision

To observe the brightnesses of the four largest Uranian moons, the researchers required Hubble’s unique ultraviolet capabilities. Observing targets in ultraviolet light is not possible from the ground because of the filtering effects of Earth’s protective atmosphere. No other present-day space telescopes have comparable ultraviolet vision and sharpness.

“Hubble, with its ultraviolet capabilities, is the only facility that could test our hypothesis,” said the Space Telescope Science Institute’s Christian Soto, who conducted much of the data extraction and analysis. Soto presented results from this study on June 10 at the 246th Meeting of American Astronomical Society in Anchorage, Alaska.

Complementary data from NASA’s James Webb Space Telescope will help to provide a more comprehensive understanding of the Uranian satellite system and its interactions with the planet’s magnetosphere.

The Hubble Space Telescope has been operating for over three decades and continues to make ground-breaking discoveries that shape our fundamental understanding of the universe. Hubble is a project of international cooperation between NASA and ESA (European Space Agency). NASA’s Goddard Space Flight Center in Greenbelt, Maryland, manages the telescope and mission operations. Lockheed Martin Space, based in Denver, also supports mission operations at Goddard. The Space Telescope Science Institute in Baltimore, which is operated by the Association of Universities for Research in Astronomy, conducts Hubble science operations for NASA.

The Space Telescope Science Institute is expanding the frontiers of space astronomy by hosting the science operations center of the Hubble Space Telescope, the science and mission operations centers for the James Webb Space Telescope, and the science operations center for the Nancy Grace Roman Space Telescope. STScI also houses the Barbara A. Mikulski Archive for Space Telescopes (MAST) which is a NASA-funded project to support and provide to the astronomical community a variety of astronomical data archives, and is the data repository for the Hubble, Webb, Roman, Kepler, K2, TESS missions and more. STScI is operated by the Association of Universities for Research in Astronomy in Washington, D.C.


About This Release

Credits:

Media Contact:

Ann Jenkins
Space. Telescope Science Institute, Baltimore

Ray Villard
Space Telescope Science Institute, Baltimore

Permissions: Content Use Policy

Contact Us: Direct inquiries to the News Team.


Sunday, April 06, 2025

20-Year Hubble Study of Uranus Yields New Atmospheric Insights

The image columns show the change of Uranus for the four years that STIS observed Uranus across a 20-year period. Over that span of time, the researchers watched the seasons of Uranus as the south polar region darkened going into winter shadow while the north polar region brightened as northern summer approaches. Credits/Image: NASA, ESA, Erich Karkoschka (LPL)


The ice-giant planet Uranus, which travels around the Sun tipped on its side, is a weird and mysterious world. Now, in an unprecedented study spanning two decades, researchers using NASA’s Hubble Space Telescope have uncovered new insights into the planet's atmospheric composition and dynamics. This was possible only because of Hubble’s sharp resolution, spectral capabilities, and longevity.

The team’s results will help astronomers to better understand how the atmosphere of Uranus works and responds to changing sunlight. These long-term observations provide valuable data for understanding the atmospheric dynamics of this distant ice giant, which can serve as a proxy for studying exoplanets of similar size and composition.

When Voyager 2 flew past Uranus in 1986, it provided a close-up snapshot of the sideways planet. What it saw resembled a bland, blue-green billiard ball. By comparison, Hubble chronicled a 20-year story of seasonal changes from 2002 to 2022. Over that period, a team led by Erich Karkoschka of the University of Arizona, and Larry Sromovsky and Pat Fry from the University of Wisconsin used the same Hubble instrument, STIS (the Space Telescope Imaging Spectrograph), to paint an accurate picture of the atmospheric structure of Uranus.

Uranus' atmosphere is mostly hydrogen and helium, with a small amount of methane and traces of water and ammonia. The methane gives Uranus its cyan color by absorbing the red wavelengths of sunlight.

The Hubble team observed Uranus four times in the 20-year period: in 2002, 2012, 2015, and 2022. They found that, unlike conditions on the gas giants Saturn and Jupiter, methane is not uniformly distributed across Uranus. Instead, it is strongly depleted near the poles. This depletion remained relatively constant over the two decades. However, the aerosol and haze structure changed dramatically, brightening significantly in the northern polar region as the planet approaches its northern summer solstice in 2030.

Uranus takes a little over 84 Earth years to complete a single orbit of the Sun. So, over two decades, the Hubble team has only seen mostly northern spring as the Sun moves from shining directly over Uranus’ equator toward shining almost directly over its north pole in 2030. Hubble observations suggest complex atmospheric circulation patterns on Uranus during this period. The data that are most sensitive to the methane distribution indicate a downwelling in the polar regions and upwelling in other regions.

The team analyzed their results in several ways. The image columns show the change of Uranus for the four years that STIS observed Uranus across a 20-year period. Over that span of time, the researchers watched the seasons of Uranus as the south polar region (left) darkened going into winter shadow while the north polar region (right) brightened as it began to come into a more direct view as northern summer approaches.

The top row, in visible light, shows how the color of Uranus appears to the human eye as seen through even an amateur telescope.

In the second row, the false-color image of the planet is assembled from visible and near-infrared light observations. The color and brightness correspond to the amounts of methane and aerosols. Both of these quantities could not be distinguished before Hubble's STIS was first aimed at Uranus in 2002. Generally, green areas indicate less methane than blue areas, and red areas show no methane. The red areas are at the limb, where the stratosphere of Uranus is almost completely devoid of methane.

The two bottom rows show the latitude structure of aerosols and methane inferred from 1,000 different wavelengths (colors) from visible to near infrared. In the third row, bright areas indicate cloudier conditions, while the dark areas represent clearer conditions. In the fourth row, bright areas indicate depleted methane, while dark areas show the full amount of methane.

At middle and low latitudes, aerosols and methane depletion have their own latitudinal structure that mostly did not change much over the two decades of observation. However, in the polar regions, aerosols and methane depletion behave very differently.

In the third row, the aerosols near the north pole display a dramatic increase, showing up as very dark during early northern spring, turning very bright in recent years. Aerosols also seem to disappear at the left limb as the solar radiation disappeared. This is evidence that solar radiation changes the aerosol haze in the atmosphere of Uranus. On the other hand, methane depletion seems to stay quite high in both polar regions throughout the observing period.

Astronomers will continue to observe Uranus as the planet approaches northern summer.

The Hubble Space Telescope has been operating for over three decades and continues to make ground-breaking discoveries that shape our fundamental understanding of the universe. Hubble is a project of international cooperation between NASA and ESA (European Space Agency). NASA's Goddard Space Flight Center in Greenbelt, Maryland, manages the telescope and mission operations. Lockheed Martin Space, based in Denver, also supports mission operations at Goddard. The Space Telescope Science Institute in Baltimore, which is operated by the Association of Universities for Research in Astronomy, conducts Hubble science operations for NASA.


aaa

Thursday, March 06, 2025

NASA's Webb Exposes Complex Atmosphere of Starless Super-Jupiter

Isolated Planetary-Mass Object SIMP 0136 (Artist’s Concept)
Credits/Artwork: NASA, ESA, CSA, Joseph Olmsted (STScI)

Isolated Planetary-Mass Object SIMP 0136 (NIRSpec Light Curves)
Credits/Illustration: NASA, ESA, CSA, Joseph Olmsted (STScI)


An international team of researchers has discovered that previously observed variations in brightness of a free-floating planetary-mass object known as SIMP 0136 must be the result of a complex combination of atmospheric factors, and cannot be explained by clouds alone.

Using NASA’s James Webb Space Telescope to monitor a broad spectrum of infrared light emitted over two full rotation periods by SIMP 0136, the team was able to detect variations in cloud layers, temperature, and carbon chemistry that were previously hidden from view

The results provide crucial insight into the three-dimensional complexity of gas giant atmospheres within and beyond our solar system. Detailed characterization of objects like these is essential preparation for direct imaging of exoplanets, planets outside our solar system, with NASA’s Nancy Grace Roman Space Telescope, which is scheduled to begin operations in 2027.

Rapidly Rotating, Free-Floating

SIMP 0136 is a rapidly rotating, free-floating object roughly 13 times the mass of Jupiter, located in the Milky Way just 20 light-years from Earth. Although it is not classified as a gas giant exoplanet — it doesn’t orbit a star and may instead be a brown dwarf — SIMP 0136 is an ideal target for exo-meteorology: It is the brightest object of its kind in the northern sky. Because it is isolated, it can be observed with no fear of light contamination or variability caused by a host star. And its short rotation period of just 2.4 hours makes it possible to survey very efficiently.

Prior to the Webb observations, SIMP 0136 had been studied extensively using ground-based observatories and NASA’s Hubble and Spitzer space telescopes.

“We already knew that it varies in brightness, and we were confident that there are patchy cloud layers that rotate in and out of view and evolve over time,” explained Allison McCarthy, doctoral student at Boston University and lead author on a study published today in The Astrophysical Journal Letters. “We also thought there could be temperature variations, chemical reactions, and possibly some effects of auroral activity affecting the brightness, but we weren’t sure.”

To figure it out, the team needed Webb’s ability to measure very precise changes in brightness over a broad range of wavelengths.

Charting Thousands of Infrared Rainbows

Using NIRSpec (Near-Infrared Spectrograph), Webb captured thousands of individual 0.6- to 5.3-micron spectra — one every 1.8 seconds over more than three hours as the object completed one full rotation. This was immediately followed by an observation with MIRI (Mid-Infrared Instrument), which collected hundreds of spectroscopic measurements of 5- to 14-micron light — one every 19.2 seconds, over another rotation.

The result was hundreds of detailed light curves, each showing the change in brightness of a very precise wavelength (color) as different sides of the object rotated into view.

“To see the full spectrum of this object change over the course of minutes was incredible,” said principal investigator Johanna Vos, from Trinity College Dublin. “Until now, we only had a little slice of the near-infrared spectrum from Hubble, and a few brightness measurements from Spitzer.”

The team noticed almost immediately that there were several distinct light-curve shapes. At any given time, some wavelengths were growing brighter, while others were becoming dimmer or not changing much at all. A number of different factors must be affecting the brightness variations.

“Imagine watching Earth from far away. If you were to look at each color separately, you would see different patterns that tell you something about its surface and atmosphere, even if you couldn’t make out the individual features,” explained co-author Philip Muirhead, also from Boston University. “Blue would increase as oceans rotate into view. Changes in brown and green would tell you something about soil and vegetation.”

Patchy Clouds, Hot Spots, and Carbon Chemistry

To figure out what could be causing the variability on SIMP 0136, the team used atmospheric models to show where in the atmosphere each wavelength of light was originating.

“Different wavelengths provide information about different depths in the atmosphere,” explained McCarthy. “We started to realize that the wavelengths that had the most similar light-curve shapes also probed the same depths, which reinforced this idea that they must be caused by the same mechanism.”

One group of wavelengths, for example, originates deep in the atmosphere where there could be patchy clouds made of iron particles. A second group comes from higher clouds thought to be made of tiny grains of silicate minerals. The variations in both of these light curves are related to patchiness of the cloud layers.

A third group of wavelengths originates at very high altitude, far above the clouds, and seems to track temperature. Bright “hot spots” could be related to auroras that were previously detected at radio wavelengths, or to upwelling of hot gas from deeper in the atmosphere.

Some of the light curves cannot be explained by either clouds or temperature, but instead show variations related to atmospheric carbon chemistry. There could be pockets of carbon monoxide and carbon dioxide rotating in and out of view, or chemical reactions causing the atmosphere to change over time.

“We haven’t really figured out the chemistry part of the puzzle yet,” said Vos. “But these results are really exciting because they are showing us that the abundances of molecules like methane and carbon dioxide could change from place to place and over time. If we are looking at an exoplanet and can get only one measurement, we need to consider that it might not be representative of the entire planet.”

This research was conducted as part of Webb’s General Observer (GO) Program 3548.

The James Webb Space Telescope is the world’s premier space science observatory. Webb is solving mysteries in our solar system, looking beyond to distant worlds around other stars, and probing the mysterious structures and origins of our universe and our place in it. Webb is an international program led by NASA with its partners, ESA (European Space Agency) and CSA (Canadian Space Agency)


About This Release

Credits:

Media Contact:

Margaret W. Carruthers
Space Telescope Science Institute, Baltimore, Maryland

Hannah Braun
Space Telescope Science Institute, Baltimore, Maryland

Permission: Content Use Policy

Related Links and Documents


Wednesday, December 11, 2024

NASA's Hubble Celebrates Decade of Tracking Outer Planets

Hubble's Decade-Long Views of the Outer Solar System Planets
Credits/Science: NASA, ESA, Amy Simon (NASA-GSFC), Michael H. Wong (UC Berkeley)
Image Processing: Joseph DePasquale (STScI)

OPAL Jupiter Observations
Credits/Science: NASA, ESA, Amy Simon (NASA-GSFC), Michael H. Wong (UC Berkeley)
Image Processing: Joseph DePasquale (STScI)

Multiwavelength OPAL Jupiter
Credits/Science: NASA, ESA, Amy Simon (NASA-GSFC), Michael H. Wong (UC Berkeley)
Image Processing: Joseph DePasquale (STScI)

Multiwavelength OPAL Saturn
Credits/Science: NASA, ESA, Amy Simon (NASA-GSFC), Michael H. Wong (UC Berkeley)
Image Processing: Joseph DePasquale (STScI)

Videos

Credits/Science: NASA, ESA, Amy Simon (NASA-GSFC), Michael H. Wong (UC Berkeley)
Video: Joseph DePasquale (STScI)

OPAL Saturn Observations - August 2024
Credits/Science: NASA, ESA, Amy Simon (NASA-GSFC), Michael H. Wong (UC Berkeley)
Video: Joseph DePasquale (STScI)


Encountering Neptune in 1989, NASA's Voyager mission completed humankind's first close-up exploration of the four giant outer planets of our solar system. Collectively, since their launch in 1977, the twin Voyager 1 and Voyager 2 spacecraft discovered that Jupiter, Saturn, Uranus, and Neptune were far more complex than scientists had imagined. There was a lot more to be learned.

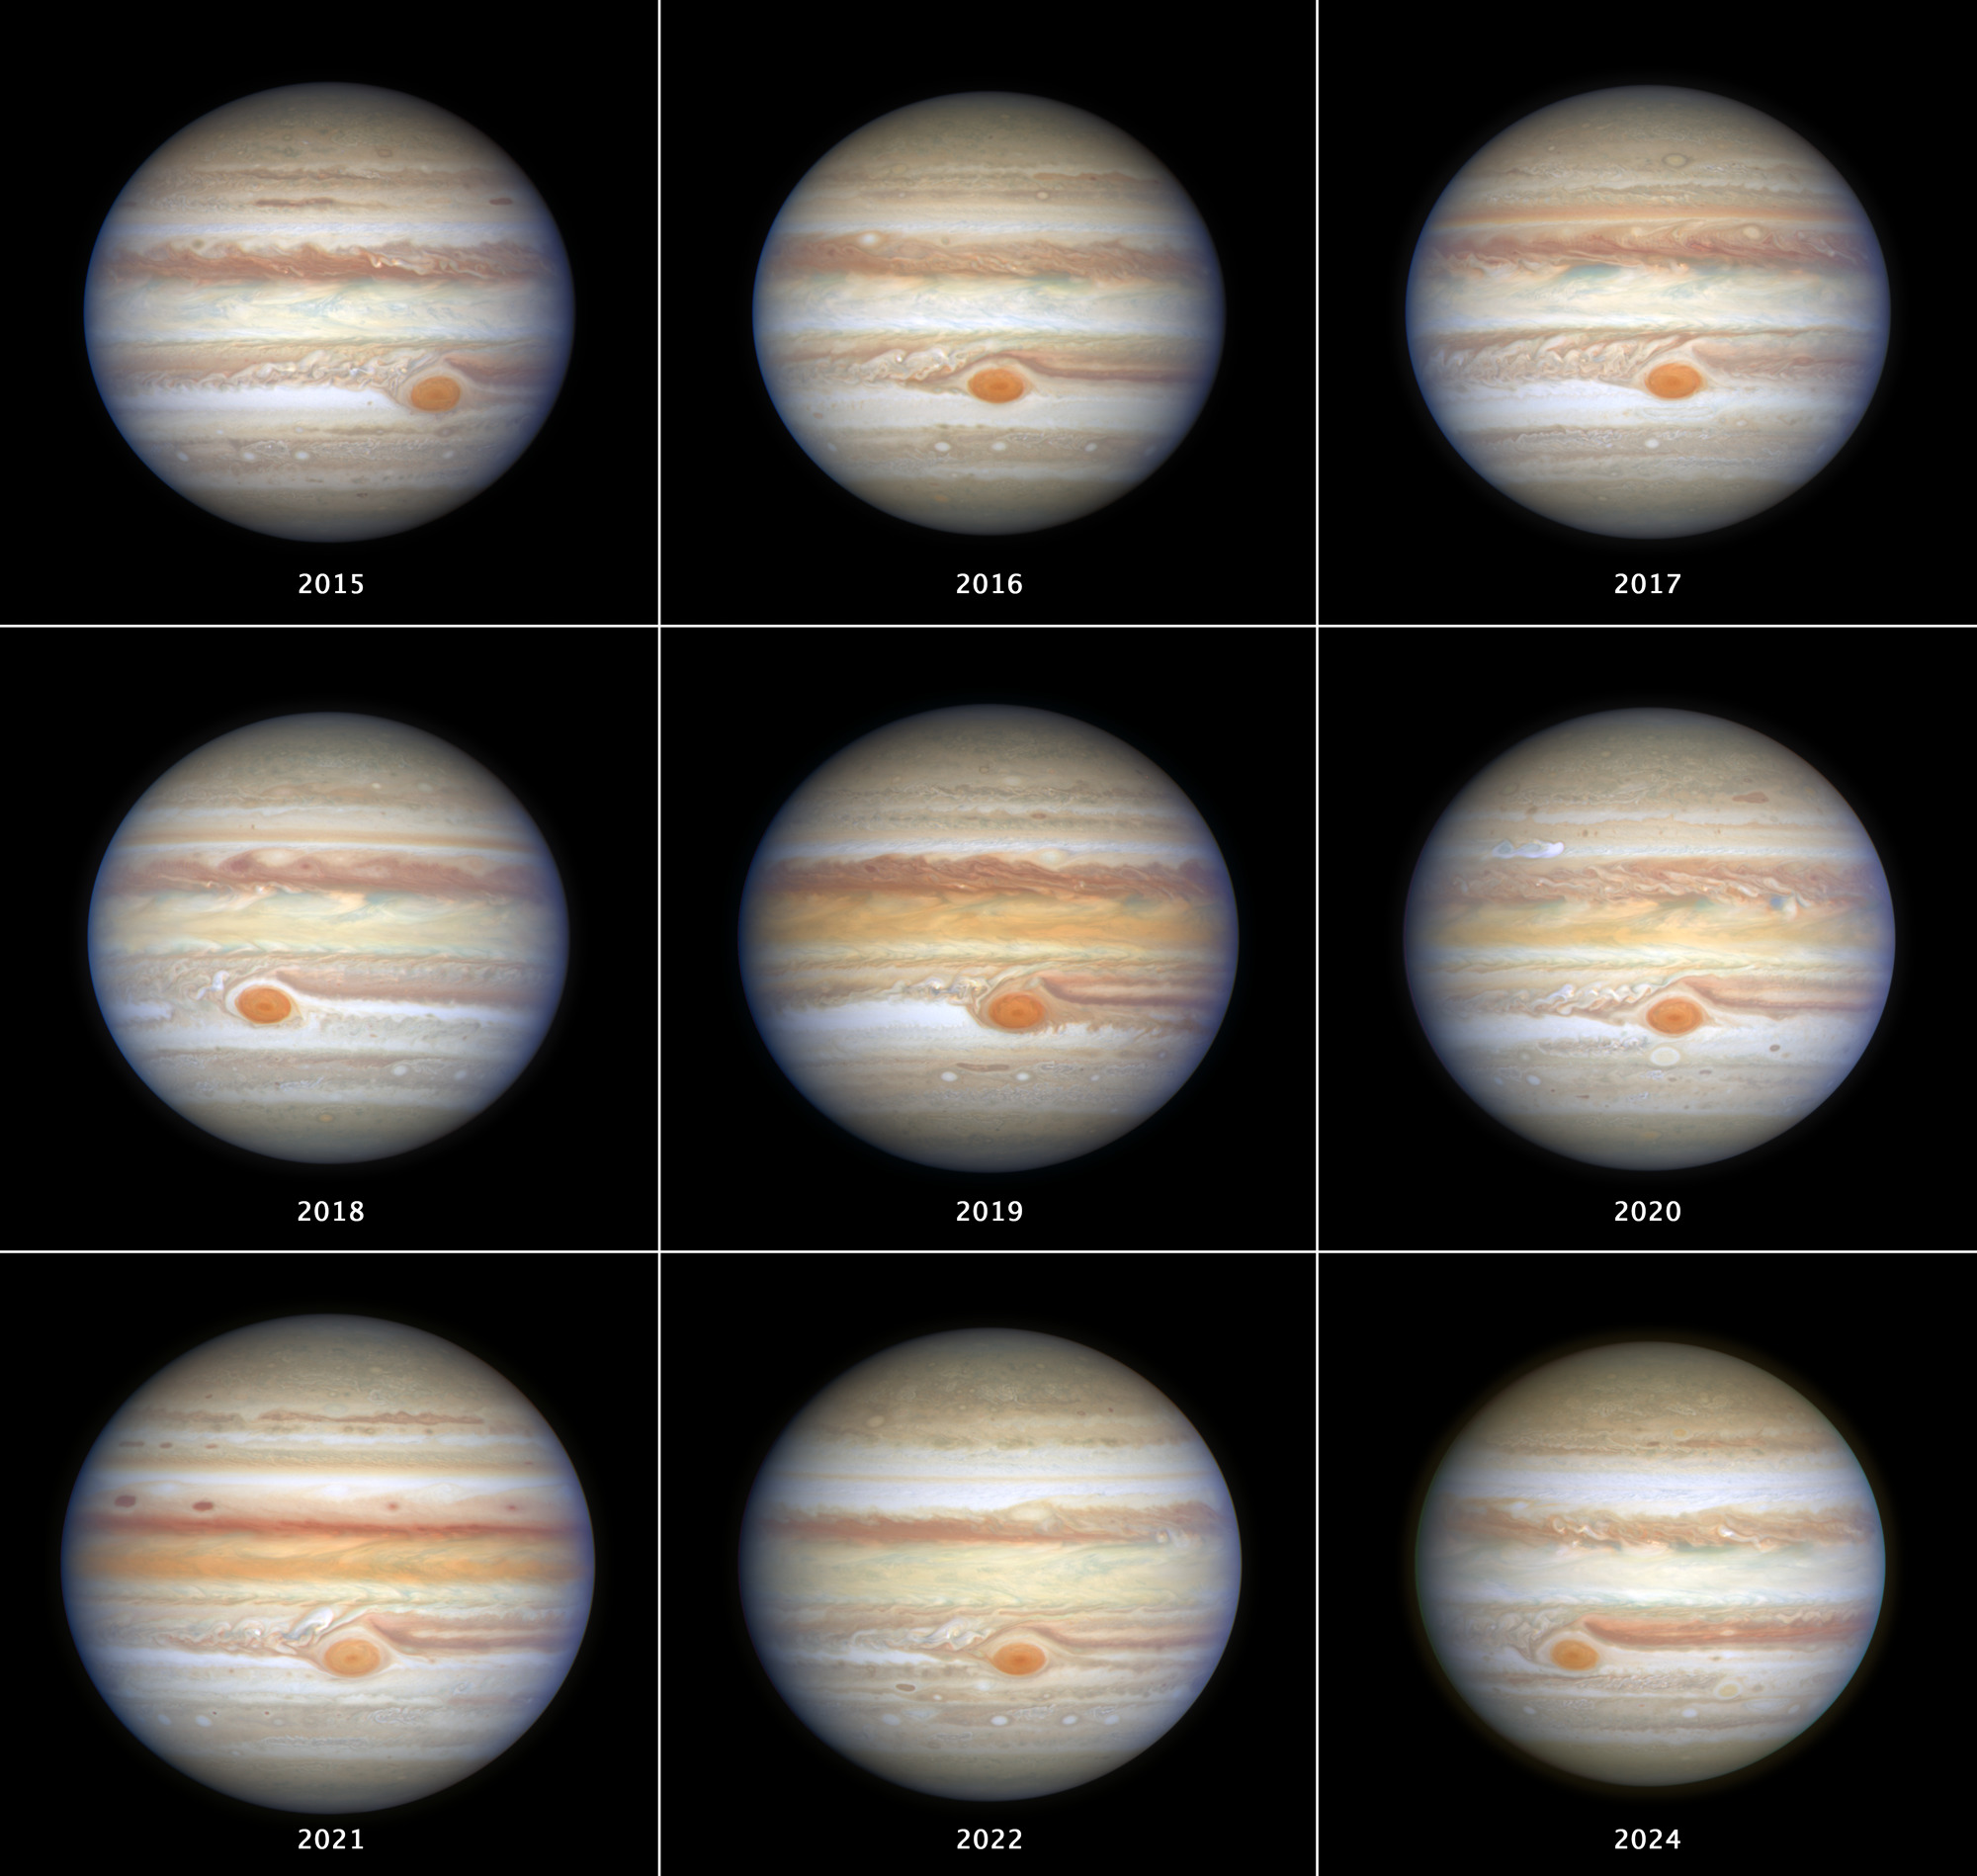
A NASA's Hubble Space Telescope observation program called OPAL (Outer Planet Atmospheres Legacy) obtains long-term baseline observations of Jupiter, Saturn, Uranus, and Neptune in order to understand their atmospheric dynamics and evolution.

"The Voyagers don't tell you the full story," said Amy Simon of NASA's Goddard Space Flight Center in Greenbelt, Maryland, who conducted giant planet observations with OPAL.

Hubble's image sharpness is comparable to the Voyager views as they approached the outer planets, and Hubble spans wavelengths from ultraviolet to near-infrared light. Hubble is the only telescope that can provide high spatial resolution and image stability for global studies of cloud coloration, activity, and atmospheric motion on a consistent time basis to help constrain the underlying mechanics of weather and climate systems.

All four of the outer planets have deep atmospheres and no solid surfaces. Their churning atmospheres have their own unique weather systems, some with colorful bands of multicolored clouds, and with mysterious, large storms that pop up or linger for many years. Each outer planet also has seasons lasting many years. (The James Webb Space Telescope's infrared capabilities will be used to probe deep into atmospheres of the outer planets to complement the OPAL observations.)

Following the complex behavior is akin to understanding Earth's dynamic weather as followed over many years, as well as the Sun's influence on the solar system's weather. The four distant worlds also serve as proxies for understanding the weather and climate on similar planets orbiting other stars.

Planetary scientists realized that any one year of data from Hubble, while interesting in its own right, doesn't tell the full story of the outer planets. Hubble's OPAL program has routinely observed the planets once a year when they are closest to the Earth.

"Because OPAL now spans 10 years and counting, our database of planetary observations is ever growing. That longevity allows for serendipitous discoveries, but also for tracking long-term atmospheric changes as the planets orbit the Sun. The scientific value of these data is underscored by the more than 60 publications to date that include OPAL data," said Simon.

This payoff continues to be a huge archive of data that has led to a string of remarkable discoveries to share with planetary astronomers around the world. "OPAL also interfaces with other ground- and space-based planetary programs. Many papers from other observatories and space missions pull in Hubble data from OPAL for context," said Simon.

The team's decade of discovery under Hubble's OPAL program is being presented at the December meeting of the American Geophysical Union in Washington, D.C.

Some Highlights:

Jupiter

Jupiter's bands of clouds present an ever-changing kaleidoscope of shapes and colors. There is always stormy weather on Jupiter: cyclones, anticyclones, wind shear, and the largest storm in the solar system, the Great Red Spot (GRS). Jupiter is covered with largely ammonia ice-crystal clouds on top of an atmosphere that's tens of thousands of miles deep.

Hubble's sharp images track clouds and measure the winds, storms, and vortices, in addition to monitoring the size, shape and behavior of the GRS. Hubble follows as the GRS continues shrinking in size and its winds are speeding up. OPAL data recently measured how often mysterious dark ovals — visible only at ultraviolet wavelengths — appeared in the "polar hoods" of stratospheric haze. Unlike Earth, Jupiter is only inclined three degrees on its axis (Earth is 23.5 degrees). Seasonal changes might not be expected, except that Jupiter's distance from the Sun varies by about 5% over its 12-year-long orbit, and so OPAL closely monitors the atmosphere for seasonal effects. Another Hubble advantage is that ground-based observatories can't continuously view Jupiter for two Jupiter rotations, because that adds up to 20 hours. During that time, an observatory on the ground would have gone into daytime and Jupiter would no longer be visible until the next evening

Saturn

Saturn takes more than 29 years to orbit the Sun, and so OPAL has followed it for approximately one quarter of a Saturnian year (picking up in 2018, after the end of the Cassini mission). Because Saturn is tilted 26.7 degrees, it goes through more profound seasonal changes than Jupiter. Saturnian seasons last approximately seven years. This also means Hubble can view the spectacular ring system from an oblique angle of almost 30 degrees to seeing the rings tilted edge-on. Edge-on, the rings nearly vanish because they are relatively paper-thin. This will happen again in 2025.

OPAL has followed changes in colors of Saturn's atmosphere. The varying color was first detected by the Cassini orbiter, but Hubble provides a longer baseline. Hubble revealed slight changes from year-to-year in color, possibly caused by cloud height and winds. The observed changes are subtle because OPAL has covered only a fraction of a Saturnian year. Major changes happen when Saturn progresses into the next season. Saturn's mysteriously dark ring spokes , which slice across the ring plane, are transient features that rotate along with the rings. Their ghostly appearance only persists for two or three rotations around Saturn. During active periods, freshly formed spokes continuously add to the pattern. They were first seen in 1981 by Voyager 2. Cassini also saw the spokes during its 13-year-long mission, which ended in 2017. Hubble shows that the frequency of spoke apparitions is seasonally driven, first appearing in OPAL data in 2021. Long-term monitoring shows that both the number and contrast of the spokes vary with Saturn's seasons.

Uranus

Uranus is tilted on its side so that its spin axis almost lies in the plane of the planet's orbit. This results in the planet going through radical seasonal changes along it 84-year-long trek around the Sun. The consequence of the planet's tilt means part of one hemisphere is completely without sunlight, for stretches of time lasting up to 42 years. OPAL has followed the northern pole now tipping toward the Sun.

With OPAL, Hubble first imaged Uranus after the spring equinox, when the Sun was last shining directly over the planet's equator. Hubble resolved multiple storms with methane ice-crystal clouds appearing at mid-northern latitudes as summer approaches the north pole. Uranus' north pole now has a thickened photochemical haze with several little storms near the edge of the boundary. Hubble has been tracking the size of the north polar cap and it continues to get brighter year after year. As northern summer solstice approaches in 2028, the cap may grow brighter still, and will be aimed directly toward Earth, allowing good views of the rings and north pole. The ring system will then appear face-on. Understanding how Uranus changes over time will help in mission planning for NASA's proposed Uranus Orbiter and Probe.

Neptune

When Voyager 2 flew by Neptune in 1989, astronomers were mystified by a great dark spot the size of the Atlantic Ocean looming in the atmosphere. Was it long-lived like Jupiter's Great Red Spot? The question remained unanswered until Hubble was able to show in 1994 that such dark storms were transitory, cropping up and then disappearing over a duration of two to six years each. During the OPAL program, Hubble saw the end of one dark spot and the full life cycle of a second one — both of them migrating toward the equator before dissipating. The OPAL program ensures that astronomers won't miss another one.

Hubble observations uncovered a link between Neptune's shifting cloud abundance and the 11-year solar cycle . The connection between Neptune and solar activity is surprising to planetary scientists because Neptune is our solar system's farthest major planet. It receives only about 1/1000th as much sunlight as Earth receives. Yet Neptune's global cloudy weather seems to be influenced by solar activity. Do the planet's seasons also play a role?
https://hubblesite.org/contents/news-releases/2024/news-2024-010
The Hubble Space Telescope has been operating for over three decades and continues to make ground-breaking discoveries that shape our fundamental understanding of the universe. Hubble is a project of international cooperation between NASA and ESA (European Space Agency). NASA's Goddard Space Flight Center in Greenbelt, Maryland, manages the telescope and mission operations. Lockheed Martin Space, based in Denver, also supports mission operations at Goddard. The Space Telescope Science Institute in Baltimore, which is operated by the Association of Universities for Research in Astronomy, conducts Hubble science operations for NASA.


About This Release

Credits:

Media Contact:

Ray Villard
Space Telescope Science Institute, Baltimore, Maryland

Science Contact:

Amy Simon
NASA Goddard Space Flight Center, Greenbelt, Maryland

Michael H. Wong
University of California, Berkeley, California

Permissions: Content Use Policy

Contact Us: Direct inquiries to the News Team.

Related Links and Documents


Monday, October 14, 2024

NASA's Hubble Watches Jupiter's Great Red Spot Behave Like a Stress Ball

Close-up of Jupiter's Great Red Spot (8-Panel)Using Hubble Space Telescope data spanning approximately 90 days (between December 2023 and March 2024) when the giant planet Jupiter ranged from 391 million to 512 million miles from the Sun, astronomers measured the Great Red Spot's size, shape, brightness, color, and vorticity over one full oscillation cycle. The data reveal that the Great Red Spot is not as stable as it might look. It was observed going through an oscillation in its elliptical shape, jiggling like a bowl of gelatin. The cause of the 90-day oscillation is unknown. Credits: Science: NASA, ESA, Amy Simon (NASA-GSFC)/ Image Processing: Joseph DePasquale (STScI)

Using Hubble Space Telescope data spanning approximately 90 days (between December 2023 and March 2024) when the giant planet Jupiter ranged from 391 million to 512 million miles from the Sun, astronomers measured the Great Red Spot's size, shape, brightness, color, and vorticity over a full oscillation cycle. The data reveal that the Great Red Spot is not as stable as it might look. It was observed going through an oscillation in its elliptical shape, jiggling like a bowl of gelatin. The cause of the 90-day oscillation is unknown. The observation is part of the observing programs led by Amy Simon of NASA's Goddard Space Flight Center in Greenbelt, Maryland. Credits: Science: NASA, ESA, Amy Simon (NASA-GSFC)/ Image Processing: Joseph DePasquale (STScI)


This time-lapse movie is assembled from Hubble Space Telescope observations spanning approximately 90 days (between December 2023 and March 2024) when the giant planet Jupiter ranged from 391 million to 512 million miles from the Sun. Astronomers measured the Great Red Spot's size, shape, brightness, color, and vorticity over a full oscillation cycle. The data reveal that the Great Red Spot is not as stable as it might look. It was observed going through an oscillation in its elliptical shape, jiggling like a bowl of gelatin. The cause of the 90-day oscillation is unknown.Credits: Science: NASA, ESA, Amy Simon (NASA-GSFC)/ Image Processing: Joseph DePasquale (STScI)

This animated diagram shows the position of Earth relative to Jupiter during a period spanning approximately 90 days (between December 2023 and March 2024) when the giant planet Jupiter ranged from 391 million to 512 million miles from the Sun. During this period the Hubble Space telescope monitored changes in Jupiter's atmosphere as part of the observing programs led by Amy Simon of NASA Goddard Space Flight Center in Greenbelt, Maryland. Jupiter's orbital period is approximately 12 years. The angular size of the planet shrinks in Hubble's view, as faster-moving Earth pulls ahead of the giant planet. Credits Video: NASA, ESA, Joseph DePasquale (STScI)


Astronomers have observed Jupiter's legendary Great Red Spot (GRS), an anticyclone large enough to swallow Earth, for at least 150 years. But there are always new surprises – especially when NASA's Hubble Space Telescope takes a close-up look at it.

Hubble's new observations of the famous red storm, collected 90 days between December 2023 to March 2024, reveal that the GRS is not as stable as it might look. The recent data show the GRS jiggling like a bowl of gelatin. The combined Hubble images allowed astronomers to assemble a time-lapse movie of the squiggly behavior of the GRS.

"While we knew its motion varies slightly in its longitude, we didn't expect to see the size oscillate as well. As far as we know, it's not been identified before," said Amy Simon of NASA's Goddard Space Flight Center in Greenbelt, Maryland, lead author of the science paper published in The Planetary Science Journal. "This is really the first time we've had the proper imaging cadence of the GRS. With Hubble's high resolution we can say that the GRS is definitively squeezing in and out at the same time as it moves faster and slower. That was very unexpected, and at present there are no hydrodynamic explanations."

Hubble monitors Jupiter and the other outer solar system planets every year through the Outer Planet Atmospheres Legacy program (OPAL) led by Simon, but these observations were from a program dedicated to the GRS. Understanding the mechanisms of the largest storms in the solar system puts the theory of hurricanes on Earth into a broader cosmic context, which might be applied to better understanding the meteorology on planets around other stars.

Simon's team used Hubble to zoom in on the GRS for a detailed look at its size, shape, and any subtle color changes. "When we look closely, we see a lot of things are changing from day to day," said Simon. This includes ultraviolet-light observations showing that the distinct core of the storm gets brightest when the GRS is at its largest size in its oscillation cycle. This indicates less haze absorption in the upper atmosphere.

"As it accelerates and decelerates, the GRS is pushing against the windy jet streams to the north and south of it," said co-investigator Mike Wong of the University of California at Berkeley. "It's similar to a sandwich where the slices of bread are forced to bulge out when there's too much filling in the middle." Wong contrasted this to Neptune, where dark spots can drift wildly in latitude without strong jet streams to hold them in place. Jupiter's Great Red Spot has been held at a southern latitude, trapped between the jet streams, for the extent of Earth-bound telescopic observations.

The team has continued watching the GRS shrink since the OPAL program began 10 years ago. They predict it will keep shrinking before taking on a stable, less-elongated, shape. "Right now it's over-filling its latitude band relative to the wind field. Once it shrinks inside that band the winds will really be holding it in place," said Simon. The team predicts that the GRS will probably stabilize in size, but for now Hubble only observed it for one oscillation cycle.

The researchers hope that in the future other high-resolution images from Hubble might identify other Jovian parameters that indicate the underlying cause of the oscillation.

The results are being presented at the 56th annual meeting of the American Astronomical Society Division for Planetary Sciences, in Boise, Idaho.

The Hubble Space Telescope has been operating for over three decades and continues to make ground-breaking discoveries that shape our fundamental understanding of the universe. Hubble is a project of international cooperation between NASA and ESA (European Space Agency). NASA's Goddard Space Flight Center in Greenbelt, Maryland, manages the telescope and mission operations. Lockheed Martin Space, based in Denver, Colorado, also supports mission operations at Goddard. The Space Telescope Science Institute in Baltimore, Maryland, which is operated by the Association of Universities for Research in Astronomy, conducts Hubble science operations for NASA.


About This Release

Credits:

Media Contact:

Ray Villard:
Space Telescope Science Institute, Baltimore, Maryland

Science Contact:

Amy Simon
NASA Goddard Space Flight Center, Greenbelt, Maryland

Michael H. Wong
University of California, Berkeley, Berkeley, California

Permissions: Content Use Policy

Contact Us: Direct inquiries to the News Team.

Related Links and Documents


Saturday, May 11, 2024

NASA's Webb Hints at Possible Atmosphere Surrounding Rocky Exoplanet

Super-Earth Exoplanet 55 Cancri e (Artist’s Concept)
Credits: Illustration: NASA, ESA, CSA, Ralf Crawford (STScI)

Super-Earth Exoplanet 55 Cancri e (MIRI Secondary Eclipse Light Curve)
Credits: Illustration: NASA, ESA, CSA, Joseph Olmsted (STScI)
Science: Aaron Bello-Arufe (NASA-JPL)

Super-Earth Exoplanet 55 Cancri e (NIRCam + MIRI Emission Spectrum)
Credits: Illustration: NASA, ESA, CSA, Joseph Olmsted (STScI)
Science: Renyu Hu (NASA-JPL), Aaron Bello-Arufe (NASA-JPL), Michael Zhang (University of Chicago), Mantas Zilinskas (SRON)


Researchers using NASA’s James Webb Space Telescope may have detected atmospheric gases surrounding 55 Cancri e, a hot rocky exoplanet 41 light-years from Earth. This is the best evidence to date for the existence of any rocky planet atmosphere outside our solar system.

Renyu Hu from NASA’s Jet Propulsion Laboratory (JPL) in Pasadena, California, is lead author on a paper published today in Nature. “Webb is pushing the frontiers of exoplanet characterization to rocky planets,” Hu said. “It is truly enabling a new type of science.”

Super-Hot Super-Earth 55 Cancri e

55 Cancri e, also known as Janssen, is one of five known planets orbiting the Sun-like star 55 Cancri, in the constellation Cancer. With a diameter nearly twice that of Earth and density slightly greater, the planet is classified as a super-Earth: larger than Earth, smaller than Neptune, and likely similar in composition to the rocky planets in our solar system.

To describe 55 Cancri e as “rocky,” however, could leave the wrong impression. The planet orbits so close to its star (about 1.4 million miles, or one-twenty-fifth the distance between Mercury and the Sun) that its surface is likely to be molten – a bubbling ocean of magma. With such a tight orbit, the planet is also likely to be tidally locked, with a dayside that faces the star at all times and a nightside in perpetual darkness.

In spite of numerous observations since it was discovered to transit in 2011, the question of whether or not 55 Cancri e has an atmosphere – or even could have one given its high temperature and the continuous onslaught of stellar radiation and wind from its star – has gone unanswered.

“I’ve worked on this planet for more than a decade,” said Diana Dragomir, an exoplanet researcher at the University of New Mexico and co-author on the study. “It’s been really frustrating that none of the observations we’ve been getting have robustly solved these mysteries. I am thrilled that we're finally getting some answers!”

Unlike the atmospheres of gas giant planets, which are relatively easy to spot (the first was detected by NASA’s Hubble Space Telescope more than two decades ago), thinner and denser atmospheres surrounding rocky planets have remained elusive.

Previous studies of 55 Cancri e using data from NASA’s now-retired Spitzer Space Telescope suggested the presence of a substantial atmosphere rich in volatiles (molecules that occur in gas form on Earth) like oxygen, nitrogen, and carbon dioxide. But researchers could not rule out another possibility: that the planet is bare, save for a tenuous shroud of vaporized rock, rich in elements like silicon, iron, aluminum, and calcium. “The planet is so hot that some of the molten rock should evaporate,” explained Hu.

Measuring Subtle Variations in Infrared Colors

To distinguish between the two possibilities, the team used Webb’s NIRCam (Near-Infrared Camera) and MIRI (Mid-Infrared Instrument) to measure 4- to 12-micron infrared light coming from the planet.

Although Webb cannot capture a direct image of 55 Cancri e, it can measure subtle changes in light from the system as the planet orbits the star.

By subtracting the brightness during the secondary eclipse, when the planet is behind the star (starlight only), from the brightness when the planet is right beside the star (light from the star and planet combined), the team was able to calculate the amount of various wavelengths of infrared light coming from the dayside of the planet.

This method, known as secondary eclipse spectroscopy, is similar to that used by other research teams to search for atmospheres on other rocky exoplanets, like TRAPPIST-1 b.

Cooler than Expected

The first indication that 55 Cancri e could have a substantial atmosphere came from temperature measurements based on its thermal emission, or heat energy given off in the form of infrared light. If the planet is covered in dark molten rock with a thin veil of vaporized rock or no atmosphere at all, the dayside should be around 4,000 degrees Fahrenheit (~2,200 degrees Celsius).

“Instead, the MIRI data showed a relatively low temperature of about 2,800 degrees Fahrenheit [~1540 degrees Celsius],” said Hu. “This is a very strong indication that energy is being distributed from the dayside to the nightside, most likely by a volatile-rich atmosphere.” While currents of lava can carry some heat around to the nightside, they cannot move it efficiently enough to explain the cooling effect.

When the team looked at the NIRCam data, they saw patterns consistent with a volatile-rich atmosphere. “We see evidence of a dip in the spectrum between 4 and 5 microns — less of this light is reaching the telescope,” explained co-author Aaron Bello-Arufe, also from NASA JPL. “This suggests the presence of an atmosphere containing carbon monoxide or carbon dioxide, which absorb these wavelengths of light.” A planet with no atmosphere or an atmosphere consisting only of vaporized rock would not have this specific spectral feature.

“We’ve spent the last ten years modelling different scenarios, trying to imagine what this world might look like,” said co-author Yamila Miguel from the Leiden Observatory and the Netherlands Institute for Space Research (SRON). “Finally getting some confirmation of our work is priceless!”

Bubbling Magma Ocean

The team thinks that the gases blanketing 55 Cancri e would be bubbling out from the interior, rather than being present ever since the planet formed. “The primary atmosphere would be long gone because of the high temperature and intense radiation from the star,” said Bello-Arufe. “This would be a secondary atmosphere that is continuously replenished by the magma ocean. Magma is not just crystals and liquid rock; there’s a lot of dissolved gas in it, too.”

While 55 Cancri e is far too hot to be habitable, researchers think it could provide a unique window for studying interactions between atmospheres, surfaces, and interiors of rocky planets, and perhaps provide insights into the early conditions of Earth, Venus, and Mars, which are thought to have been covered in magma oceans far in the past. “Ultimately, we want to understand what conditions make it possible for a rocky planet to sustain a gas-rich atmosphere: a key ingredient for a habitable planet,” said Hu. This research was conducted as part of Webb’s General Observers (GO) Program 1952. Analysis of additional secondary eclipse observations of 55 Cancri e are currently in progress.

The James Webb Space Telescope is the world’s premier space science observatory. Webb is solving mysteries in our solar system, looking beyond to distant worlds around other stars, and probing the mysterious structures and origins of our universe and our place in it. Webb is an international program led by NASA with its partners, ESA (European Space Agency) and the Canadian Space Agency.


About This Release

Credits:

Media Contact:

Margaret W. Carruthers
Space Telescope Science Institute, Baltimore, Maryland

Christine Pulliam
Space Telescope Science Institute, Baltimore, Maryland

Science: Renyu Hu (NASA-JPL)

Permissions: Content Use Policy

 Contact Us: Direct inquiries to the News Team.

Related Links and Documents


Thursday, May 02, 2024

NASA's Webb Maps Weather on Planet 280 Light-Years Away

Hot Gas-Giant Exoplanet WASP-43 b (Artist’s Concept)
Credits: Artwork: NASA, ESA, CSA, Ralf Crawford (STScI)


Hot Gas-Giant Exoplanet WASP-43 b (MIRI Phase Curve)
Credits: Illustration: NASA, ESA, CSA, Ralf Crawford (STScI)
Science: Taylor Bell (BAERI), Joanna Barstow (The Open University), Michael Roman (University of Leicester)


Hot Gas-Giant Exoplanet WASP-43 b (Temperature Maps)
Credits: Illustration: NASA, ESA, CSA, Ralf Crawford (STScI)
Science: Taylor Bell (BAERI), Joanna Barstow (The Open University), Michael Roman (University of Leicester)


Hot Gas-Giant Exoplanet WASP-43 b (Rotating Global Temperature Map) (Video)
Credits: Video: Thomas Muller (MPIA)


An international team of researchers has successfully used NASA’s James Webb Space Telescope to map the weather on the hot gas-giant exoplanet WASP-43 b.

Precise brightness measurements over a broad spectrum of mid-infrared light, combined with 3D climate models and previous observations from other telescopes, suggest the presence of thick, high clouds covering the nightside, clear skies on the dayside, and equatorial winds upwards of 5,000 miles per hour mixing atmospheric gases around the planet.

The investigation is just the latest demonstration of the exoplanet science now possible with Webb’s extraordinary ability to measure temperature variations and detect atmospheric gases trillions of miles away.

Tidally Locked “Hot Jupiter”

WASP-43 b is a “hot Jupiter” type of exoplanet: similar in size to Jupiter, made primarily of hydrogen and helium, and much hotter than any of the giant planets in our own solar system. Although its star is smaller and cooler than the Sun, WASP-43 b orbits at a distance of just 1.3 million miles – less than 1/25th the distance between Mercury and the Sun.

With such a tight orbit, the planet is tidally locked, with one side continuously illuminated and the other in permanent darkness. Although the nightside never receives any direct radiation from the star, strong eastward winds transport heat around from the dayside.

Since its discovery in 2011, WASP-43 b has been observed with numerous telescopes, including NASA’s Hubble and now-retired Spitzer space telescopes.

“With Hubble, we could clearly see that there is water vapor on the dayside. Both Hubble and Spitzer suggested there might be clouds on the nightside,” explained Taylor Bell, researcher from the Bay Area Environmental Research Institute and lead author of a study published today in Nature Astronomy . “But we needed more precise measurements from Webb to really begin mapping the temperature, cloud cover, winds, and more detailed atmospheric composition all the way around the planet.”

Mapping Temperature and Inferring Weather

Although WASP-43 b is too small, dim, and close to its star for a telescope to see directly, its short orbital period of just 19.5 hours makes it ideal for phase curve spectroscopy, a technique that involves measuring tiny changes in brightness of the star-planet system as the planet orbits the star.

Since the amount of mid-infrared light given off by an object depends largely on how hot it is, the brightness data captured by Webb can then be used to calculate the planet’s temperature.

The team used Webb’s MIRI (Mid-Infrared Instrument) to measure light from the WASP-43 system every 10 seconds for more than 24 hours. “By observing over an entire orbit, we were able to calculate the temperature of different sides of the planet as they rotate into view,” explained Bell. “From that, we could construct a rough map of temperature across the planet.”

The measurements show that the dayside has an average temperature of nearly 2,300 degrees Fahrenheit (1,250 degrees Celsius) – hot enough to forge iron. Meanwhile, the nightside is significantly cooler at 1,100 degrees Fahrenheit (600 degrees Celsius). The data also helps locate the hottest spot on the planet (the “hotspot”), which is shifted slightly eastward from the point that receives the most stellar radiation, where the star is highest in the planet’s sky. This shift occurs because of supersonic winds, which move heated air eastward.

“The fact that we can map temperature in this way is a real testament to Webb’s sensitivity and stability,” said Michael Roman, a co-author from the University of Leicester in the U.K.

To interpret the map, the team used complex 3D atmospheric models like those used to understand weather and climate on Earth. The analysis shows that the nightside is probably covered in a thick, high layer of clouds that prevent some of the infrared light from escaping to space. As a result, the nightside – while very hot – looks dimmer and cooler than it would if there were no clouds.

Missing Methane and High Winds

The broad spectrum of mid-infrared light captured by Webb also made it possible to measure the amount of water vapor (H2O) and methane (CH4) around the planet. “Webb has given us an opportunity to figure out exactly which molecules we’re seeing and put some limits on the abundances,” said Joanna Barstow, a co-author from the Open University in the U.K.

The spectra show clear signs of water vapor on the nightside as well as the dayside of the planet, providing additional information about how thick the clouds are and how high they extend in the atmosphere.

Surprisingly, the data also shows a distinct lack of methane anywhere in the atmosphere. Although the dayside is too hot for methane to exist (most of the carbon should be in the form of carbon monoxide), methane should be stable and detectable on the cooler nightside.

“The fact that we don't see methane tells us that WASP-43 b must have wind speeds reaching something like 5,000 miles per hour,” explained Barstow. “If winds move gas around from the dayside to the nightside and back again fast enough, there isn’t enough time for the expected chemical reactions to produce detectable amounts of methane on the nightside.”

The team thinks that because of this wind-driven mixing, the atmospheric chemistry is the same all the way around the planet, which wasn’t apparent from past work with Hubble and Spitzer.

The MIRI observation of WASP-43 b was conducted as part of the Webb Early Release Science programs, which are providing researchers with a vast set of robust, open-access data for studying a wide array of cosmic phenomena.

The James Webb Space Telescope is the world's premier space science observatory. Webb is solving mysteries in our solar system, looking beyond to distant worlds around other stars, and probing the mysterious structures and origins of our universe and our place in it. Webb is an international program led by NASA with its partners, ESA (European Space Agency) and the Canadian Space Agency.


About This Release

Credits:

Media Contact:

Margaret W. Carruthers
Space Telescope Science Institute, Baltimore, Maryland

Christine Pulliam
Space Telescope Science Institute, Baltimore, Maryland

Science: Taylor Bell (BAERI)

Permissions: Content Use Policy

Contact Us: Direct inquiries to the News Team.

Related Links and Documents


Monday, March 18, 2024

Hubble Tracks Jupiter's Stormy Weather

PR Image heic2404a
Hubble’s two new views of Jupiter (January 2024)

PR Image heic2404b
Jupiter (5 January 2024)

PR Image heic2404c
Jupiter (6 January 2024)

PR Image heic2404d
Jupiter OPAL observations (January 2024)

PR Image heic2404e
Hubble’s two new views of Jupiter (January 2024, compass image)


Videos

Jupiter rotation (OPAL January 2024) 
PR Video heic2404a
Jupiter rotation (OPAL January 2024)


The giant planet Jupiter, in all its banded glory, is revisited by the NASA/ESA Hubble Space Telescope in these latest images, taken on 5–6 January 2024, that capture both sides of the planet. Hubble monitors Jupiter and the other outer Solar System planets every year under the Outer Planet Atmospheres Legacy programme (OPAL). This is because these large worlds are shrouded in clouds and hazes stirred up by violent winds, leading to a kaleidoscope of ever-changing weather patterns.

The largest and nearest of the giant outer planets, Jupiter's colourful clouds present an ever-changing kaleidoscope of shapes and colours. This is a planet where there is always stormy weather: cyclones, anticyclones, wind shear, and the largest storm in the Solar System, the Great Red Spot. Jupiter has no solid surface and is perpetually covered with largely ammonia ice-crystal clouds that are only about 48 kilometres thick in an atmosphere that's tens of thousands of kilometres deep and give the planet its banded appearance. The bands are produced by air flowing in different directions at various latitudes with speeds approaching 560 kilometres per hour. Lighter-hued areas where the atmosphere rises are called zones. Darker regions where air falls are called belts. When these opposing flows interact, storms and turbulence appear. Hubble tracks these dynamic changes every year with unprecedented clarity, and there are always surprises. The many large storms and small white clouds seen in Hubble's latest images are evidence for a lot of activity going on in Jupiter's atmosphere right now.


[
Image 1
] Big enough to swallow Earth, the classic Great Red Spot stands out prominently in Jupiter's atmosphere. To its lower right, at a more southerly latitude, is a feature sometimes dubbed Red Spot Jr. This anticyclone was the result of storms merging in 1998 and 2000, and it first appeared red in 2006 before returning to a pale beige in subsequent years. This year it is somewhat redder again. The source of the red coloration is unknown but may involve a range of chemical compounds: sulphur, phosphorus or organic material. Staying in their lanes, but moving in opposite directions, Red Spot Jr. passes the Great Red Spot about every two years. Another small red anticyclone appears in the far north.

[Image 2] – Storm activity also appears in the opposite hemisphere. A pair of storms, a deep red cyclone and a reddish anticyclone, appear next to each other at right of centre. They look so red that at first glance, it looks like Jupiter skinned a knee. These storms are rotating in opposite directions, indicating an alternating pattern of high- and low-pressure systems. For the cyclone, there's an upwelling on the edges with clouds descending in the middle, causing a clearing in the atmospheric haze.The storms are expected to bounce past each other because their opposing clockwise and counterclockwise rotation makes them repel each other.

Toward the left edge of the image is the innermost Galilean moon, Io — the most volcanically active body in the Solar System, despite its small size (only slightly larger than Earth's moon). Hubble resolves volcanic outflow deposits on the surface. Hubble's sensitivity to blue and violet wavelengths clearly reveals interesting surface features.


More information

The Hubble Space Telescope is a project of international cooperation between ESA and NASA.
Image Credit: NASA, ESA, J. DePasquale (STScI), A. Simon (NASA-GSFC)


Links


Contacts

Bethany Downer
ESA/Hubble Chief Science Communications Officer
Email:
Bethany.Downer@esahubble.org