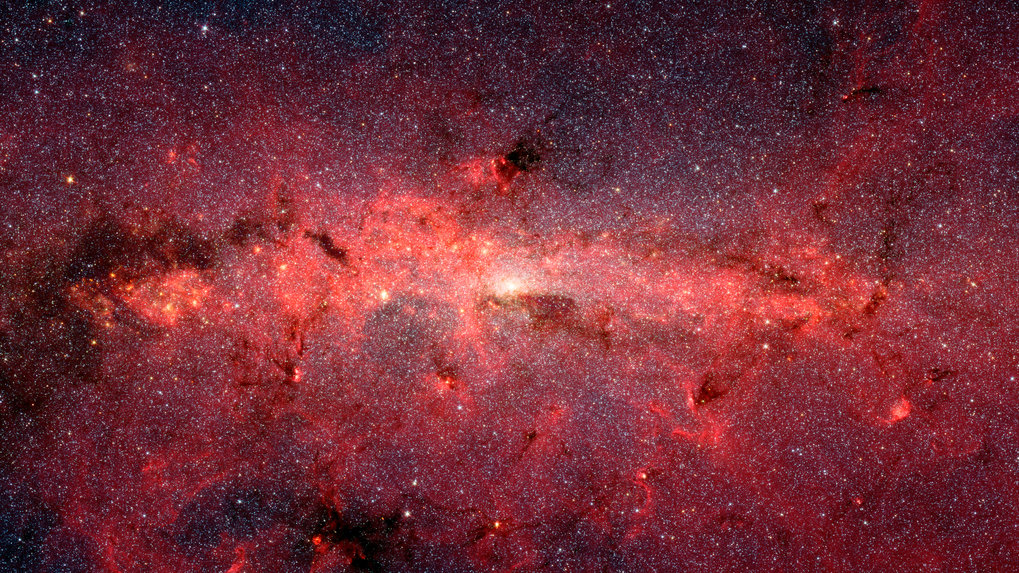
Tuesday, September 29, 2020

Encounter of generations in the heart of the Galaxy

Central region of the Milky Way in infrared light. With this image, NASA's Spitzer Space Telescope has photographed the inner 890 x 640 light years of the Milky Way. The nuclear star cluster is located in a small area near the central massive black hole. The extended structures in the image are mostly clouds of gas and dust from the spiral arms of the Milky Way, which lie in the line of sight between Earth and the Galactic Centre. Image: NASA/JPL-Caltech/S. Solovy (Spitzer Science Center/Caltech).
Hi-res image

Visualisation of a simulation showing the infall of a globular star cluster into the nuclear star cluster of the Milky Way. The colour scale shows the distribution of star densities along the lines of sight within the Galactic Centre. The globular cluster can be recognised as an isolated point that increasingly merges with the nuclear star cluster over the course of 400 million years and dissolves in the process. Despite the resulting mixing of the two star populations, certain properties of the stars of the globular cluster remain. Image: Manuel Arca Sedda et al. (ARI/ZAH)/MPIA.
Hi-res image

Astronomers discover a previously unknown population of stars near the centre of the Milky Way

The centre of our home galaxy is one of the regions richest in stars in the known Universe. Within this region, scientists have now identified a previously unknown, ancient stellar population with surprising properties. An international team of astronomers, with significant participation from the Max Planck Institute for Astronomy, has identified the origin of these stars to be a globular cluster within our galaxy, which moved to the centre of the Milky Way long ago.

On clear and dark nights it is still visible – the milky white, diffuse band of the Milky Way across the night sky. Since the invention of the telescope, scientists have known that this band consists of countless stars. Today, we understand that our home galaxy is mainly a large flat disc of hundreds of billions of stars, surrounded by dust and gas, and it is rotating around its centre.

The nuclear star cluster is one of the regions richest in stars in the known Universe

About 25,000 light years away from Earth, located in the constellation of Sagittarius, lies the centre of the Milky Way. This so-called Galactic Centre was only discovered in the last century and has been the subject of astronomical research ever since.

In the innermost centre of the Milky Way rests an extremely massive black hole. It is surrounded by one of the densest agglomerations of stars in the known Universe – a so-called "Nuclear Star Cluster" (NSC). Astronomers today assume that there are around 20 million stars in the innermost 26 light years of the Galaxy.

However, it is not visible at all without special equipment, because there are numerous dust clouds between us and the Galactic Centre that obscure the visible light. It therefore appears darker than other parts of the Milky Way. Only observations at much shorter or longer wavelengths such as infrared light reveal the structure of this region of the sky, which is actually much more massive than other regions of the galaxy.

The Milky Way is by no means unique, and astronomers now believe that most spiral galaxies could contain both a central black hole and a nuclear star cluster. However, the nuclear star cluster within the Milky Way is the only place where astronomers can resolve individual stars because of its relatively close distance, making it an ideal laboratory for studying the properties of these huge stellar clusters.

A study of the nuclear star cluster as a basis for further insights

This is why astronomers led by Anja Feldmeier-Krause from the European Southern Observatory (ESO) and Nadine Neumayer from the Max Planck Institute for Astronomy (MPIA) in Heidelberg used special instruments at the Very Large Telescope (VLT) in Chile to observe this unique region. In a recently published study, they analysed about 700 stars and not only examined their brightness and colour, but were also able to draw conclusions about their motions and speeds, but also about their chemical structure. These observations form the basis for a number of important discoveries about this so far unexplored part of the galaxy.

The chemical composition of a star is an important indicator in astronomy, as it tells us something about its age. Metallicity – the abundance of heavier elements than hydrogen and helium – is an important quantity. This is because all other elements can only form in those very stars. Therefore, if a star contains a large number of heavy elements such as oxygen, carbon or iron, this means that it must have formed from the remains of a precursor star and is therefore relatively young. Conversely, a low metallicity indicates a very old star, which formed in the early days of the Universe, when there were hardly any heavy elements present in the Cosmos. The metallicity is therefore a direct indication of the age of the respective star and therefore of great importance for astronomers.

A hitherto unknown population of stars hides in the very heart of the Galaxy

In analysing these observations, an international team of researchers led by Tuan Do from the University of California, Los Angeles, and including Nadine Neumayer and Manuel Arca Sedda, both working in the Collaborative Research Centre SFB 881 at the Centre for Astronomy at the University of Heidelberg, has now discovered a previously unknown population of stars within the nuclear star cluster. While the majority of stars in the central region of the Milky Way have higher metallicities than the Sun, the scientists identified a group of stars that contained significantly less heavy elements. In addition, these stars are characterised by a common, higher velocity than that of the surrounding stars, and their direction of motion may be slightly tilted in relation to the galactic plane. The properties of these stars, which account for about 7% of all stars in the nuclear star cluster, are surprisingly similar. It is therefore obvious that these stars have a common origin. But how did they reach the innermost part of the galaxy?

An answer to this question may lie in the formation of a nuclear star cluster: according to a commonly accepted theory, they could at least partly have formed by collisions of several clusters, i.e. spatially denser collections of stars of similar ages, within a galaxy. Held together by the mutual gravitational pull, they move jointly through a bath of surrounding field stars. Stellar clusters exist in all known galaxies. Due to the phenomenon of dynamic friction, a gravitational effect of the surrounding matter, the clusters lose speed on their orbits and thus drift towards the Galactic Centre. At this point, they merge with other clusters and form the much larger nuclear star clusters. It is possible that the newly discovered population is a remnant of such an older group of stars.

Sophisticated simulations help to clarify the history of the nuclear star cluster

To test this theory, the scientists used powerful computer simulations. They calculated a virtual system consisting of many individual objects, mapping the innermost 300 light years of the Milky Way. It includes the nuclear star cluster and the central black hole, as well as a massive star cluster with about 1 million solar masses, which at the beginning of the simulation was about 160 light years from the centre of the galaxy. “Among other things, our goal was to find out how long ago such a stellar cluster could have entered the region around the Galactic Centre and where it originally came from,” explains Arca Sedda.

When a stellar cluster falls towards the Galactic Centre, the gravitational interactions with its environment cause stars to be ejected from the cluster. Once it reaches the innermost part of the Galaxy, it dissolves within a relatively short timescale and its stars become largely indistinguishable from the rest of the stars in its new environment.

Since the members of the newly discovered stellar population still have some very characteristic similarities despite their dispersal, astronomers suspect a common origin of these stars outside the nuclear star cluster. The simulations now suggest that they have entered the central area within the recent 3 to a maximum of 5 billion years.

The origin of the newly discovered stars

But where does the stellar cluster originally come from? There are several possibilities. The scientists have investigated the two most probable ones in their publication: firstly, the stars in a cluster may have come from regions further out in the Milky Way itself, from where they migrated to the centre of the galaxy. Another possibility is also the entry of a dwarf galaxy from around the Milky Way. The remaining galactic core or a large star cluster of this dwarf galaxy could have made it to the Galactic Centre. The scientists investigated both scenarios in their simulation.

“Our results indicate that an infall of a rather nearby stellar cluster from the Milky Way itself is more likely,” explains Neumayer. It was probably originally formed about 10,000 to 16,000 light years away.

To support this hypothesis, the astronomers also compared the observed properties of the newly discovered stellar population with the ones of old globular clusters in the Milky Way and those that entered our Milky Way together with dwarf galaxies. They found that the properties of the newly discovered central stars matched those of globular clusters in the Milky Way much better. The calculated distances of the preceding stellar clusters also correspond well with the distances of those that have been known for a while already. “Although an extragalactic origin of the stars cannot be completely ruled out, it is rather unlikely,” Arca Sedda concludes. “This is an additional sign that the central nuclear star cluster in the galaxy is at least partly the result of the impact of smaller clusters.”

Background information

This work was carried out within the framework of subprojects Z2 and B8 of the Collaborative Research Centre SFB 881 “The Milky Way System” at the University of Heidelberg. Collaborative Research Centres are long-term projects for fundamental research, which are funded by the German Research Foundation (DFG) up to a duration of 12 years.

The SFB 881 is located at the Zentrum für Astronomie der Universität Heidelberg (ZAH) and includes scientists from the Astronomisches Rechen-Institut (ARI), the Institut für Theoretische Astrophysik (ITA) and the Landessternwarte Königstuhl (LSW). The participating non-university research institutions are the Max Planck Institute for Astronomy (MPIA) and the Heidelberg Institute for Theoretical Studies (HITS). In addition, the Haus der Astronomie (HdA) participates by making the SFB's research results available to the public.


Contacts

Nadine Neumayer
Leader Lise Meitner Group “Galactic Nuclei”
Phone:+49 6221 528-446

Max Planck Institute for Astronomy, Heidelberg

Renate Hubele
Public outreach SFB881/ZAH
Phone:+49 6221 528-291

Haus der Astronomie, Heideberg

Markus Nielbock
Press and public relations officer
Phone:+49 6221 528-134

Max Planck Institute for Astronomy, Heidelbe


Original publications

1. Manuel Arca Sedda et al.
On the origin of a rotating metal-poor stellar population in the Milky Way Nuclear Cluster
The Astrophysical Journal Letters, 901, L29 (2020)

Source / DOI

2.Tuan Do et al.
Revealing the Formation of the Milky Way Nuclear Star Cluster via Chemo-Dynamical Modeling
The Astrophysical Journal Letters, 901, L28 (2020)

Source / DOI

3. Anja Feldmeier-Krause et al.
Asymmetric spatial distribution of subsolar metallicity stars in the Milky Way nuclear star cluster
Monthly Notices of the Royal Astronomical Society, 494, 396 (2020)

Source / DOI

Monday, September 28, 2020

Pair of Massive Baby Stars Swaddled in Salty Water Vapor

ALMA composite image of a binary massive protostar IRAS 16547-4247. Different colors show the different distributions of dust particles (yellow), methyl cyanide (CH3CN, red), salt (NaCl, green), and hot water vapor (H2O, blue). Bottom insets are the close-up views of each components. Dust and methyl cyanide are distributed widely around the binary, whereas salt and water vapor are concentrated in the disk around each protostar. In the wide-field image, the jets from one of the protostars, seen as several dots in the above image, are shown in light blue(Download the image without insets). Credit: ALMA (ESO/NAOJ/NRAO), Tanaka et al.

Using the Atacama Large Millimeter/submillimeter Array (ALMA), astronomers spotted a pair of massive baby stars growing in salty cosmic soup. Each star is shrouded by a gaseous disk which includes molecules of sodium chloride, commonly known as table salt, and heated water vapor. Analyzing the radio emissions from the salt and water, the team found that the disks are counter rotating. This is the second detection of salt around massive young stars, promising that salt is an excellent marker to explore the immediate surroundings of giant baby stars.

There are stars of many different masses in the Universe. Smaller ones only have one-tenth the mass of the Sun, while larger ones have 10 times or more mass than the Sun. Regardless of the mass, all stars are formed in cosmic clouds of gas and dust. Astronomers have eagerly studied the origins of stars, however, the process of massive star formation is still veiled. This is because the formation sites of massive stars are located farther from the Earth, and massive baby stars are surrounded by massive clouds with complicated structures. These two facts prevent astronomers from obtaining clear views of massive young stars and their formation sites.

A team of astronomers led by Kei Tanaka at the National Astronomical Observatory of Japan utilized ALMA’s power to investigate the environment where massive stars are forming. They observed the massive young binary IRAS 16547-4247. The team detected radio emissions from a wide variety of molecules. Particularly, sodium chloride (NaCl) and hot water (H2O) are found to be associated in the immediate vicinity of each star, i.e., the circumstellar disk. On the other hand, other molecules such as methyl cyanide (CH3CN), which has commonly been observed in previous studies of massive young stars, were detected further out, but do not trace structures in the vicinity of stars well.

“Sodium chloride is familiar to us as table salt, but it is not a common molecule in the Universe,” says Tanaka. “This was only the second detection of sodium chloride around massive young stars. The first example was around Orion KL Source I, but that is such a peculiar source that we were not sure whether salt is suitable to see gas disks around massive stars. Our results confirmed that salt is actually a good marker. Since baby stars gain mass through disks, it is important to study the motion and characteristics of disks to understand how the baby stars grow.”

Further investigation of the disks shows an interesting hint to the origin of the pair. “We found a tentative sign that the disks are rotating in opposite directions,” explains Yichen Zhang, a researcher at RIKEN. If the stars are born as twins in a large common gaseous disk, then naturally the disks rotate in the same direction. “The counter-rotation of the disks may indicate that these two stars are not actual twins, but a pair of strangers which were formed in separated clouds and paired up later.” Massive stars almost always have some companions, and thus it is pivotal to investigate the origin of massive binary systems. The team expects that further observation and analysis will provide more dependable information on the secrets of their birth.

The presence of heated water vapor and sodium chloride, which were released by the destruction of dust particles, suggests the hot and dynamic nature of disks around massive baby stars. Interestingly, investigations of meteorites indicate that the proto-Solar System disk also experienced high temperatures in which dust particles were evaporated. Astronomers will be able to trace these molecules released from dust particles well by using the next generation Very Large Array [1] , currently under planning. The team anticipates that they can even obtain clues to understand the origin of our Solar System through studying hot disks with sodium chloride and hot water vapor.

The baby stars IRAS 16547-4247 are located 9500 light-years away in the constellation Scorpius. The total mass of the stars is estimated to be 25 times the mass of the Sun, surrounded by a gigantic cloud with the mass of 10,000 Suns.

Artist’s impression of the massive protobinary IRAS 16547-4247. Each protostar is surrounded by a small gas disk and they are embedded in the larger disk. Both protostars eject molecular gas outflows, while one emanates a collimated jet which collides with the surrounding gas and creates bright spots along the stream. Credit: ALMA (ESO/NAOJ/NRAO)

Paper and Research Team

These observation results were published as K. E. I. Tanaka et al. “Salt, Hot Water, and Silicon Compounds Tracing Massive Twin Disks” in the Astrophysical Journal Letters on August 25, 2020.

The research team members are:
Kei E. I. Tanaka (National Astronomical Observatory of Japan/Osaka University), Yichen Zhang (RIKEN), Tomoya Hirota (National Astronomical Observatory of Japan/SOKENDAI), Nami Sakai (RIKEN), Kazuhito Motogi (Yamaguchi University), Kego Tomida (Tohoku University/Osaka University), Jonathan C. Tan (Chalmers University of Technology/University of Virginia), Viviana Rosero (National Radio Astronomy Observatory), Aya E. Higuchi (National Astronomical Observatory of Japan), Satoshi Ohashi (RIKEN), Mengyao Liu (University of Virginia), and Koichiro Sugiyama (National Astronomical Research Institute of Thailand/National Astronomical Observatory of Japan)

This research was supported by JSPS KAKENHI (No. JP19H05080, 19K14760, 19K14774, 17K05398, 19H05082, 19H01937, 16H05998, 17KK0091, 18H05440, 20K14533), NAOJ ALMA Scientific Research Grants (No. 2017-05A), ERC project MSTAR, VR grant 2017-04522, and the RIKEN Special Postdoctoral Researcher Program.

The Atacama Large Millimeter/submillimeter Array (ALMA), an international astronomy facility, is a partnership of the European Southern Observatory (ESO), the U.S. National Science Foundation (NSF) and the National Institutes of Natural Sciences (NINS) of Japan in cooperation with the Republic of Chile. ALMA is funded by ESO on behalf of its Member States, by NSF in cooperation with the National Research Council of Canada (NRC) and the Ministry of Science and Technology (MOST) in Taiwan and by NINS in cooperation with the Academia Sinica (AS) in Taiwan and the Korea Astronomy and Space Science Institute (KASI).

ALMA construction and operations are led by ESO on behalf of its Member States; by the National Radio Astronomy Observatory (NRAO), managed by Associated Universities, Inc. (AUI), on behalf of North America; and by the National Astronomical Observatory of Japan (NAOJ) on behalf of East Asia. The Joint ALMA Observatory (JAO) provides the unified leadership and management of the construction, commissioning and operation of ALMA.

[1] The next generation Very Large Array (ngVLA) is a project to construct a large set of radio telescopes in the United States, led by the U. S. National Radio Astronomy Observatory. The VLA is expected to make significant contributions to various research topics, including planet formation, interstellar chemistry, galaxy evolution, pulsars, and multi-messenger astronomy.


Friday, September 25, 2020

How galaxies have produced their stars: ASPECS survey provides key chapter of cosmic history

The Hubble Ultra-Deep Field (UDF, left) is one of the best-studied regions of the sky. Using the Hubble Space Telescope, astronomers have identified hundreds of galaxies in the UDF. The light of the most distant of those galaxies has travelled more than 13 billion years to reach us. The right-hand image shows the same region on the sky, observed as part of the ASPECS ALMA Large Program. That image shows millimeter waves emitted by the dust of the UDF galaxies. It provides the deepest view of the distant dusty universe to date. Credit: Space Telescope Science Institute and ASPECS team

Astronomers have used the ALMA observatory to trace the fuel for star formation – molecular hydrogen gas – in the iconic Hubble Ultra-Deep Field, one of the best-studied regions of the sky. The observations allowed a group led by Fabian Walter of the Max Planck Institute for Astronomy to track how the universe’s inventories of gas and dust have changed over time from just two billion years after the big bang to the present. Comparing their own observations with additional observational data and modern simulations, the astronomers were able to characterize and quantify the gas flows that are necessary prerequisites for the formation of stars within galaxies. The result is a broad-brush history of cosmic star formation that includes all the important pieces: the history of star production itself as well as information about the supply chain that enables stars to be produced in the first place.

Tracing the origin of a common household item, like an appliance, amounts to reconstructing a supply chain: the raw materials transformed into more elaborate components, and those components assembled into a finished product. If supplies are missing, production will slow down, or might even grind to a halt. Documenting the factory's inventory of the necessary components or raw material is a useful way of learning about the production history. 

When galaxies form stars, there is of course no planning behind it, economic or otherwise. Stars form whenever the conditions are right for them to form, whenever the right material is available. In order to produce stars, we need cool gas made of hydrogen molecules. Such cool gas is produced when a sufficiently dense cloud of warmer gas made of hydrogen atoms cools down – under the right conditions, the hydrogen atoms pair off, each pair forming a hydrogen molecule H2

The atomic hydrogen inventory can be replenished as well. There is a huge reservoir of ionized hydrogen in the vast spaces between galaxies, warm intergalactic plasma that contains more than 90% of all hydrogen in the universe. Keep track of how those inventories change over time, reconstruct the supply chain, and you can learn about the production history of stars. Keeping track of change is possible because astronomers always look into the past.

A deep look into cosmic history

If we point our telescopes at one of our nearest neighbors, the Andromeda galaxy M31, we see that galaxy as it was 2.5 million years ago, because it took the light we receive now 2.5 million years to travel from Andromeda to us. We cannot observe our own past that way, but we can do the next best thing: All our current knowledge points towards the fact that, on average, the universe is the same everywhere. Regardless of where in the cosmos we are: If we consider a suitably large region, at the present time, we will always find about the same number of larger galaxies, the same number of smaller galaxies, roughly the same number of stars, and the same amount of molecular gas.

That allows astronomers to reconstruct a cross-section of cosmic history. If you want to know what the average properties of the universe were, say, a billion years ago, look at objects so distant that their light takes a billion years to reach us! Repeat the process for different distances, corresponding to different cosmic epochs, and you will obtain at least an average history of the cosmos. The details will vary, but the big picture of cosmic evolution obtained in this way should be valid universally, providing clues about our own cosmic history over the past billions of years.

The history of stellar production rates

Over the past two decades, deep sky surveys using visible light and infrared radiation have given us a fairly complete picture of how many stars there were in galaxies in each cosmic epoch, from the first billion years after the big bang to the present. Particularly important was the Hubble Ultra-Deep Field (UDF): a small region in the sky, about one tenth the apparent diameter of the full moon, where the Hubble Space Telescope captured hundreds of images between 2003 and 2004, with a total of nearly 16 days exposure time, which were then combined into a single image. 

The UDF and other surveys lead to a consistent picture of star formation history, with star production ramping up to a veritable boom some 10 billion years ago, followed by a continuous decline in production rates. Half the stars in the universe had already been produced by the time the universe was 4.5 billion years old, a third of its current age. But why the increase and decline? To answer that, it makes sense to see how much raw material, molecular hydrogen, was available at different times.

The ASPECS observations revealed a three-dimensional view of distant galaxies in the Hubble Ultra-Deep Field (UDF). The third dimension, depth, comes into play because of the cosmological redshift. ALMA observes molecular gas using spectral lines of carbon monoxide. For more distant galaxies, those lines are shifted towards lower frequencies due to the expansion of the universe. ALMA allows astronomers to determine the frequencies of dust emissions in the UDF. Thanks to cosmic expansion, that third dimension of the observations, frequency, is equivalent to line-of-sight distance, resulting in a three-dimensional overall image. The figure shows a rendering of the ALMA data in which the ‘islands’ in the volume correspond to molecular gas emission lines of distant galaxies. Credit:Space Telescope Science Institute and ASPECS team

Molecular gas: the missing piece of the puzzle

This is where ASPECS comes in, the ALMA Spectroscopic Survey in the Hubble Ultra-Deep Field, organised by Fabian Walter (MPIA) and his colleagues. The astronomers used the ALMA observatory in Chile, fully operational since 2013, which can combine up to 50 large (sub)millimeter telescopes in what is called interferometry: a technique that combines telescopes in a way that allows the imaging of fine details that would only be accessible to a much larger single telescope. 

For studying molecular gas in distant galaxies, facilities like ALMA are ideal. Detecting cosmic molecules requires measuring light at specific wavelengths. Because our universe is expanding, there is what is known as the cosmological redshift: The more distant a galaxy is, the farther its light is shifted towards longer wavelengths. For distant galaxies, the wavelengths needed to deduce the presence of hydrogen molecules fall into the millimeter region of the electromagnetic spectrum, corresponding to short radio waves – which is exactly what ALMA was designed to observe. 

The overall collecting area of ALMA is much larger than for any previous millimetre/submillimetre telescopes, so the observatory is very sensitive. That is necessary, as the light reaching us from galaxies billions of light-years away is exceedingly faint. Before ALMA, a survey with the sensitivity of ASPECS would not have been possible. Even with ALMA, ASPECS needed a total of almost 200 hours of observation time, which makes it one of ALMA's so-called large programs – the first such program specifically searching for molecular gas in the distant universe.

An unbiased view of Hubble Ultra-Deep-Field

In order to yield information that can be generalized to the universe as a whole, a survey such as ASPECS needs to be unbiased. (Consider the analogous situation of an opinion poll: In order to reconstruct public opinion, you will need a representative sample of respondents.) To that end, ASPECS chose the best-studied region of the sky, at least when it comes to distant galaxies: the Hubble Ultra-Deep Field (UDF). The combined image Hubble Ultra-Deep Field contains around 10,000 identifiable galaxies. Light from the most distant galaxy took 13 billion years to reach us. (For comparison: The big bang happened 13.8 billion years ago.) ASPECS scanned the Hubble Ultra-Deep Field at wavelengths around 1.3 mm and 3 mm. In their survey, the researchers followed an observational approach that had been shown to work well through a number of pilot programs, both with the IRAM Plateau de Bure Interferometer and with earlier ALMA observations. At those specific wavelengths, the Earth's atmosphere is virtually transparent, in particular at high-elevation locations such as the Chajnantor plateau in Chile where ALMA is located, at an elevation of 5000 meters.

More specifically, at each location within the Hubble Ultra-Deep Field, the astronomers took two spectra, carefully mapping the intensity of light received at different wavelengths between 1.1 and 1.4 mm, and also between 2.6 and 3.6 mm. In such spectra, molecules reveal themselves via so-called emission lines – narrow wavelength regions where there is a sharp maximum of intensity. While molecular hydrogen has no detectable emission lines, a molecule that is typically found in its company does: Carbon monoxide CO has a number of clearly detectable lines. 

From the nearby cosmos, we know that in a typical interstellar gas cloud, for each CO molecule, you will find on the order of 10,000 hydrogen molecules. As hydrogen molecules bump into CO molecules, the CO molecules gain energy – which they then emit in the form of electromagnetic radiation, at the wavelengths corresponding to their emission line. Measure the intensity of those CO lines, and you can deduce the amount of molecular hydrogen that is around in that specific region, occasionally bumping into CO. By taking into account the redshift observed for a particular set of lines, it is possible to reconstruct the distance of the gas in question: in an expanding universe like ours, the (cosmological) redshift is directly related to an object's distance from us. In this way, ASPECS was able to probe the cosmological volume of the Ultra-Deep Field, mapping gas-cloud positions in three dimensions.

Keeping track of galaxies-ant their molecular gas

The estimate can be made more precise by combining it with another method. Because cosmic dust acts as a catalyst in the formation of molecular hydrogen, there is a correlation between the amount of dust and molecular hydrogen present. ALMA can measure the thermal radiation from that dust in parallel to the CO, allowing for a cross-check. 

In the end, the ASPECS data provided the deepest view of the dusty universe to date, and was able to pinpoint which of the many galaxies visible in the Hubble Space Telescope observations are rich in molecular gas and dust: the material that is essential for star formation to proceed. These galaxies showed a wide range of physical properties: many of them are "normal galaxies" (with average stellar masses and star formation rates), but others are classified as starbursts (with unusually high star formation activity) or quiescent galaxies (unusually low activity).

Reconstructiin the star-production supply chain

Once they had made their observations, Fabian Walter and his colleagues were ready to reconstruct the history of molecular hydrogen supplies throughout cosmic history – more specifically: from about 2 billion years after the big bang (nearly 12 billion years ago) to the present. To this end, they drew together the data from previous studies, namely data about atomic hydrogen and about the total mass of all stars in a given epoch. They also compared their findings with large-scale simulations of cosmic history from the big bang to the present.

If you are not an astronomer, the resulting history might not sound all that exciting, compared to the human history you know and can relate to. But for astronomers, it captures deep truths about how our cosmos has changed over time. In that history, the amount of molecular hydrogen steadily increased until about 10 billion years ago, about 4 billion years after the big bang (at about cosmic redshift z=1.5, to use the astronomers' preferred way of denoting a cosmic epoch), with the inventory almost doubling within 3 billion years. This evolution had already been suggested by previous studies. But it is only now that the observations were sufficiently accurate for the firm conclusion that cosmic gas density rises and falls over cosmic time. That rise, then, corresponds to the Golden Age of star formation: With plenty of raw material just waiting to be turned into blazing suns, and with half of the stars that ever existed coming into being in that first third of cosmic history. At the high point, there was about as much molecular hydrogen as there was atomic hydrogen.

What is behind the history of star formation?

In comparing their data with simulations, the astronomers found that behind those boom times was a combination of factors. Galaxies are only the visible tip of the iceberg – their backbone, so to speak, are accumulations of dark matter, matter that does not interact with electromagnetic radiation and thus remains invisible to direct observations. Dark matter accounts for about 80% of all mass in the universe. Just like all other matter, dark matter started out distributed almost perfectly homogeneously through the cosmos shortly after the big bang, but has clumped, and thus become increasingly inhomogeneous, owing to mutual gravitational attraction. In the present-day universe, on a scale of hundreds of millions of light-years, dark matter forms a sponge-like network of filaments, sprinkled with particularly dense regions known as halos. 

Galaxies formed as ordinary matter, mostly hydrogen gas, was drawn into those halos, following their gravitational attraction: First, plasma falls onto halos from the huge reservoir in intergalactic space, cooling down to form atoms. This process replenishes the supply of atomic hydrogen within galaxies. Then, the atomic hydrogen is drawn towards the centers of galaxies, cooling down further until it forms molecular hydrogen, and eventually stars. Through the ASPECS observations, Walter and his colleagues were able to quantify these gas flows as a function of cosmic time.

Looking towards the future, as halo growth slows down and less hydrogen plasma is drawn onto galaxies, star production becomes less and less effective. At the present time, galaxies form stars at a mere tenth of the production rate of the Golden Age. Production rates have been in sharp decline for the past 9 billion years. Based on their observations, Walter and his colleagues predict a continuing trend: Over the next 5 billion years, the molecular gas reservoirs will shrink by an additional factor of 2, while the total mass of stars in the universe increases by a mere 10%. In this picture, star production would eventually cease altogether.

Next Steps

The ASPECS observations were designed to be very sensitive, by summing up the light from a larger region in each image pixel. But that automatically meant they could not distinguish smaller details – such as mapping the molecular hydrogen within each galaxy. But now that the combination and ASPECS and Ultra-Deep Field images has enabled astronomers to pinpoint its gas-rich and dust-rich galaxies, the next step will be to take a closer look at those galaxies individually. ALMA has a high-resolution mode that is ideal for that kind of close scrutiny.

This would allow Walter and his colleagues to compare the structure of the molecular gas and dust in those galaxies to the distribution of stars – are the two directly related? Do we indeed find molecular gas and dust in the same region where we find young stars? The more detailed measurements would also yield information about key parameters such as the kinematics, temperature and density of the gas.

With that new ALMA data, plus complementary results from observing campaigns of the Ultra-Deep Field planned for the upcoming James Webb Space Telescope (JWST), the astronomers hope to reconstruct the cosmic history of star formation in even more detail.


 Background information 

The results described here have been accepted for publication as F. Walter et al., " The Evolution of the Baryons Associated with Galaxies Averaged over Cosmic Time and Space" in The Astrophysical Journal.

Original article for this press release:

The ASPECS collaboration is presenting their results on a new website, that will be open to the public from 24 September 2020 onwards. The website also features images, videos and an interactive presentation of the ASPECS results: 

The research was carried out by MPIA's Fabian Walter, Marcel Neeleman and Hans-Walter Rix in collaboration with Manuel Aravena (Universidad Diego Portales, Chile), Chris Carilli (NRAO, Socorro, USA) and Roberto Decarli (INAF, Bologna , Italy).

The research is part of the of the project Cosmic_Gas that has received funding from the European Research Council (ERC) under the European Union's Horizon 2020 research and innovation programme (Grant agreement No. 740246). 

The Atacama Large Millimeter/submillimeter Array (ALMA), an international astronomy facility, is a partnership of ESO, the U.S. National Science Foundation (NSF) and the National Institutes of Natural Sciences (NINS) of Japan in cooperation with the Republic of Chile. ALMA is funded by ESO on behalf of its Member States, by NSF in cooperation with the National Research Council of Canada (NRC) and the National Science Council of Taiwan (NSC) and by NINS in cooperation with the Academia Sinica (AS) in Taiwan and the Korea Astronomy and Space Science Institute (KASI). ALMA construction and operations are led by ESO on behalf of its Member States; by the National Radio Astronomy Observatory (NRAO), managed by Associated Universities, Inc. (AUI), on behalf of North America; and by the National Astronomical Observatory of Japan (NAOJ) on behalf of East Asia. The Joint ALMA Observatory (JAO) provides the unified leadership and management of the construction, commissioning and operation of ALMA. 


Source:  Max Planck Institute for Astronomy


Thursday, September 24, 2020

Dark Matter Surplus

NGC 5585
Credit: ESA/Hubble & NASA, R. Tully
Acknowledgement: Gagandeep Anand

Resting on the tail of the Great Bear in the constellation of Ursa Major, lies NGC 5585, a spiral galaxy that is more than it appears.

The many stars, and dust and gas clouds that make up NGC 5585, shown here in this Hubble image, contribute only a small fraction of the total mass of the galaxy. As in many galaxies, this discrepancy can be explained by the abundant yet seemingly invisible presence of dark matter.

The stellar disc of the galaxy extends over 35 000 light-years across. When compared with galaxies of a similar shape and size, NGC 5585 stands out by having a notably different composition: Contributing to the total mass of the galaxy, it contains a far higher proportion of dark matter.

Hotspots of star formation can be seen along the galaxy’s faint spiral arms. These regions shine a brilliant blue, contrasting strikingly against the ever-black background of space.


Source: ESA/Hubble/News


The wobbling shadow of the M87* black hole

Snapshots of the M87* black hole obtained through imaging/geometric modeling, and the EHT array of telescopes from 2009 to 2017. The diameter of all rings is similar, but the location of the bright side varies.  CreditsImage courtesy of M. Wielgus, D. Pesce, and the EHT Collaboration.

Analysis of Event Horizon Telescope observations from 2009 to 2017 reveals turbulent evolution of the M87* black hole image.

In 2019, the Event Horizon Telescope (EHT) Collaboration, including a team of MIT Haystack Observatory scientists, delivered the first image of a black hole, revealing M87* — the supermassive object in the center of the M87 galaxy. The EHT team has used the lessons learned last year to analyze the archival data sets from 2009 to 2013, some of which were not published before. The analysis reveals the behavior of the black hole image across multiple years, indicating persistence of the crescent-like shadow feature, but also variation of its orientation — the crescent appears to be wobbling. The full results appear today in The Astrophysical Journal in an article titled, “Monitoring the Morphology of M87* in 2009–2017 with the Event Horizon Telescope.”

The EHT is a global array of telescopes, performing synchronized observations using the technique of very long baseline interferometry. Together they form a virtual Earth-sized radio dish, providing a uniquely high image resolution. In 2009–13, M87* was observed by early-EHT prototype arrays, with telescopes located at three geographical sites from 2009 to 2012 and four sites in 2013. In 2017, the EHT reached maturity with telescopes located at five distinct geographical sites across the globe.

Datasets for this research were fully correlated at MIT Haystack Observatory. The 2009–2013 observations consist of less data than the ones performed in 2017, making it impossible to create an image. But the EHT team was able to use statistical modeling to look at changes in the appearance of M87* over time. In the modeling approach, the data are compared to a family of geometric templates, in this case rings of non-uniform brightness. A statistical framework is then employed to determine if the data are consistent with such models and to find the best-fitting model parameters.

“This is a beautiful example of creative data analysis. Extracting important new astrophysical understanding and squeezing new insight out of previous observations is an imaginative example of how scientists can maximally use the information content of such painstakingly collected data,” says Colin Lonsdale, director of MIT Haystack Observatory and chair of the EHT Collaboration Board. “The behavior of this event horizon scale structure over a period of years allows important additional constraints to be placed on the properties of this fascinating object.”

Expanding the analysis to the 2009–2017 observations, EHT scientists have shown that M87* adheres to theoretical expectations. The black hole’s shadow diameter has remained consistent with the prediction of Einstein’s theory of general relativity for a black hole of 6.5 billion solar masses.

“In this study, we show that the general morphology, or presence of an asymmetric ring, most likely persists on timescales of several years,” says Kazu Akiyama, research scientist at MIT Haystack Observatory and a participant in the project. “The consistency throughout multiple observational epochs gives us more confidence than ever about the nature of M87* and the origin of the shadow.”

Although the crescent diameter remained consistent, the EHT team found that the data were hiding a surprise: The ring is wobbling, and that means big news for scientists. For the first time, they can get a glimpse of the dynamical structure of the accretion flow so close to the black hole’s event horizon, in extreme gravity conditions. Studying this region holds the key to understanding phenomena such as relativistic jet launching, and will allow scientists to formulate new tests of the theory of general relativity.

The gas falling onto a black hole heats up to billions of degrees, ionizes, and becomes turbulent in the presence of magnetic fields. “Because the flow of matter is turbulent, the crescent appears to wobble with time,” says Maciek Wielgus of the Harvard and Smithsonian Center for Astrophysics, who is a Black Hole Initiative fellow, and lead author of the paper. “Actually, we see quite a lot of variation there, and not all theoretical models of accretion allow for so much wobbling. What it means is that we can start ruling out some of the models based on the observed source dynamics.”

“MIT Haystack Observatory was instrumental in organizing these early observations, correlating the massive amounts of data returned on large numbers of hard drives, and reducing the data,” says Vincent Fish, research scientist at Haystack Observatory. “While we were able to place important constraints on the size and nature of the emission in M87* at the time, the images made from the much better 2017 array data provided critical context for fully understanding what the earlier data were trying to tell us.”

Haystack scientist Geoff Crew adds, “After working on EHT technology for a decade, I’m gratified that M87* has been making equally good use of its time.”


  MIT Haystack Observatory


Wednesday, September 23, 2020

NASA's Webb Will Explore the Cores of Merging Galaxies

Although the two galaxies in NGC 3256 appear merged when viewed in visible light, a second, bright nucleus is found hiding among the tangle of dust lanes in the central region. By using a range of telescopes on the ground and in space, the GOALS (Great Observatories All-sky LIRG Survey) research team has been analyzing galaxies like NGC 3256 from X-ray through radio wavelengths. NGC 3256 has a buried active nucleus, large-scale shocks from two powerful outflows, and a huge number of compact, bright star clusters. Upcoming research with the James Webb Space Telescope will help researchers learn more about the outflows, which will allow them to better model the hot and cold gas, and determine what implications that has for how and where stars form in rapidly evolving galaxies.Credits: NASA, ESA, the Hubble Heritage (STScI/AURA)-ESA/Hubble Collaboration, and A. Evans (University of Virginia, Charlottesville/NRAO/Stony Brook University).
Hi-res image

When galaxies collide, it's as if all the players in a symphony have begun a furious crescendo: As their stars and gas fall toward the center, star formation escalates. At the same time, the galaxies' black holes engorge themselves and light up, releasing energy and material into the surrounding gas. These "overtures," which continue for hundreds of millions of years, are brightest where the centers of galaxies – called nuclei – merge, and those areas are also filled with dust. Until now, high-resolution infrared observations from space that can pierce through the dust weren't possible. NASA's James Webb Space Telescope's observations will return both infrared imagery and spectra that will allow researchers to add incredible detail to our understanding of the precise mechanics at work.

A research team led by Lee Armus of the California Institute of Technology/IPAC in Pasadena and Aaron Evans of the University of Virginia and the National Radio Astronomy Observatory in Charlottesville will study the centers of a class of interacting galaxies known as merging luminous infrared galaxies. "Webb's instruments will provide huge leaps in our abilities to resolve what is happening in these galaxies," explained Armus. "The images and spectra will not only be 50 to 100 times more sensitive than previous infrared data, but also significantly sharper."

These merging galaxies are often gas-rich spiral galaxies, which means they are still forming stars before colliding. As they approach one another and conduct a delicate "dance," gas in the galaxies loses angular momentum and funnels toward the center. This triggers additional star formation at an accelerated rate, up to hundreds of solar masses per year compared to one or two per year observed in normal star-forming galaxies like our own. While stars are forming, they heat the surrounding dust, generating enormous amounts of energy in infrared light.

Since the galaxies that make up NGC 7469 are both almost face-on when viewed from Earth, it's easier to identify the areas where a black hole may exist. A powerful accreting supermassive black hole, surrounded by a ring of young stars, lives at the heart of the galaxy in the upper right. High-resolution infrared imagery from the James Webb Space Telescope is required to determine if the stars form differently around a central supermassive black hole compared to star formation farther out in the galaxy's arms. Webb will also help researchers trace the gas outflows, which will help pinpoint where and how the interstellar medium is affected, which subsequently drives or quenches star formation. Credits: NASA, ESA, the Hubble Heritage (STScI/AURA)-ESA/Hubble Collaboration, and A. Evans (University of Virginia, Charlottesville/NRAO/Stony Brook University).
Hi-res image

Webb's high-resolution, infrared instruments will allow researchers to resolve the central star-forming regions for the first time. "We are aiming to observe areas as small as 150 to 300 light-years across," said Evans. "For context, these galaxies span hundreds of millions of light-years across. Webb will strip away all the dust and see the activity that’s at their cores."

Pulling back the "Dusty" Curtain

Each of the team's targets is part of a much larger, multi-decade program known as GOALS, the Great Observatories All-sky LIRG Survey. The research team has studied more than 200 merging luminous infrared galaxies across the electromagnetic spectrum, from radio and ultraviolet light to visible and X-ray light, building robust data sets for each.

These merging galaxies, known as II Zw 096, are the site of a spectacular burst of star formation that is hinted at in the red speckles near the middle of the image. This dust-shrouded area conceals a brilliant burst of star formation that becomes more apparent at longer wavelengths of infrared light. The image above combines near-infrared, visible, and far-ultraviolet observations from the Hubble Space Telescope. Researchers using infrared data from NASA's Spitzer Space Telescope estimated the starburst, which lives in a small red region at the center of this image, is cranking out stars at the breakneck pace of around 100 solar masses per year. The upcoming James Webb Space Telescope will allow researchers to penetrate the dust and search for a buried, rapidly growing supermassive black hole. Credits: NASA/JPL-Caltech/STScI/H. Inami (SSC/Caltech).
Hi-res image

The researchers carefully selected four targets – each made up of two galaxies – to produce a far more complete view of the activity that's occurring in these merging galaxies by adding high-resolution infrared data. They have a range of characteristics, though all are marked by intense star formation or an actively feeding supermassive black hole:

  • Two nuclei are at the center of NGC 3256, but one is largely hidden by dark bands of dust, making infrared observations essential to fully understand where stars are forming and where black holes may lie – as well as how they influence one another. Strong galactic winds emerge from both nuclei, but their properties are largely unknown.
  • NGC 7469 has a starburst ring, and a central bright active galactic nucleus with a jet. Webb's observations will help the researchers determine how the central, active nucleus is influencing star formation in the center of the galaxy.
  • Dust also shrouds one of the pair of galaxies making up VV 114. Though it is known that widespread star formation is occurring throughout both interacting galaxies, one shines brightly in the infrared and the other in ultraviolet light. Webb will give us the clearest view yet of this fascinating and complex merging pair.
  • II Zw 096 is unique among GOALS galaxies since the source of its immense infrared power comes from a very compact region not associated with the nuclei of either of the merging galaxies. This object is producing stars nearly 100 times faster than the Milky Way, but in a region less than one ten-thousandth the area. Webb will follow up on observations of these galaxies by NASA’s retired Spitzer Space Telescope, allowing researchers to penetrate the dust and search for a buried, rapidly growing supermassive black hole.

To uncover the processes that cause these conditions, it's essential to pinpoint where and how fast stars are forming, and to measure how much gas the central black holes are accreting with Webb's infrared observations. "All of these objects, including stars and black holes, are competing for resources," Armus explained. "Black holes need gas to grow, and as they grow they become energetic and drive outflows. In turn, those outflows affect how stars form by heating and pushing away the gas. With Webb, we will have the ability to understand what the interplay is between all of these processes."

Discover how telescopes make it possible to look back in time and study the history of the universe, and how NASA’s James Webb Space Telescope will fill in new details on galaxy evolution over time. The earliest pages of cosmic history are blank, but Webb will allow us to look back farther in time than ever before, helping to fill in the lost pages of the universe’s story. Credits: NASA, ESA, CSA, and L. Hustak and D. Player (STScI). 

In addition to images, Webb will gather spectra from the centers of these four merging galaxies. "The images will tell us where things are, but spectra provide the really rich information: They tell you what is there and how it may be moving," said co-investigator Vivian U of the University of California, Irvine.

To understand what's happening at the centers of these merging galaxies, the team needs both imagery and highly detailed spectral maps of the active regions around the nuclei – far better than spectra that deliver an average of the entire area observed. Webb's Near Infrared Spectrograph (NIRSpec) and its Mid-Infrared Instrument (MIRI) can do exactly this, which will allow researchers to measure not only what is there, but also the physical conditions within the star-forming regions at the nucleus for the first time.

"Dust lanes are beautiful until you try to find out what's happening behind them," U continued. "In near- and mid-infrared, we will start seeing through the dust. And by observing what's happening at small scales for the first time, we will learn how gas and dust are affecting star formation and the interstellar medium in these environments."

Far-reaching Research Implications

Although theoretical models of merging galaxies demonstrate how stars form, they currently do not precisely account for how supermassive black holes and lots of hot young stars impact their surrounding environments, or how gas moves within galaxy mergers. The Webb data should give researchers a clear look at the centers of merging galaxies and inform a new generation of models that will describe how galaxies interact and merge.

As part of this study, the team will update and deliver software, first written for Spitzer Space Telescope data, to fit the Webb spectra and generate maps of the galaxies in different emission lines and colors. The team will also use this software to map the dynamics of the gas around the nuclei and study how outflows shape their evolution.

In addition to benefiting scientists who research these or similar objects, this program will also demonstrate Webb's capabilities in a wide range of scientific applications, helping other scientists effectively and efficiently use the observatory to meet their own science goals and provide a detailed look at nearby galaxies that may resemble young systems in the early universe.

This research is being conducted as part of a Webb Director’s Discretionary-Early Release Science (ERS) program. This program provides time to selected projects early in the telescope's mission, allowing researchers to quickly learn how best to use Webb's capabilities, while also yielding robust science.

The James Webb Space Telescope will be the world's premier space science observatory when it launches in 2021. Webb will solve mysteries in our solar system, look beyond to distant worlds around other stars, and probe the mysterious structures and origins of our universe and our place in it. Webb is an international program led by NASA with its partners, ESA (European Space Agency) and the Canadian Space Agency.

By Claire Blome  
Space Telescope Science Institute, Baltimore, Md.  

cBlome@stsci.edu

Editor: Lynn Jenner


Monday, September 21, 2020

VLBA Makes First Direct Distance Measurement to Magnetar

Artist's conception of a magnetar -- a superdense neutron star with an extremely strong magnetic field. In this illustration, the magnetar is emitting a burst of radiation. Credit: Sophia Dagnello,  NRAO/AUI/NSF. Hi-Res File

By observing an object from opposite sides of the Earth's orbit around the Sun, as illustrated in this artist's conception, astronomers were able to detect the slight shift in the object's apparent position with respect to much more distant background objects. This effect, called parallax, allows scientists then to use geometry to directly calculate the distance to the object -- in this case a magnetar within our own Milky Way galaxy. The illustration is not to scale. Credit: Sophia Dagnello, NRAO/AUI/NSF. 
Hi-Res File

Astronomers using the National Science Foundation’s Very Long Baseline Array (VLBA) have made the first direct geometric measurement of the distance to a magnetar within our Milky Way Galaxy — a measurement that could help determine if magnetars are the sources of the long-mysterious Fast Radio Bursts (FRBs).

Magnetars are a variety of neutron stars — the superdense remains of massive stars that exploded as supernovae — with extremely strong magnetic fields. A typical magnetar magnetic field is a trillion times stronger than the Earth’s magnetic field, making magnetars the most magnetic objects in the Universe. They can emit strong bursts of X-rays and gamma rays, and recently have become a leading candidate for the sources of FRBs.

A magnetar called XTE J1810-197, discovered in 2003, was the first of only six such objects found to emit radio pulses. It did so from 2003 to 2008, then ceased for a decade. In December of 2018, it resumed emitting bright radio pulses.

A team of astronomers used the VLBA to regularly observe XTE J1810-197 from January to November of 2019, then again during March and April of 2020. By viewing the magnetar from opposite sides of the Earth’s orbit around the Sun, they were able to detect a slight shift in its apparent position with respect to background objects much more distant. This effect, called parallax, allows astronomers to use geometry to directly calculate the object’s distance.

“This is the first parallax measurement for a magnetar, and shows that it is among the closest magnetars known — at about 8100 light-years — making it a prime target for future study,” said Hao Ding, a graduate student at the Swinburne University of Technology in Australia.

On April 28, a different magnetar, called SGR 1935+2154, emitted a brief radio burst that was the strongest ever recorded from within the Milky Way. While not as strong as FRBs coming from other galaxies, this burst suggested to astronomers that magnetars could generate FRBs.

Fast radio bursts were first discovered in 2007. They are very energetic, and last at most a few milliseconds. Most have come from outside the Milky Way. Their origin remains unknown, but their characteristics have indicated that the extreme environment of a magnetar could generate them.

“Having a precise distance to this magnetar means that we can accurately calculate the strength of the radio pulses coming from it. If it emits something similar to an FRB, we will know how strong that pulse is,” said Adam Deller, also of Swinburne University. “FRBs vary in their strength, so we would like to know if a magnetar pulse comes close or overlaps with the strength of known FRBs,” he added.

“A key to answering this question will be to get more distances to magnetars, so we can expand our sample and obtain more data. The VLBA is the ideal tool for doing this,” said Walter Brisken, of the National Radio Astronomy Observatory.

In addition, “We know that pulsars, such as the one in the famous Crab Nebula, emit ‘giant pulses,’ much stronger than their usual ones. Determining the distances to magnetars will help us understand this phenomenon, and learn if maybe FRBs are the most extreme example of giant pulses,” Ding said.

The ultimate goal is to determine the exact mechanism that produces FRBs, the scientists said.

Ding, Deller, Brisken, and their colleagues reported their results in the Monthly Notices of the Royal Astronomical Society.

The National Radio Astronomy Observatory is a facility of the National Science Foundation, operated under cooperative agreement by Associated Universities, Inc.

Media Contact:

Dave Finley, Public Information Officer
(575) 835-7302

dfinley@nrao.edu

“A Magnetar Parallax,” H. Ding, et al.


Source: National Radio Astronomy Observatory (NRAO)/News


Sunday, September 20, 2020

How Planetary Nebulae Get Their Shapes

Four planetary nebulae as seen by Hubble, showing four of many nebular morphologies. Astrononers used high spatial resolution millimeter-wavelength images of molecules in the winds of fourteen planetary nebulae to conclude that the widely varing shapes of planetary nebulae are primarily the result of the evolution of central stars with orbiting binary companions. Credit: NASA/HST

About seven and one-half billion years from now our sun will have converted most of its hydrogen fuel into helium through fusion, and then burned most of that helium into carbon and oxygen. It will have swollen to a size large enough to fill the solar system nearly to the current orbit of Mars, and lost almost half of its mass in winds. At this stage the very hot remnant star will ionize the ejected material, lighting it up and causing it to glow as a planetary nebula (so-called not because it is a planet but because it surrounds its star). All low-to-intermediate mass stars (stars with between about 0.8 to 8 solar masses) will eventually mature into stars hosting planetary nebulae. This simple description suggests that planetary nebulae should all be spherically symmetric shells, but in fact they come in a wide range of shapes from butterfly or bipolar to eye-like or spiral- shapes. Astronomers think that the stellar wind is somehow responsible for these asymmetries, or perhaps the rapid spinning of the host star plays a role, but so far most of the proposed processes are not efficient enough.

A team of scientists including CfA astronomer Carl Gottlieb used the ALMA facility to study the wind morphology of fourteen planetary nebulae at millimeter wavelengths in an effort to understand the origin of their widely varying structures. Previous observations had found that the winds take complex shapes including arcs, shells, clumps, and bipolar structures, shifting some of the puzzle to how winds acquire their varied structures. The astronomers used high spatial resolution imaging in the emission lines of carbon monoxide and silicon monoxide to map the winds. Comparing the results with other datasets, they conclude that a binary star origin can explain both wind and nebular shapes.

Stars in this mass range, on average, have one companion object orbiting that is more massive than about five Jupiter-masses. Interactions between binary stars are known to dominate the evolution of more massive stars, and the scientists speculate that in these lower mass stars the role of the binary companion can similarly affect the evolution. They estimate the binary’s changing influence on the wind and nebula as the primary star evolves, its wind increases, and the separation grows, and report that they can successfully explain the various nebular morphologies in this evolutionary framework. The new model also solves other related puzzles, such as why certain nebular structures (like disks) tend to be preferentially found around stars with specific chemical enrichments (oxygen or carbon), by tracing them as well to evolutionary stages.

Reference(s): 

"(Sub-)stellar Companions Shape the Winds of Evolved Stars," L. Decin, M. Montargès, A. M. S. Richards, C. A. Gottlieb, W. Homan, I. McDonald, I. El Mellah, T. Danilovich, S. H. J. Wallström, A. Zijlstra, A. Baudry, J. Bolte, E. Cannon, E. De Beck, F. De Ceuster, A. de Koter, J. De Ridder, S. Etoka, D. Gobrecht, M. Gray, F. Herpin, M. Jeste, E. Lagadec, P. Kervella, T. Khouri, K. Menten, T. J. Millar, H. S. P. Müller, J. M. C. Plane, R. Sahai, H. Sana, M. Van de Sande, L. B. F. M. Waters, K. T. Wong, J. Yates, Science 2020, 369, pp. 1443-1444.


 Source:  Smithsonian Astrophysical Observatory (SAO)


Saturday, September 19, 2020

Astronomers Solve Mystery of How Planetary Nebulae Are Shaped

Gallery of stellar winds around cool aging stars, showing a variety of morphologies, including disks, cones, and spirals. The blue color represents material that is coming towards you, red ismaterial that is moving away from you. Image 8, in particular, shows the stellar wind of R Aquilae, which resembles the structure of rose petals. Credit: L. Decin, ESO/ALMA. High Resolution (jpg)- Low Resolution (jpg)

An international team of astronomers focused their observations on stellar winds—particle flows—around cool red giant stars, also known as asymptotic giant branch (AGB) stars. "AGB stars are cool luminous evolved stars that are in the last stages of evolution just before turning into a planetary nebula," said Carl Gottlieb, an astronomer at the Center for Astrophysics | Harvard & Smithsonian, and a co-author on the paper. "Through their winds, AGB stars contribute about 85% of the gas and 35% of the dust from stellar sources to the Galactic Interstellar Medium and are the dominant suppliers of pristine building blocks of interstellar material from which planets are ultimately formed."

Despite being of major interest to astronomers, a large, detailed collection of observational data for the stellar winds surrounding AGB stars—each made using the exact same method—was lacking prior to the study, which resulted in a long-standing scientific misconception: that stellar winds have an overall spherical symmetry. "The lack of such detailed observational data caused us to initially assume that the stellar winds have an overall spherical geometry, much like the stars they surround," said Gottlieb. "Our new observational data shapes a much different story of individual stars, how they live, and how they die. We now have an unprecedented view of how stars like our Sun will evolve during the last stages of their evolution."

Observations with the Atacama Large Millimeter/submillimeter Array (ALMA) in Chile revealed something strange: the shape of the stellar winds didn't conform with scientific consensus. "We noticed these winds are anything but round," said Professor Leen Decin of KU Leuven University in Belgium, and the lead author on the paper. "Some of them are actually quite similar to planetary nebulae." The new findings may have a significant impact on calculations of galactic and stellar evolution, most pointedly for the evolution of Sun-like stars. "Our findings change a lot,” said Decin. "Since the complexity of stellar winds was not accounted for in the past, any previous estimate of the mass-loss rate of old stars could be wrong by up to a factor of 10."

The observations revealed many different shapes, further connecting stellar wind formation to that of planetary nebulae. "The winds we observed exhibit various shapes that are similar to planetary nebulae,” said Gottlieb. "Some are disk-like, while others are shaped like eyes, spiral structures, and even arcs."

Astronomers quickly realized that the shapes weren’t formed randomly, and that companions—low-mass stars and heavy planets—in the vicinity of the AGB stars were influencing the shapes and patterns. "Just like a spoon that you stir in a cup of coffee with some milk can create a spiral pattern, the companion sucks material towards it as it revolves around the star and shapes the stellar wind,” said Decin. "All of our observations can be explained by the fact that the stars have a companion."

In addition, the study provides a strong foundation for understanding Sun-like stars and the future of the Sun itself. "In about five billion years, the Sun will become more luminous," said Gottlieb. "Its radius will expand to a length that is comparable to the current distance between the Sun and Earth, and it will enter the AGB phase." Decin added, "Jupiter or even Saturn—because they have such a big mass—are going to influence whether the Sun spends its last millennia at the heart of a spiral, a butterfly or any of the other entrancing shapes we see in planetary nebulae today. Our current simulations predict that Jupiter and Saturn will create a weak spiral structure in the wind of the Sun once it is an AGB star."

About Center for Astrophysics | Harvard & Smithsonian

Headquartered in Cambridge, Mass., the Center for Astrophysics | Harvard & Smithsonian (CfA) is a collaboration between the Smithsonian Astrophysical Observatory and the Harvard College Observatory. CfA scientists, organized into six research divisions, study the origin, evolution and ultimate fate of the universe.

For more information, contact:

Amy Oliver
Public Affairs
Center for Astrophysics | Harvard & Smithsonian
Fred Lawrence Whipple Observatory
520-879-4406

amy.oliver@cfa.harvard.edu


Source:  Harvard-Smithsonian Center for Astrophysics (CfA)


Friday, September 18, 2020

Hubble’s Crisp New Image of Jupiter and Europa

Hubble’s Crisp New Image of Jupiter and Europa 
 
Hubble’s New Rainbow View of Jupiter
 
Hubble’s New Views of Jupiter


Videos 
 
Hubble’s New Views of Jupiter


This latest image of Jupiter, taken by the NASA/ESA Hubble Space Telescope on 25 August 2020, was captured when the planet was 653 million kilometres from Earth. Hubble’s sharp view is giving researchers an updated weather report on the monster planet’s turbulent atmosphere, including a remarkable new storm brewing, and a cousin of the Great Red Spot changing colour — again. The new image also features Jupiter’s icy moon Europa.

A unique and exciting detail of Hubble’s new snapshot appears at mid-northern latitudes as a bright, white, stretched-out storm moving at 560 kilometres per hour. This single plume erupted on 18 August 2020 and another has since appeared.

While it’s common for storms to pop up in this region, often several at once, this particular disturbance appears to have more structure behind it than observed in previous storms. Trailing behind the plume are small, counterclockwise dark clumps also not witnessed in the past. Researchers speculate this may be the beginning of a longer-lasting northern hemisphere spot, perhaps to rival the legendary Great Red Spot that dominates the southern hemisphere.

Hubble shows that the Great Red Spot, rolling counterclockwise in the planet’s southern hemisphere, is ploughing into the clouds ahead of it, forming a cascade of white and beige ribbons. The Great Red Spot is currently an exceptionally rich red colour, with its core and outermost band appearing deeper red.

Researchers say the Great Red Spot now measures about 15 800 kilometres across, big enough to swallow the Earth. The super-storm is still shrinking, as noted in telescopic observations dating back to 1930, but its rate of shrinkage appears to have slowed. The reason for its dwindling size is a complete mystery.

Researchers are noticing that another feature has changed: the Oval BA, nicknamed by astronomers as Red Spot Jr., which appears just below the Great Red Spot in this image. For the past few years, Red Spot Jr. has been fading in colour to its original shade of white after appearing red in 2006. However, now the core of this storm appears to be darkening to a reddish hue. This could hint that Red Spot Jr. is on its way to reverting to a colour more similar to that of its cousin.

Hubble’s image shows that Jupiter is clearing out its higher-altitude white clouds, especially along the planet’s equator, which is enveloped in an orangish hydrocarbon smog.

Jupiter’s icy moon Europa is visible to the left of the gas giant. Europa is already thought to harbour a liquid ocean beneath its icy crust, making this moon one of the main targets in the search for habitable worlds beyond Earth. In 2013 it was announced that the Hubble Space Telescope discovered water vapour erupting from the frigid surface of Europa, in one or more localised plumes near its south pole. ESA's JUpiter ICy moons Explorer, a mission planned for launch in 2022, aims to explore both Jupiter and three of its largest moons: Ganymede, Callisto, and Europa.

Hubble also captured a new multiwavelength observation in ultraviolet/visible/near-infrared light of Jupiter on 25 August 2020, which is giving researchers an entirely new view of the giant planet. Hubble’s near infrared imaging, combined with ultraviolet views, provides a unique panchromatic look that offers insights into the altitude and distribution of the planet’s haze and particles. This complements Hubble’s visible-light picture that shows the ever-changing cloud patterns.

Source: ESA/Hubble/News


Notes

These new Hubble images form part of yearly maps of the entire planet taken under the Outer Planets Atmospheres Legacy programme, or OPAL. The programme provides yearly Hubble global views of the outer planets to look for changes in their storms, winds, and clouds.


More Information 
 

The Hubble Space Telescope is a project of international cooperation between ESA and NASA.

Image credit: NASA, ESA, A. Simon (Goddard pace Flight Center), and M. H. Wong (University of California, Berkeley) and the OPAL team.


Links
 
Bethany Downer
ESA/Hubble, Public Information Officer
Garching, Germany
Email: Bethany.Downer@partner.eso.org