


Videos
PR Video noirlab2614a
Cosmoview Episode 109: Strange Winds Reveal Strongest Hints Yet of Magnetic Activity in Exoplanets

PR Video noirlab2614b
Cosmoview Episodio 109: Vientos extremos revelan señales de campos magnéticos en exoplanetas
in English only
PR Video noirlab2614a
Cosmoview Episode 109: Strange Winds Reveal Strongest Hints Yet of Magnetic Activity in Exoplanets
PR Video noirlab2614b
Cosmoview Episodio 109: Vientos extremos revelan señales de campos magnéticos en exoplanetas
in English only
Using the Gemini North telescope in Hawai‘i and the European Southern Observatory’s Very Large Telescope, a
team of astronomers measured wind speeds on seven very hot, Jupiter-like exoplanets. The observations revealed that the winds on these planets
are most likely governed by magnetic fields, providing the first robust measurement of magnetic activity on planets outside the Solar System.
By measuring the strength of the invisible magnetic fields of seven ultra-hot Jupiters, astronomers have taken a major step toward understanding planets beyond our Solar System. A new study published today in Nature Astronomy reveals hints that the magnetic fields of some of the hottest known exoplanets are similar in strength to those of planets in our own Solar System.
“This breakthrough opens a completely new window on exoplanet research. It’s the first time we can compare the magnetic environments of other worlds — a key step toward ultimately understanding which planets can stay alive, keep their water, and perhaps even, one day, host life as we know it,” says Julia Seidel, an astronomer at the Laboratoire Lagrange, Observatoire de la Côte d’Azur, France, and lead author of the study.
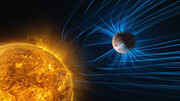
Earth's magnetic field acts as a shield: it helps stop cosmic radiation from stripping away our atmosphere, keeping the planet habitable for life. Magnetic fields are also present on other Solar System planets, like Jupiter and Saturn. However, no one succeeded in directly measuring the strength of the magnetic fields of planets outside of our Solar System — until now.
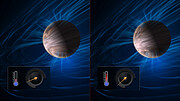
The team, however, didn’t set out to measure magnetic fields but, rather, winds. They measured wind speeds on seven exoplanets orbiting different stars: gas giants like Jupiter, but each tidally locked to its host star and very close to it. Just as we always see only one side of the Moon from Earth, these planets always keep one side facing their host star, resulting in a scorching-hot day side and a freezing-cold night side. This temperature difference creates a climate completely different from the one on our planet, with extremely strong winds. The wind speeds in their sample ranged from around 7200 kilometers (4400 miles) per hour to over 25,000 kilometers (15,500 miles) per hour; in comparison, the fastest winds measured on Jupiter reach speeds of around 1500 kilometers (900 miles) per hour.
For their measurements, the team used data from the MAROON-X instrument on the Gemini North telescope in Hawaiʻi, one half of the International Gemini Observatory, partly funded by the U.S. National Science Foundation (NSF) and operated by NSF NOIRLab. They also used data from the ESPRESSO instrument on ESO’s VLT in the Chilean Atacama Desert. These powerful, high-resolution instruments allowed the team to measure wind speeds by detecting the light signature of specific chemicals and tracing their movements through the ultra-hot Jupiters’ atmospheres.
“The stability of MAROON-X makes it a powerful tool for detecting the subtle motion of Earth-sized planets around other stars, as well as tracing changes in the atmospheres of exoplanets depending on orbital phase,” says Andreas Seifahrt, Associate Director of Development for Gemini Observatory and study co-author. “The unexpected discovery that resulted from studying the winds of these seven ultra-hot Jupiters shows that there is even more that we can learn from the data. MAROON-X provides a world-class capability for these studies.”
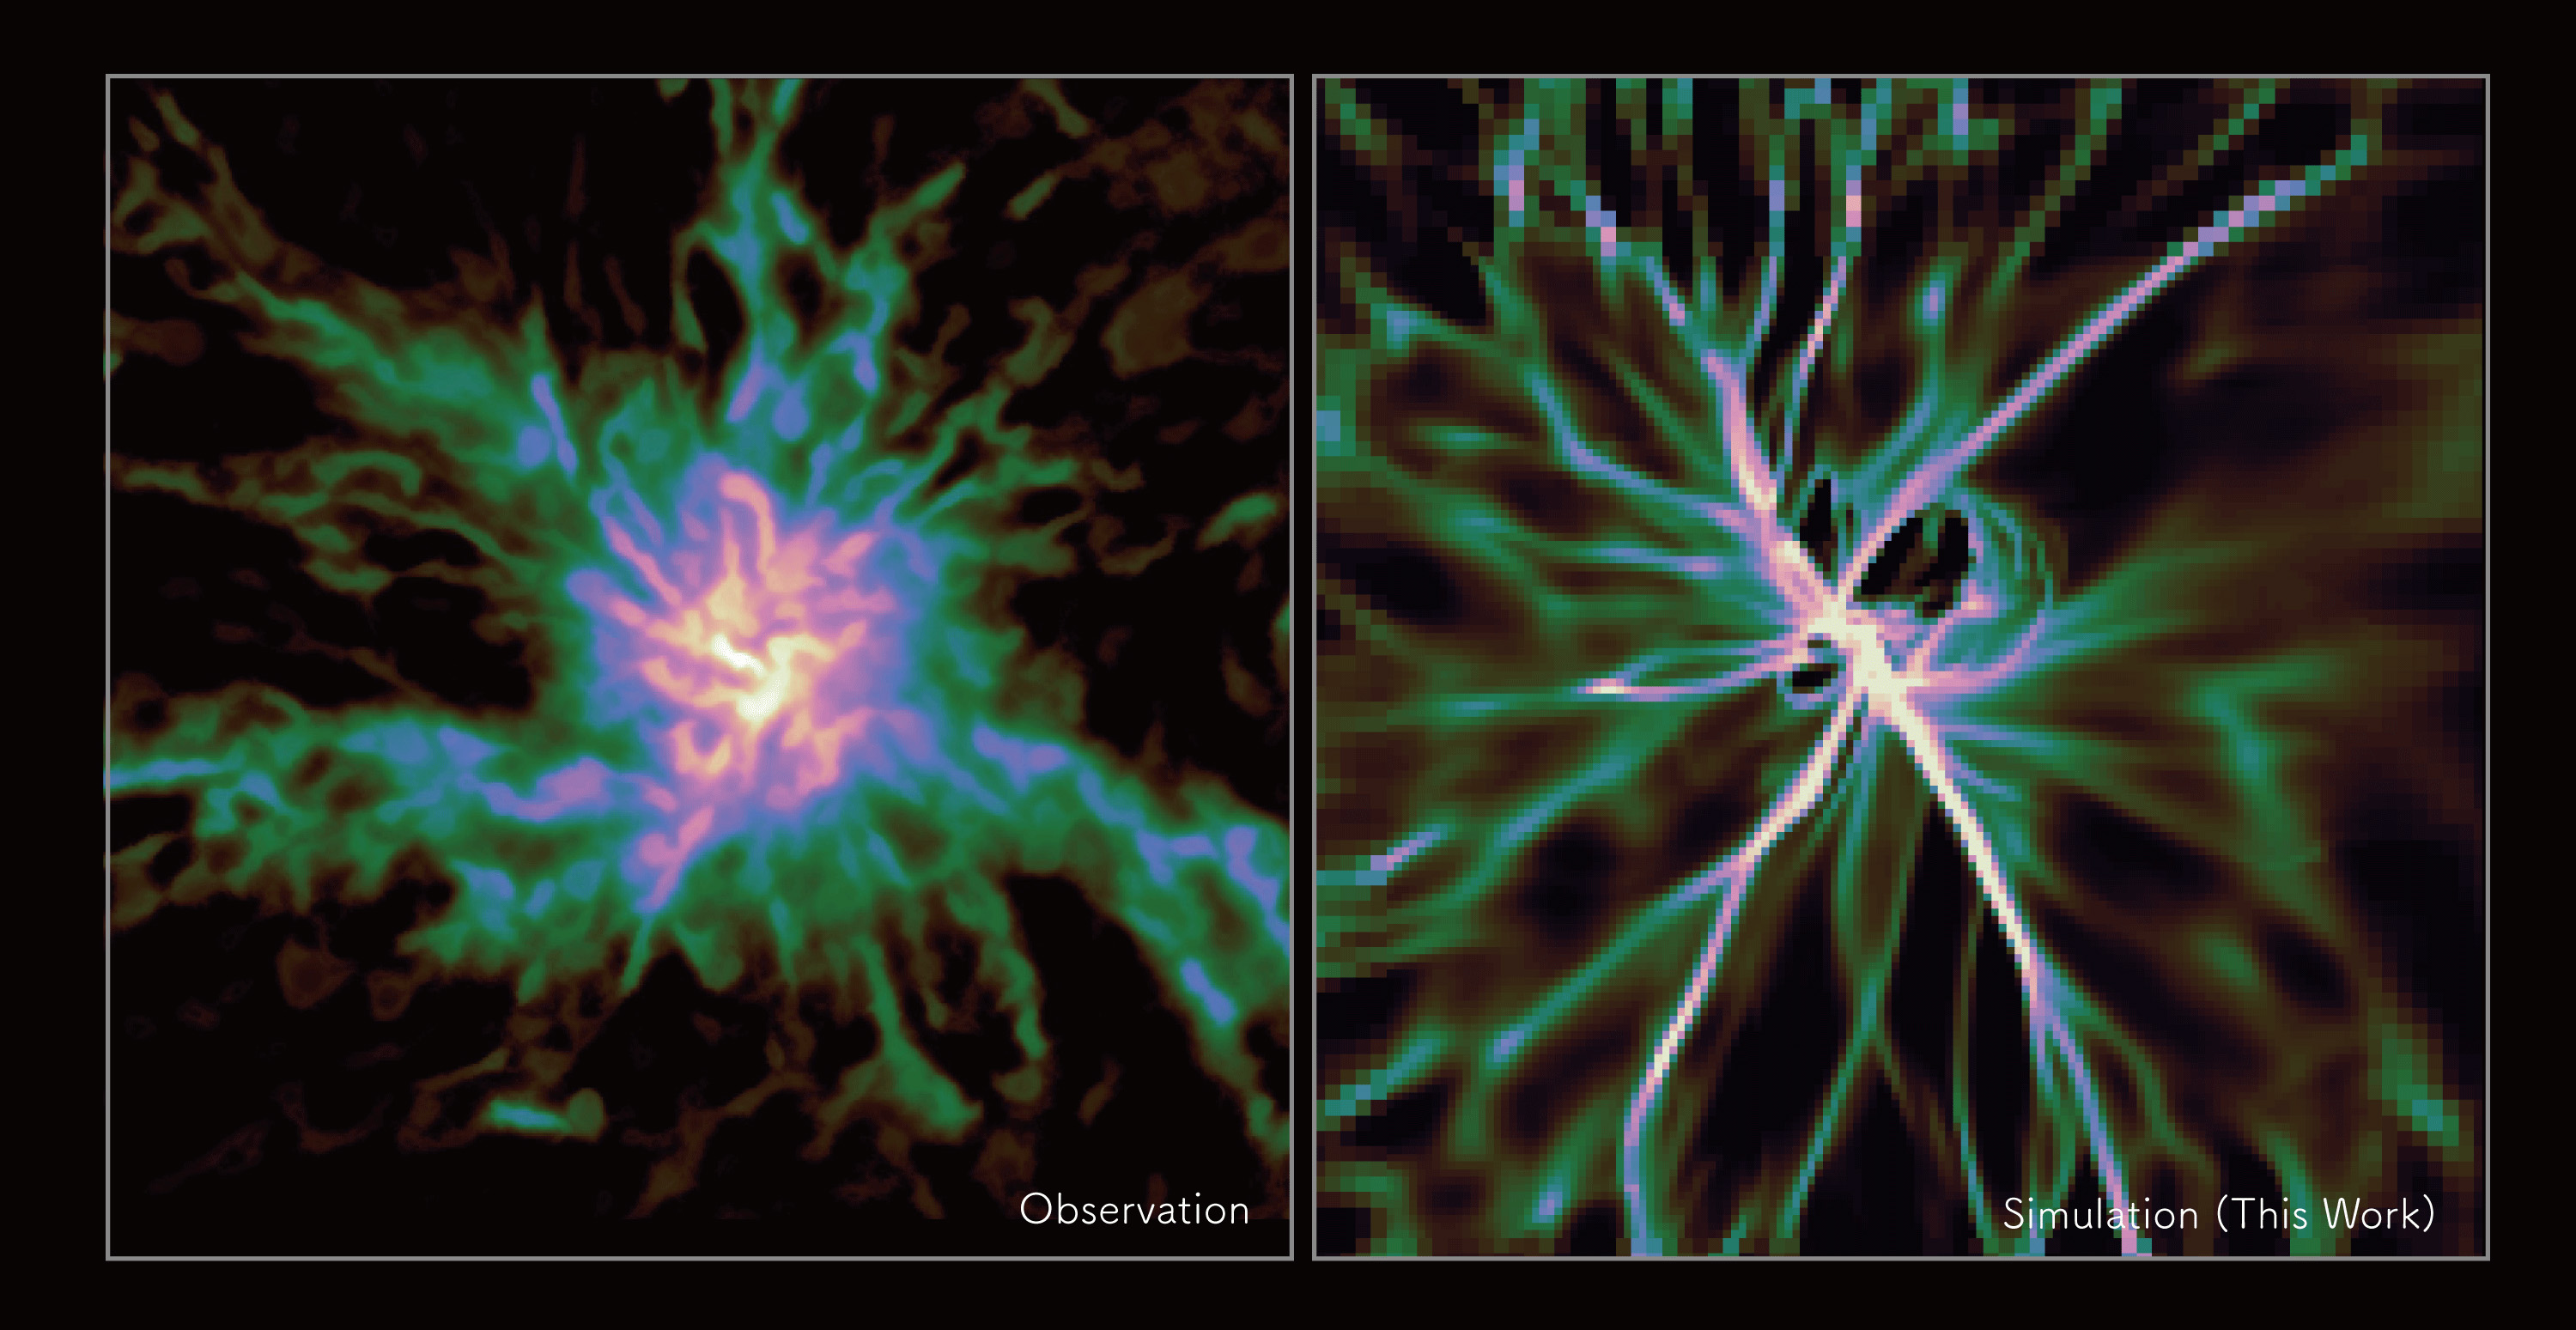
When the researchers looked at how wind speeds varied with the planet’s temperature, they saw a very intriguing pattern emerge: the hotter the planet, the slower the wind. “This is totally counterintuitive because, all things being equal, hot planets have more energy to accelerate the winds! Something must happen that slows down the wind speeds for hotter objects,” says study co-author Vivien Parmentier, a professor at the Laboratoire Lagrange.
The team concluded that the most consistent explanation for this mystery is the presence of planet-wide magnetic fields, since these fields can work as a brake, slowing down the motion of charged particles in the atmosphere. The data, therefore, allowed the researchers to infer the strength of the magnetic field of each of the studied planets. They found them to be comparable in strength to those found in our Solar System: approximately four times as strong as Saturn’s magnetic field or about half the strength of Jupiter’s.
Such strong magnetic fields could affect more than just the wind on these distant planets. “Here on Earth, we know the beauty of the northern and southern lights, where particles from the Sun hit our magnetic field and are guided toward the poles, colliding with gases in the atmosphere to produce colourful displays of green, pink, and purple,” explains study co-author Bibiana Prinoth, a former PhD student at Lund University, Sweden, now an astronomer at ESO in Garching, Germany. On the studied exoplanets, the magnetically driven aurorae could be even more dramatic.
By measuring the strength of the invisible magnetic fields of seven ultra-hot Jupiters, astronomers have taken a major step toward understanding planets beyond our Solar System. A new study published today in Nature Astronomy reveals hints that the magnetic fields of some of the hottest known exoplanets are similar in strength to those of planets in our own Solar System.
“This breakthrough opens a completely new window on exoplanet research. It’s the first time we can compare the magnetic environments of other worlds — a key step toward ultimately understanding which planets can stay alive, keep their water, and perhaps even, one day, host life as we know it,” says Julia Seidel, an astronomer at the Laboratoire Lagrange, Observatoire de la Côte d’Azur, France, and lead author of the study.
Earth's magnetic field acts as a shield: it helps stop cosmic radiation from stripping away our atmosphere, keeping the planet habitable for life. Magnetic fields are also present on other Solar System planets, like Jupiter and Saturn. However, no one succeeded in directly measuring the strength of the magnetic fields of planets outside of our Solar System — until now.
The team, however, didn’t set out to measure magnetic fields but, rather, winds. They measured wind speeds on seven exoplanets orbiting different stars: gas giants like Jupiter, but each tidally locked to its host star and very close to it. Just as we always see only one side of the Moon from Earth, these planets always keep one side facing their host star, resulting in a scorching-hot day side and a freezing-cold night side. This temperature difference creates a climate completely different from the one on our planet, with extremely strong winds. The wind speeds in their sample ranged from around 7200 kilometers (4400 miles) per hour to over 25,000 kilometers (15,500 miles) per hour; in comparison, the fastest winds measured on Jupiter reach speeds of around 1500 kilometers (900 miles) per hour.
For their measurements, the team used data from the MAROON-X instrument on the Gemini North telescope in Hawaiʻi, one half of the International Gemini Observatory, partly funded by the U.S. National Science Foundation (NSF) and operated by NSF NOIRLab. They also used data from the ESPRESSO instrument on ESO’s VLT in the Chilean Atacama Desert. These powerful, high-resolution instruments allowed the team to measure wind speeds by detecting the light signature of specific chemicals and tracing their movements through the ultra-hot Jupiters’ atmospheres.
“The stability of MAROON-X makes it a powerful tool for detecting the subtle motion of Earth-sized planets around other stars, as well as tracing changes in the atmospheres of exoplanets depending on orbital phase,” says Andreas Seifahrt, Associate Director of Development for Gemini Observatory and study co-author. “The unexpected discovery that resulted from studying the winds of these seven ultra-hot Jupiters shows that there is even more that we can learn from the data. MAROON-X provides a world-class capability for these studies.”
When the researchers looked at how wind speeds varied with the planet’s temperature, they saw a very intriguing pattern emerge: the hotter the planet, the slower the wind. “This is totally counterintuitive because, all things being equal, hot planets have more energy to accelerate the winds! Something must happen that slows down the wind speeds for hotter objects,” says study co-author Vivien Parmentier, a professor at the Laboratoire Lagrange.
The team concluded that the most consistent explanation for this mystery is the presence of planet-wide magnetic fields, since these fields can work as a brake, slowing down the motion of charged particles in the atmosphere. The data, therefore, allowed the researchers to infer the strength of the magnetic field of each of the studied planets. They found them to be comparable in strength to those found in our Solar System: approximately four times as strong as Saturn’s magnetic field or about half the strength of Jupiter’s.
Such strong magnetic fields could affect more than just the wind on these distant planets. “Here on Earth, we know the beauty of the northern and southern lights, where particles from the Sun hit our magnetic field and are guided toward the poles, colliding with gases in the atmosphere to produce colourful displays of green, pink, and purple,” explains study co-author Bibiana Prinoth, a former PhD student at Lund University, Sweden, now an astronomer at ESO in Garching, Germany. On the studied exoplanets, the magnetically driven aurorae could be even more dramatic.
More information
This research was presented in a paper titled “Magnetic field strengths of hot giant exoplanets consistent with
Solar System values” to appear in Nature Astronomy. DOI: 10.1038/s41550-026-02870-1
The team is composed of J. V. Seidel (European Southern Observatory, Chile; Université Côte d’Azur, France), V. Parmentier (Université Côte d’Azur, France), B. Prinoth (Lund University, Sweden; European Southern Observatory, Germany), et al.
NSF NOIRLab, the U.S. National Science Foundation center for ground-based optical-infrared astronomy, operates the International Gemini Observatory (a facility of NSF, NRC–Canada, ANID–Chile, MCTIC–Brazil, MINCyT–Argentina, and KASI–Republic of Korea), NSF Kitt Peak National Observatory (KPNO), NSF Cerro Tololo Inter-American Observatory (CTIO), the Community Science and Data Center (CSDC), and NSF–DOE Vera C. Rubin Observatory (in cooperation with DOE’s SLAC National Accelerator Laboratory). It is managed by the Association of Universities for Research in Astronomy (AURA) under a cooperative agreement with NSF and is headquartered in Tucson, Arizona.
The scientific community is honored to have the opportunity to conduct astronomical research on I’oligam Du’ag (Kitt Peak) in Arizona, on Maunakea in Hawai‘i, and on Cerro Tololo and Cerro Pachón in Chile. We recognize and acknowledge the very significant cultural role and reverence of I’oligam Du’ag to the Tohono O’odham Nation, and Maunakea to the Kanaka Maoli (Native Hawaiians) community.
The European Southern Observatory (ESO) enables scientists worldwide to discover the secrets of the Universe for the benefit of all. We design, build and operate world-class observatories on the ground — which astronomers use to tackle exciting questions and spread the fascination of astronomy — and promote international collaboration for astronomy. Established as an intergovernmental organisation in 1962, today ESO is supported by 16 Member States (Austria, Belgium, Czechia, Denmark, France, Finland, Germany, Ireland, Italy, the Netherlands, Poland, Portugal, Spain, Sweden, Switzerland and the United Kingdom), along with the host state of Chile and with Australia as a Strategic Partner. ESO’s headquarters and its visitor centre and planetarium, the ESO Supernova, are located close to Munich in Germany, while the Chilean Atacama Desert, a marvellous place with unique conditions to observe the sky, hosts our telescopes. ESO operates three observing sites: La Silla, Paranal and Chajnantor. At Paranal, ESO operates the Very Large Telescope and its Very Large Telescope Interferometer, as well as survey telescopes such as VISTA. Also at Paranal, ESO will host and operate the south array of the Cherenkov Telescope Array Observatory, the world’s largest and most sensitive gamma-ray observatory. Together with international partners, ESO operates ALMA on Chajnantor, a facility that observes the skies in the millimetre and submillimetre range. At Cerro Armazones, near Paranal, we are building “the world’s biggest eye on the sky” — ESO’s Extremely Large Telescope. From our offices in Santiago, Chile we support our operations in the country and engage with Chilean partners and society.
Links
- Read the paper: Magnetic field strengths of hot giant exoplanets consistent with Solar System values
- ESO press release
- Photos of the Gemini North telescope
- Videos of the Gemini North telescope
- Check out other NOIRLab Science Releases
- For journalists: subscribe to receive our releases under embargo
- For scientists: got a story? Pitch your research
Contacts:
Julia Victoria Seidel
Lagrange Laboratory, Observatoire de la Côte d'Azur
Nice, France
Tel: +33 743 32 79 73
Email: jseidel@oca.eu
Josie Fenske
Public Information Officer
NSF NOIRLab
Email: josie.fenske@noirlab.edu


