Sunday, March 21, 2021

LCO Scientists Use Supernovae to Make a New Measurement of the Hubble Constant


SN 2011fe in the galaxy M101 is a Type Ia supernova, the type used as standard candles in this study.  This composite image was created from data taken by Las Cumbres Observatory and the Palomar Transient Factory.  Credit: BJ Fulton / LCO / PTF.

One of the longest standing and most controversial questions in astronomy is — how fast is the universe expanding today? New work, including measurements made by Las Cumbres Observatory, has applied new techniques to the problem and found a surprising answer.

Astronomers call the local expansion rate of the universe the Hubble constant, H0, (pronounced H-naught). Measurements have gotten extremely precise in recent years — some claim to have measured it to better than a few percent. Different groups have come up with results that vary by more than 10% — far larger than the claimed uncertainty. Complicating matters, the measurements seem to cluster high or low depending on where they are made in the universe. The Hubble constant measured from nearby supernovae tends to be high, while measurements built up from the afterglow of the Big Bang — the Cosmic Microwave Background — give a low value. Some have argued that this is a crisis for the field, one requiring “new physics.” Perhaps an unknown property of Dark Energy is causing the local expansion rate of the universe to be highly sensitive to the distance at which it is measured. Others argue that there must be some kind of mistake in building the “distance ladder” — in using one set of distance indicators to calibrate another.

The new study, released March 12 in the journal Astronomy & Astrophysics, involves an international team of scientists led by Nandita Khetan, a PhD student at the Gran Sasso Science Institute in Italy, and an associate researcher at the Istituto Nazionale di Fisica Nucleare. It used the Surface Brightness Fluctuations of galaxies to calibrate the distances to nature’s best distance indicators — Type Ia supernovae. Type Ia supernovae are used as “standard candles” to map out distances in the universe. They were used to determine that the universe was accelerating in its expansion, leading to the discovery of Dark Energy that resulted in the 2011 Nobel Prize in Physics.

The standard candle method relies on measuring the apparent brightness of a distant known light, say a 100W light bulb, and using the difference between the apparent and intrinsic brightness to work out how far away the light is. This requires knowing the intrinsic power output —the wattage — of the “standard candle,” something that is unknown for Type Ia supernovae. Astronomers have to calibrate their brightness using a handful of nearby supernovae in galaxies with distances determined by other means. Traditionally this has been done with galaxies whose distances are known from observations of Cepheid variable stars. The new paper research swaps out the Cepheids for a different fundamental calibrator, Surface Brightness Fluctuations. This measures the resolution of individual stars in different galaxies, since stars tend to blur together the farther away a galaxy is. It is similar to how a street will appear rough when photographed up close, but smooth when seen from farther away.

The new study found an answer that is in between the two discordant values of the expansion rate of the universe. This argues that perhaps new physics isn’t needed after all. It may be that previous researchers overestimated the precision of their studies.

Andy Howell, a staff scientist at Las Cumbres Observatory, and adjunct faculty at the University of California Santa Barbara, is the Principal Investigator of the Global Supernova Project, a worldwide collaboration that provided some of the observations of supernovae used in the study. He explains, “At a recent conference about this Hubble Constant crisis, after each speaker walked through their methodology, I couldn’t find any problems with what they were doing. I started to question whether we do need new physics to explain the different Hubble constants. But now we, like several studies before ours, found an answer in the middle. Maybe there’s some weirdness to some of the other measurements that we don’t fully understand. That’s more comforting, because you don’t want to upend our understanding of physics unless you have to.”

The new work does not undermine the discovery or characterization of Dark Energy, since that relies on only relative, not absolute, measurements of supernovae and has been verified by other means.

The new supernova observations were obtained with Las Cumbres Observatory’s worldwide network of robotic telescopes, specifically designed to study time-variable phenomena like supernovae. Howell adds, “Supernovae are hard to observe, because you need just a little bit of telescope time per night, over months. But a robotic telescope network is perfect for this — nobody has to travel — the telescopes can make the observations wherever and whenever they are needed. This is what we built Las Cumbres Observatory for and I’m delighted to see it being used to refine our understanding of the universe.”

The study “A new measurement of the Hubble constant using Type Ia supernovae calibrated with surface brightness fluctuations” involves an international team of scientists with expertise in supernova observations, Surface Brightness Fluctuations, and theory working, at the Gran Sasso Science Institute, INAF, INFN, DARK-Niels Bohr Institute, University of Copenhagen, Centre for Astrophysics and Supercomputing, Swinburne University, Las Cumbres Observatory, UC Santa Barbara, and UC Davis.

Source:  Las Cumbres Observatory (LCO)/News


Saturday, March 20, 2021

Hubble Shows Torrential Outflows from Infant Stars May Not Stop Them from Growing View All News Releases

Infant Stars in Orion

These four images taken by NASA's Hubble Space Telescope reveal the chaotic birth of stars in the Orion complex, the nearest major star-forming region to Earth.

The snapshots show fledgling stars buried in dusty gaseous cocoons announcing their births by unleashing powerful winds and pairs of spinning, lawn-sprinkler-style jets shooting off in opposite directions. Near-infrared light pierces the dusty region to unveil details of the birthing process.

The stellar outflows are carving out cavities within the hydrogen gas cloud. This relatively brief birthing stage lasts about 500,000 years.

Although the stars themselves are shrouded in dust, they emit powerful radiation, which strikes the cavity walls and scatters off dust grains, illuminating in infrared light the gaps in the gaseous envelopes. Astronomers found that the cavities in the surrounding gas cloud sculpted by a forming star's outflow did not grow regularly as they matured, as theories propose.

The young stars in these images are just a subset of an ambitious study of 304 developing stars, the largest-ever to date. Researchers used data previously collected from NASA's Hubble and Spitzer space telescopes and the European Space Agency's Herschel Space Telescope.

The protostars were photographed in near-infrared light by Hubble's Wide Field Camera 3. The images were taken Nov. 14, 2009, and Jan. 25, Feb. 11, and Aug. 11, 2010. Credits:
NASA, ESA, STScI, N. Habel and S. T. Megeath (University of Toledo)

Though our galaxy is an immense city of at least 200 billion stars, the details of how they formed remain largely cloaked in mystery.

Scientists know that stars form from the collapse of huge hydrogen clouds that are squeezed under gravity to the point where nuclear fusion ignites. But only about 30 percent of the cloud's initial mass winds up as a newborn star. Where does the rest of the hydrogen go during such a terribly inefficient process?

It has been assumed that a newly forming star blows off a lot of hot gas through light-saber-shaped outflowing jets and hurricane-like winds launched from the encircling disk by powerful magnetic fields. These fireworks should squelch further growth of the central star. But a new, comprehensive Hubble survey shows that this most common explanation doesn't seem to work, leaving astronomers puzzled.

Researchers used data previously collected from NASA's Hubble and Spitzer space telescopes and the European Space Agency's Herschel Space Telescope to analyze 304 developing stars, called protostars, in the Orion Complex, the nearest major star-forming region to Earth. (Spitzer and Herschel are no longer operational.)

In this largest-ever survey of nascent stars to date, researchers are finding that gas — clearing by a star's outflow may not be as important in determining its final mass as conventional theories suggest. The researchers' goal was to determine whether stellar outflows halt the infall of gas onto a star and stop it from growing.

Instead, they found that the cavities in the surrounding gas cloud sculpted by a forming star's outflow did not grow regularly as they matured, as theories propose.

"In one stellar formation model, if you start out with a small cavity, as the protostar rapidly becomes more evolved, its outflow creates an ever-larger cavity until the surrounding gas is eventually blown away, leaving an isolated star," explained lead researcher Nolan Habel of the University of Toledo in Ohio.

"Our observations indicate there is no progressive growth that we can find, so the cavities are not growing until they push out all of the mass in the cloud. So, there must be some other process going on that gets rid of the gas that doesn't end up in the star."

The team's results will appear in an upcoming issue of  The Astrophysical Journal.

A Star is Born

During a star's relatively brief birthing stage, lasting only about 500,000 years, the star quickly bulks up on mass. What gets messy is that, as the star grows, it launches a wind, as well as a pair of spinning, lawn-sprinkler-style jets shooting off in opposite directions. These outflows begin to eat away at the surrounding cloud, creating cavities in the gas.

Popular theories predict that as the young star evolves and the outflows continue, the cavities grow wider until the entire gas cloud around the star is completely pushed away. With its gas tank empty, the star stops accreting mass – in other words, it stops growing.

To look for cavity growth, the researchers first sorted the protostars by age by analyzing Herschel and Spitzer data of each star's light output. The protostars in the Hubble observations were also observed as part of the Herschel telescope's Herschel Orion Protostar Survey.

Then the astronomers observed the cavities in near-infrared light with Hubble's Near-infrared Camera and Multi-object Spectrometer and Wide Field Camera 3. The observations were taken between 2008 and 2017. Although the stars themselves are shrouded in dust, they emit powerful radiation which strikes the cavity walls and scatters off dust grains, illuminating the gaps in the gaseous envelopes in infrared light.

The Hubble images reveal the details of the cavities produced by protostars at various stages of evolution. Habel's team used the images to measure the structures' shapes and estimate the volumes of gas cleared out to form the cavities. From this analysis, they could estimate the amount of mass that had been cleared out by the stars' outbursts.

"We find that at the end of the protostellar phase, where most of the gas has fallen from the surrounding cloud onto the star, a number of young stars still have fairly narrow cavities," said team member Tom Megeath of the University of Toledo. "So, this picture that is still commonly held of what determines the mass of a star and what halts the infall of gas is that this growing outflow cavity scoops up all of the gas. This has been pretty fundamental to our idea of how star formation proceeds, but it just doesn't seem to fit the data here."

Future telescopes such as NASA's upcoming James Webb Space Telescope will probe deeper into a protostar's formation process. Webb spectroscopic observations will observe the inner regions of disks surrounding protostars in infrared light, looking for jets in the youngest sources. Webb also will help astronomers measure the accretion rate of material from the disk onto the star, and study how the inner disk is interacting with the outflow.

Contact:

Media Contacts:

Donna Weaver / Ray Villard
Space Telescope Science Institute, Baltimore
Maryland 410-338-4493 / 410-338-4514
dweaver@stsci.edu / villard@stsci.edu

Christine Billau
University of Toledo, Toledo, Ohio
419-530-2077

christine.billau@utoledo.edu

Science Contacts:

Nolan Habel / Tom Megeath
University of Toledo, Toledo, Ohio

nolan.habel@rockets.utoledo.edu / s.megeath@utoledo.edu

Related Links:

The science paper by N. Habel et al
NASA's Hubble Portal
University of Toledo's Release


Friday, March 19, 2021

Powerful stratospheric winds measured on Jupiter for the first time

Representation of stratospheric winds near Jupiter’s south pole
 
Comet Shoemaker–Levy 9 impacting Jupiter in 1994
 
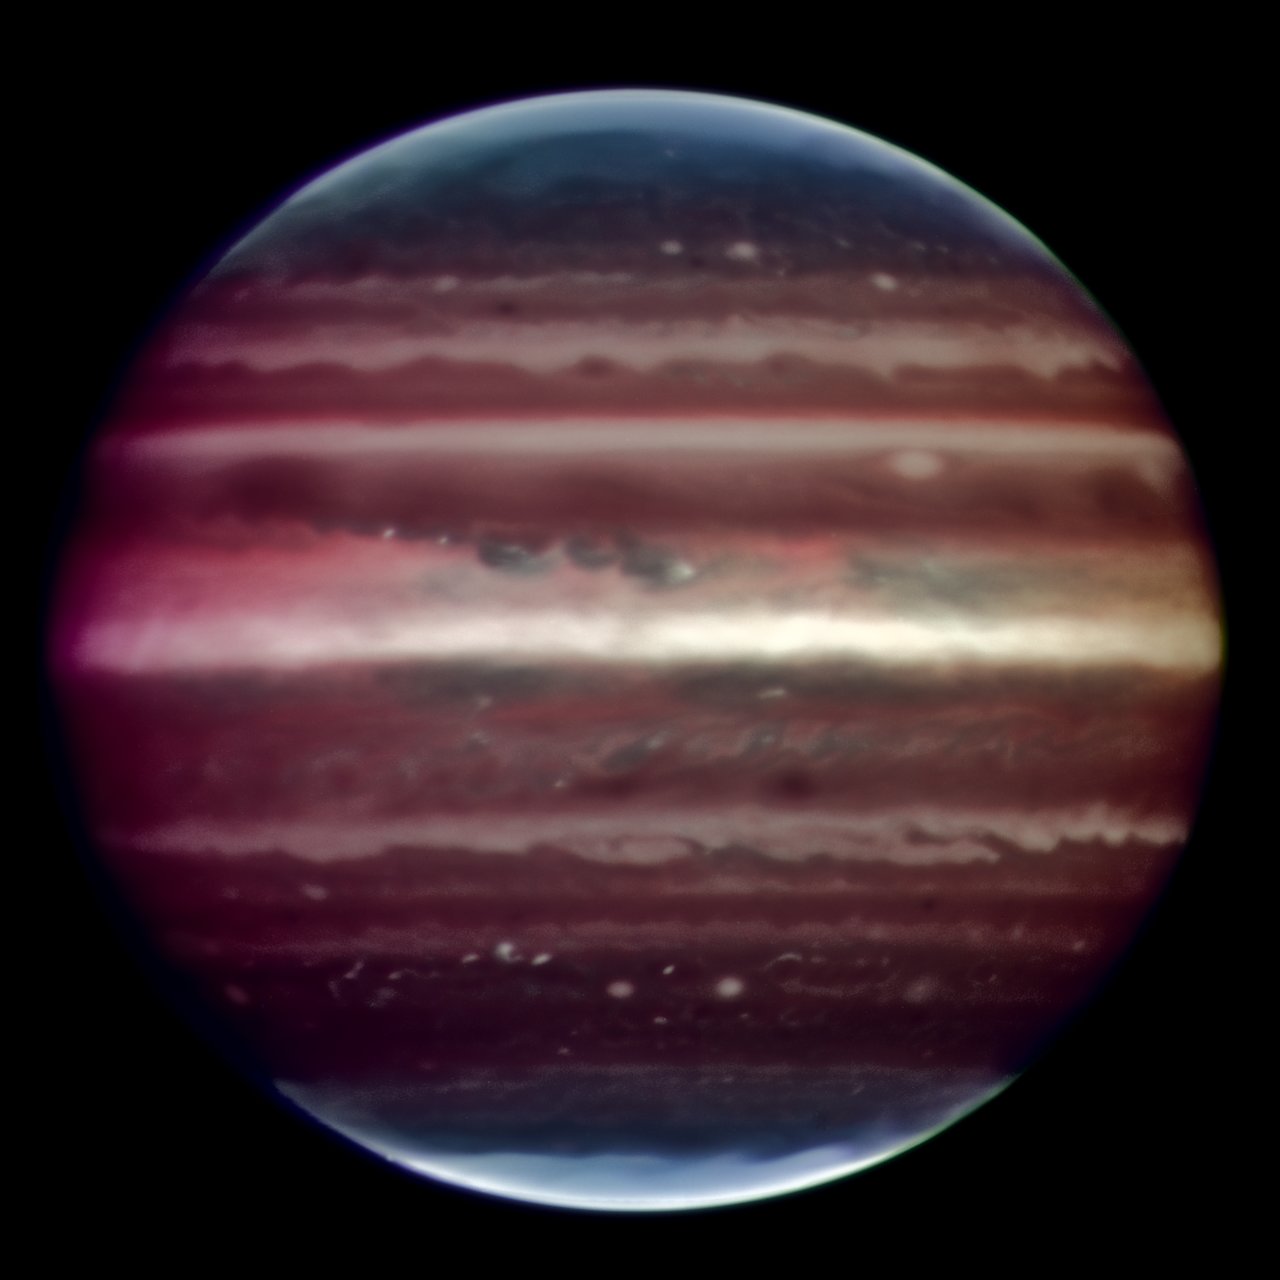
Sharpening up Jupiter


Videos

Powerful stratospheric winds near Jupiter’s south pole (animation)
Powerful stratospheric winds near Jupiter’s south pole (animation) 
 
Animated view of Jupiter showing comet Shoemaker–Levy 9 impact sites


Using the Atacama Large Millimeter/submillimeter Array (ALMA), in which the European Southern Observatory (ESO) is a partner, a team of astronomers have directly measured winds in Jupiter’s middle atmosphere for the first time. By analysing the aftermath of a comet collision from the 1990s, the researchers have revealed incredibly powerful winds, with speeds of up to 1450 kilometres an hour, near Jupiter’s poles. They could represent what the team have described as a “unique meteorological beast in our Solar System”.

Jupiter is famous for its distinctive red and white bands: swirling clouds of moving gas that astronomers traditionally use to track winds in Jupiter’s lower atmosphere. Astronomers have also seen, near Jupiter's poles, the vivid glows known as aurorae, which appear to be associated with strong winds in the planet’s upper atmosphere. But until now, researchers had never been able to directly measure wind patterns in between these two atmospheric layers, in the stratosphere.

Measuring wind speeds in Jupiter’s stratosphere using cloud-tracking techniques is impossible because of the absence of clouds in this part of the atmosphere. However, astronomers were provided with an alternative measuring aid in the form of comet Shoemaker–Levy 9, which collided with the gas giant in spectacular fashion in 1994. This impact produced new molecules in Jupiter’s stratosphere, where they have been moving with the winds ever since. 

A team of astronomers, led by Thibault Cavalié of the Laboratoire d'Astrophysique de Bordeaux in France, have now tracked one of these molecules — hydrogen cyanide — to directly measure stratospheric "jets" on Jupiter. Scientists use the word "jets" to refer to narrow bands of wind in the atmosphere, like Earth’s jet streams.

"The most spectacular result is the presence of strong jets, with speeds of up to 400 metres per second, which are located under the aurorae near the poles," says Cavalié. These wind speeds, equivalent to about 1450 kilometres an hour, are more than twice the maximum storm speeds reached in Jupiter’s Great Red Spot and over three times the wind speed measured on Earth’s strongest tornadoes.

"Our detection indicates that these jets could behave like a giant vortex with a diameter of up to four times that of Earth, and some 900 kilometres in height," explains co-author Bilal Benmahi, also of the Laboratoire d’Astrophysique de Bordeaux. "A vortex of this size would be a unique meteorological beast in our Solar System," Cavalié adds.

Astronomers were aware of strong winds near Jupiter’s poles, but much higher up in the atmosphere, hundreds of kilometres above the focus area of the new study, which is published today in Astronomy & Astrophysics. Previous studies predicted that these upper-atmosphere winds would decrease in velocity and disappear well before reaching as deep as the stratosphere. "The new ALMA data tell us the contrary," says Cavalié, adding that finding these strong stratospheric winds near Jupiter’s poles was a "real surprise".

The team used 42 of ALMA’s 66 high-precision antennas, located in the Atacama Desert in northern Chile, to analyse the hydrogen cyanide molecules that have been moving around in Jupiter’s stratosphere since the impact of Shoemaker–Levy 9. The ALMA data allowed them to measure the Doppler shift — tiny changes in the frequency of the radiation emitted by the molecules — caused by the winds in this region of the planet. "By measuring this shift, we were able to deduce the speed of the winds much like one could deduce the speed of a passing train by the change in the frequency of the train whistle," explains study co-author Vincent Hue, a planetary scientist at the Southwest Research Institute in the US.

In addition to the surprising polar winds, the team also used ALMA to confirm the existence of strong stratospheric winds around the planet’s equator, by directly measuring their speed, also for the first time. The jets spotted in this part of the planet have average speeds of about 600 kilometres an hour.

The ALMA observations required to track stratospheric winds in both the poles and equator of Jupiter took less than 30 minutes of telescope time. "The high levels of detail we achieved in this short time really demonstrate the power of the ALMA observations," says Thomas Greathouse, a scientist at the Southwest Research Institute in the US and co-author of the study. "It is astounding to me to see the first direct measurement of these winds."

"These ALMA results open a new window for the study of Jupiter’s auroral regions, which was really unexpected just a few months back," says Cavalié. "They also set the stage for similar yet more extensive measurements to be made by the JUICE mission and its Submillimetre Wave Instrument," Greathouse adds, referring to the European Space Agency’s JUpiter ICy moons Explorer, which is expected to launch into space next year.

ESO’s ground-based Extremely Large Telescope (ELT), set to see first light later this decade, will also explore Jupiter. The telescope will be capable of making highly detailed observations of the planet’s aurorae, giving us further insight into Jupiter’s atmosphere.


More Information

This research is presented in the paper "First direct measurement of auroral and equatorial jets in the stratosphere of Jupiter" published today in Astronomy & Astrophysics (doi:10.1051/0004-6361/202140330).

The team is composed of T. Cavalié (Laboratoire d’Astrophysique de Bordeaux [LAB], France, and LESIA, Observatoire de Paris, PSL Research University [LESIA], France), B. Benmahi (LAB), V. Hue (Southwest Research Institute [SwRI], USA), R. Moreno (LESIA), E. Lellouch (LESIA), T. Fouchet (LESIA), P. Hartogh (Max-Planck-Institut für Sonnensystemforschung [MPS], Germany), L. Rezac (MPS), T. K. Greathouse (SwRI), G. R. Gladstone (SwRI), J. A. Sinclair (Jet Propulsion Laboratory, California Institute of Technology, USA), M. Dobrijevic (LAB), F. Billebaud (LAB) and C. Jarchow (MPS).

ESO is the foremost intergovernmental astronomy organisation in Europe and the world’s most productive ground-based astronomical observatory by far. It has 16 Member States: Austria, Belgium, the Czech Republic, Denmark, France, Finland, Germany, Ireland, Italy, the Netherlands, Poland, Portugal, Spain, Sweden, Switzerland and the United Kingdom, along with the host state of Chile and with Australia as a Strategic Partner. ESO carries out an ambitious programme focused on the design, construction and operation of powerful ground-based observing facilities enabling astronomers to make important scientific discoveries. ESO also plays a leading role in promoting and organising cooperation in astronomical research. ESO operates three unique world-class observing sites in Chile: La Silla, Paranal and Chajnantor. At Paranal, ESO operates the Very Large Telescope and its world-leading Very Large Telescope Interferometer as well as two survey telescopes, VISTA working in the infrared and the visible-light VLT Survey Telescope. Also at Paranal ESO will host and operate the Cherenkov Telescope Array South, the world’s largest and most sensitive gamma-ray observatory. ESO is also a major partner in two facilities on Chajnantor, APEX and ALMA, the largest astronomical project in existence. And on Cerro Armazones, close to Paranal, ESO is building the 39-metre Extremely Large Telescope, the ELT, which will become “the world’s biggest eye on the sky”.

The Atacama Large Millimeter/submillimeter Array (ALMA), an international astronomy facility, is a partnership of ESO, the U.S. National Science Foundation (NSF) and the National Institutes of Natural Sciences (NINS) of Japan in cooperation with the Republic of Chile. ALMA is funded by ESO on behalf of its Member States, by NSF in cooperation with the National Research Council of Canada (NRC) and the Ministry of Science and Technology (MOST) and by NINS in cooperation with the Academia Sinica (AS) in Taiwan and the Korea Astronomy and Space Science Institute (KASI). ALMA construction and operations are led by ESO on behalf of its Member States; by the National Radio Astronomy Observatory (NRAO), managed by Associated Universities, Inc. (AUI), on behalf of North America; and by the National Astronomical Observatory of Japan (NAOJ) on behalf of East Asia. The Joint ALMA Observatory (JAO) provides the unified leadership and management of the construction, commissioning and operation of ALMA.


Links

Thibault Cavalié
Laboratoire d'Astrophysique de Bordeaux
Bordeaux, France
Tel: +33 (0)5 40 00 32 71
Email:
thibault.cavalie@u-bordeaux.fr

Bilal Benmahi
Laboratoire d'Astrophysique de Bordeaux
Bordeaux, France
Tel: +33 (0)5 40 00 32 76
Email:
bilal.benmahi@u-bordeaux.fr

Vincent Hue
Southwest Research Institute
San Antonio, TX, USA
Tel: +1 (210) 522-5027
Email:
vhue@swri.org

Thomas Greathouse
Southwest Research Institute
San Antonio, TX, USA
Tel: +1 (210) 522-2809
Email:
tgreathouse@swri.edu

Suzanna Randall (astronomer who did not participate in the study; contact for external comment and questions on ALMA)
European Southern Observatory
Garching bei München, Germany
Email:
srandall@eso.org

Bárbara Ferreira
ESO Media Manager
Garching bei München, Germany
Tel: +49 89 3200 6670
Cell: +49 151 241 664 00
Email:
press@eso.org

 Source: ESO/News


Peering into a Galaxy's Dusty Core to Study an Active Supermassive Black Hole

Centaurus A sports a warped central disk of gas and dust, which is evidence of a past collision and merger with another galaxy. It also has an active galactic nucleus that periodically emits jets. It is the fifth brightest galaxy in the sky and only about 13 million light-years away from Earth, making it an ideal target to study an active galactic nucleus – a supermassive black hole emitting jets and winds – with NASA's upcoming James Webb Space Telescope. Credits: X-ray: NASA / CXC/SAO; Optical: Rolf Olsen; Infrared: NASA  / CXC/SAO; Optical: Rolf Olsen; Infrared: NASA

Release images / Release Videos

Centaurus A is a giant of a galaxy, but its appearances in telescope observations can be deceiving. Dark dust lanes and young blue star clusters, which crisscross its central region, are apparent in ultraviolet, visible, and near-infrared light, painting a fairly subdued landscape. But by switching to X-ray and radio light views, a far more raucous scene begins to unfold: From the core of the misshapen elliptical galaxy, spectacular jets of material have erupted from its active supermassive black hole – known as an active galactic nucleus – sending material into space well beyond the galaxy's limits.

What, precisely, is happening at its core to cause all this activity? Upcoming observations led by Nora Lützgendorf and Macarena García Marín of the European Space Agency using NASA's James Webb Space Telescope will allow researchers to peer through its dusty core in high resolution for the first time to begin to answer these questions.

"There's so much going on in Centaurus A," explains Lützgendorf. "The galaxy's gas, disk, and stars all move under the influence of its central supermassive black hole. Since the galaxy is so close to us, we'll be able to use Webb to create two-dimensional maps to see how the gas and stars move in its central region, how they are influenced by the jets from its active galactic nucleus, and ultimately better characterize the mass of its black hole."

A Quick Look Back

Let's hit "rewind" to review a bit of what is already known about Centaurus A. It's well studied because it's relatively nearby – about 13 million light-years away – which means we can clearly resolve the full galaxy. The first record of it was logged in the mid-1800s, but astronomers lost interest until the 1950s because the galaxy appeared to be a quiet, if misshapen, elliptical galaxy. Once researchers were able to begin observing with radio telescopes in the 1940s and '50s, Centaurus A became radically more interesting – and its jets came into view. In 1954, researchers found that Centaurus A is the result of two galaxies that merged, which was later estimated to have occurred 100 million years ago.

With more observations in the early 2000s, researchers estimated that about 10 million years ago, its active galactic nucleus shot out twin jets in opposite directions. When examined across the electromagnetic spectrum, from X-ray to radio light, it's clear there is far more to this story that we still have to learn.

"Multi-wavelength studies of any galaxy are like the layers of an onion. Each wavelength shows you something different," said Marín. "With Webb's near- and mid-infrared instruments, we'll see far colder gas and dust than in previous observations, and learn much more about the environment at the center of the galaxy."

Visualizing Webb's Data

The team led by Lützgendorf and Marín will observe Centaurus A not only by taking images with Webb, but by gathering data known as spectra, which spread out light into its component wavelengths like a rainbow. Webb's spectra will reveal high-resolution information about the temperatures, speeds, and compositions of the material at the center of the galaxy.

In particular, Webb's Near Infrared Spectrograph (NIRSpec) and Mid-Infrared Instrument (MIRI) will provide the research team with a combination of data: an image plus a spectrum from within each pixel of that image. This will allow the researchers to build intricate 2D maps from the spectra that will help them identify what's happening behind the veil of dust at the center – and analyze it from many angles in depth.

Compare this style of modeling to the analysis of a garden. In the same way botanists classify plants based on specific sets of features, these researchers will classify spectra from Webb's MIRI to construct "gardens" or models. "If you take a snapshot of a garden from a great distance away," Marín explained, "You will see something green, but with Webb, we will be able to see individual leaves and flowers, their stems, and maybe the soil underneath."

As the research team digs into the spectra, they'll build maps from individual parts of the garden, comparing one spectrum to another nearby spectrum. This is analogous to determining which parts contain which plant species based on comparisons of "stems," "leaves," and "flowers" as they go.

"When it comes to spectral analysis, we conduct many comparisons," Marín continued. "If I compare two spectra in this region, maybe I will find that what was observed contains a prominent population of young stars. Or confirm which areas are both dusty and heated. Or maybe we will identify emission coming from the active galactic nucleus."

In other words, the "ecosystem" of spectra has many levels, which will allow the team to better define precisely what is present and where it is – which is made possible by Webb's specialized infrared instruments. And, since these studies will build on many that came before, the researchers will be able to confirm, refine, or break new ground by identifying new features.

Weighing the Black Hole in Centaurus A

The combination of images and spectra provided by NIRSpec and MIRI will allow the team to create very high-resolution maps of the speeds of the gas and stars at the center of Centaurus A. "We plan to use these maps to model how the entire disk at the center of the galaxy moves to more precisely determine the black hole's mass," Lützgendorf explains.

Since researchers understand how the gravity of a black hole governs the rotation of nearby gas, they can use the Webb data to weigh the black hole in Centaurus A. With a more complete set of infrared data, they will also determine if different parts of the gas are all behaving as anticipated. "I'm looking forward to fully filling out our data," Lützgendorf said. "I hope to see how the ionized gas behaves and twirls, and where we see the jets."

The researchers are also hoping to break new ground. "It's possible we'll find things we haven't considered yet," Lützgendorf explains. "In some aspects, we'll be covering completely new territory with Webb." Marín wholeheartedly agrees, and adds that building on a wealth of existing data is invaluable. "The most exciting aspects about these observations is the potential for new discoveries," she said. "I think we might find something that makes us look back to other data and reinterpret what was seen earlier."

These studies of Centaurus A will be conducted as part of Gillian Wright and Pierre Ferruit's joint MIRI and NIRSpec Guaranteed Time Observations programs. All of Webb's data will ultimately be stored in the publicly accessible Barbara A. Mikulski Archive for Space Telescopes (MAST) at the Space Telescope Science Institute in Baltimore.

The James Webb Space Telescope will be the world's premier space science observatory when it launches in 2021. Webb will solve mysteries in our solar system, look beyond to distant worlds around other stars, and probe the mysterious structures and origins of our universe and our place in it. Webb is an international program led by NASA with its partners, ESA (European Space Agency) and the Canadian Space Agency. 
 

Contact:  

Claire Blome / Christine Pulliam
Space Telescope Science Institute, Baltimore, Maryland
667-218-6426 / 410-338-4366

cblome@stsci.edu / cpulliam@stsci.edu

Related Links

NASA's Webb Portal

Source:  NASA's James Webb Space Telescope/News


Thursday, March 18, 2021

Cosmic Lens Reveals Faint Radio Galaxy

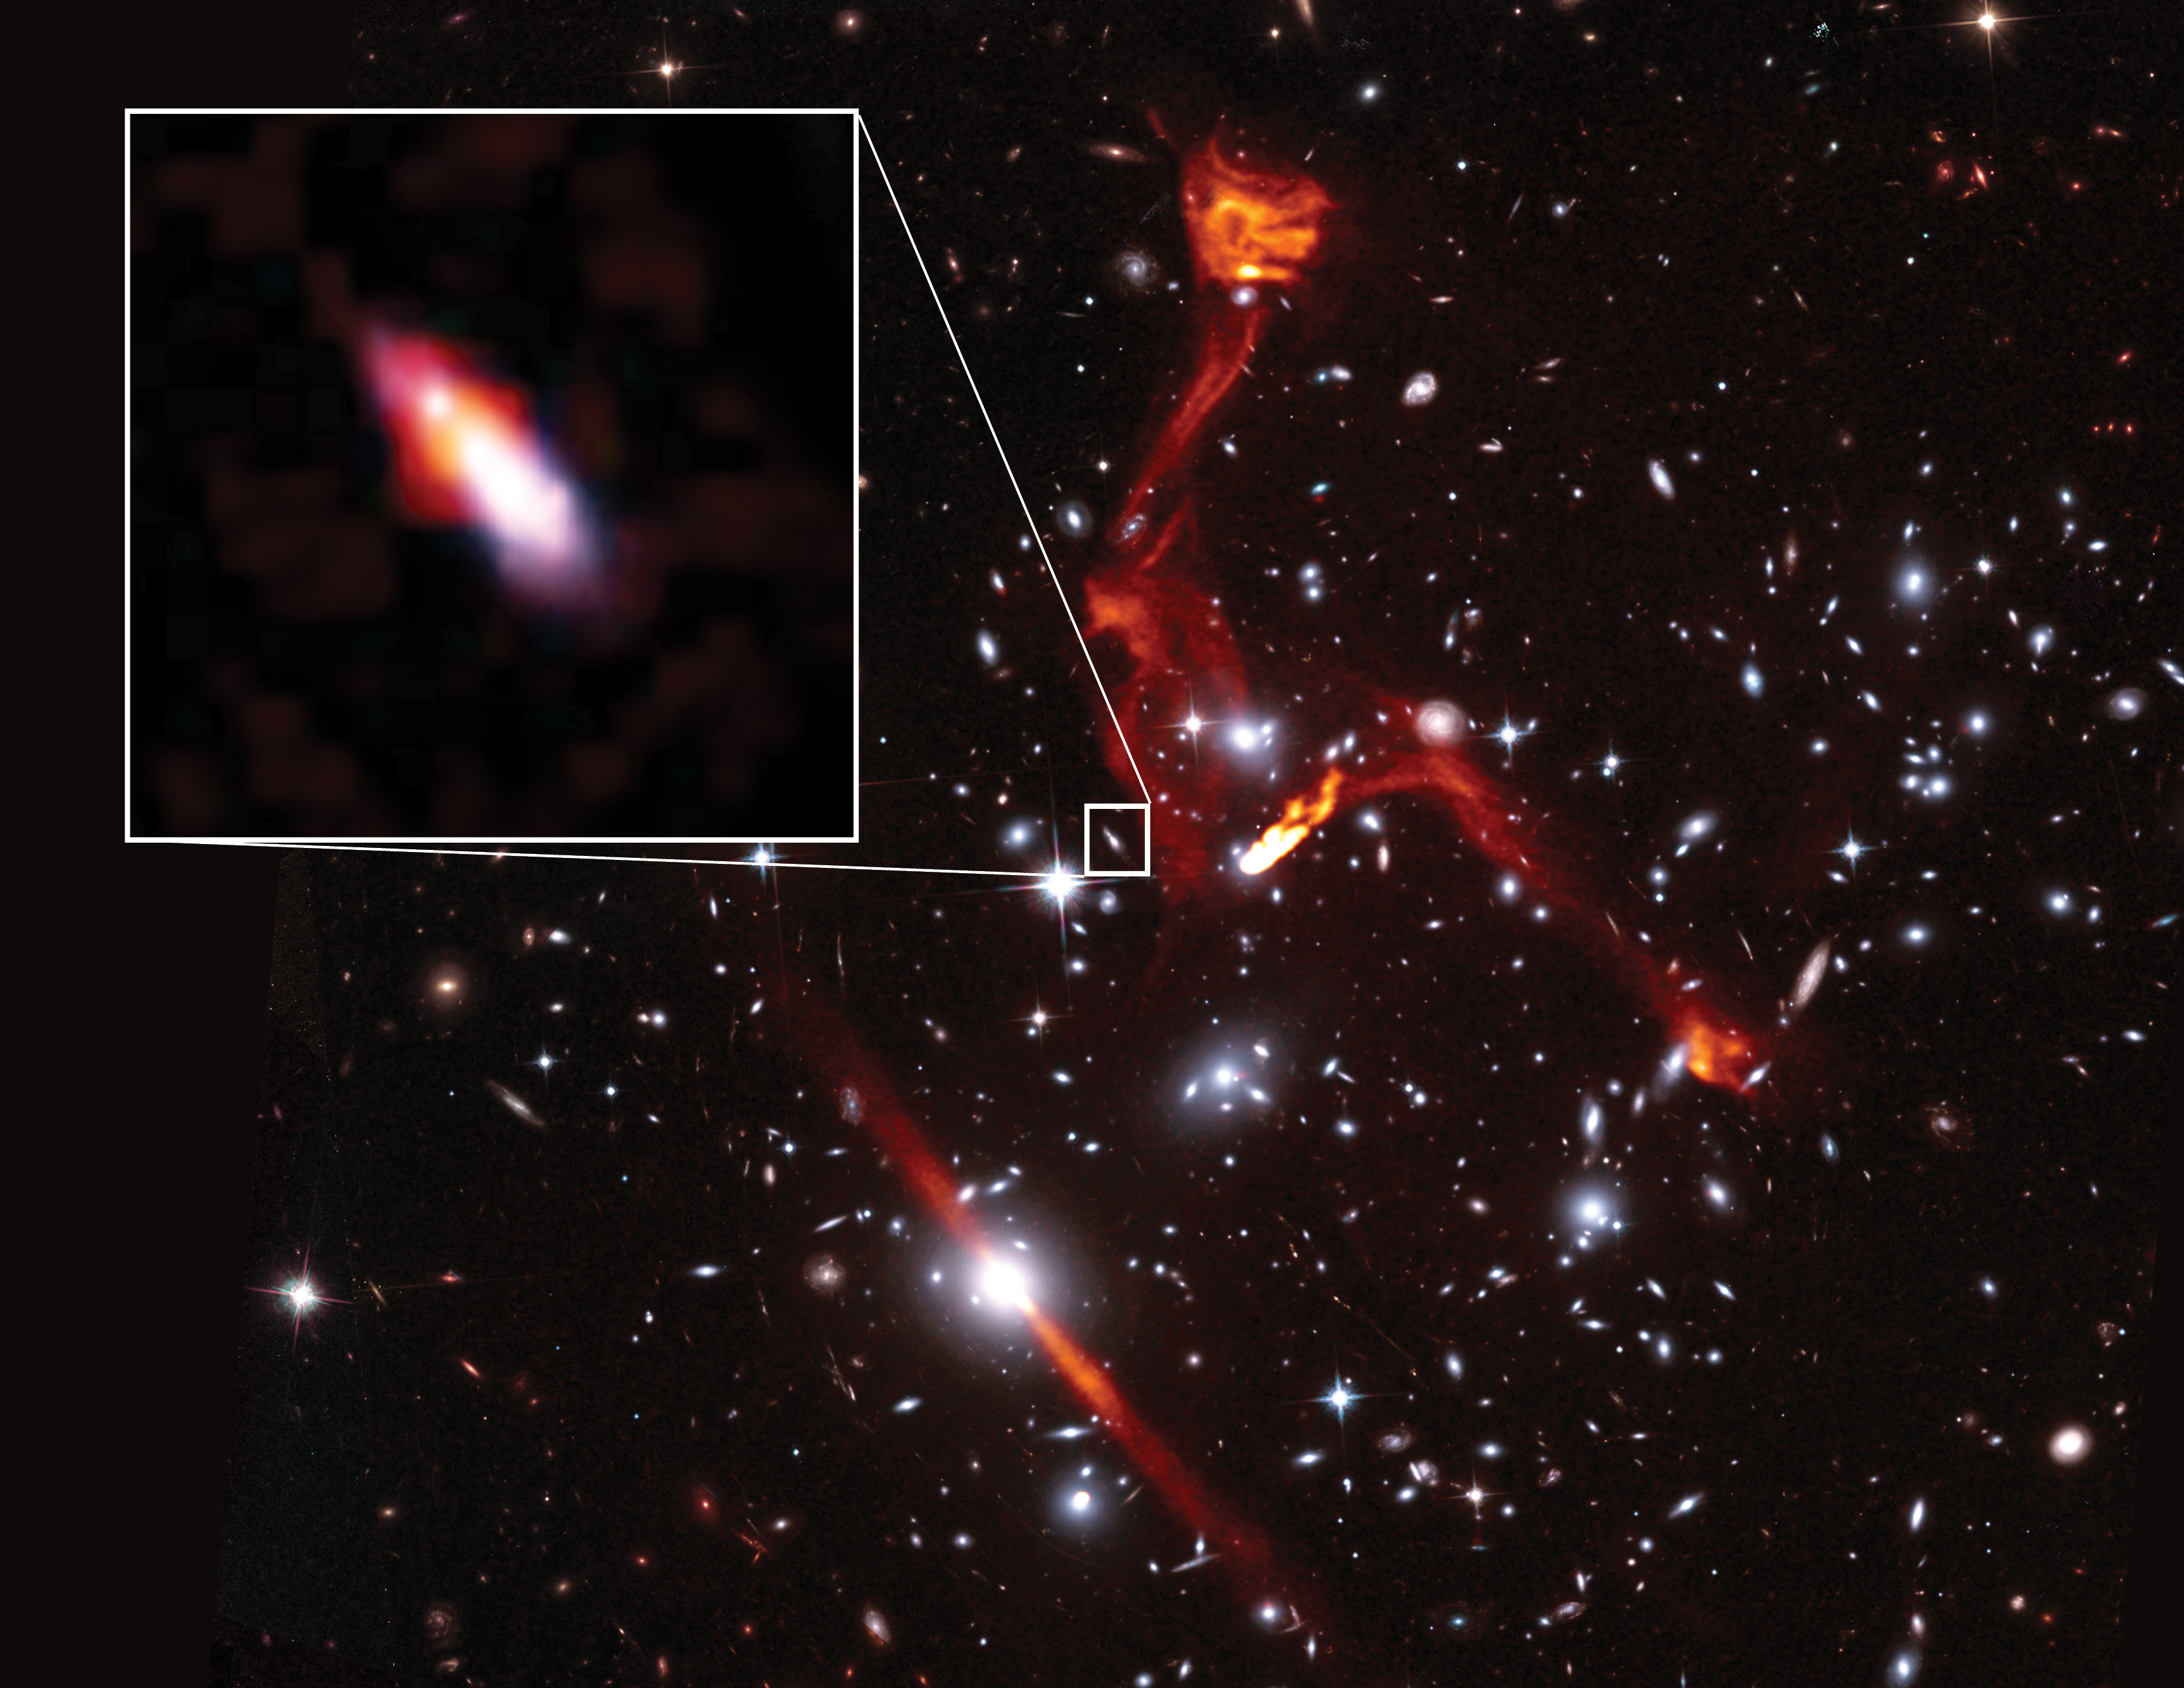
VLA radio image superimposed on a Hubble Space Telescope image of the galaxy cluster MACSJ0717.5+3745. Pullout shows distant galaxy VLAHFF-J071736.66+374506.4, far beyond the cluster, and likely the faintest radio-emitting object ever detected. The cluster is more than 5 billion light-years from Earth; the background galaxy more than 8 billion light-years distant. Credit: Heywood et al.; Sophia Dagnello, NRAO/AUI/NSF; STScI. Hi-res image

VLA radio image superimposed on a Hubble Space Telescope image of the galaxy cluster MACSJ0717.5+3745. The prominent red-orange objects are large structures called radio relics, possibly caused by shock waves within the cluster. Credit: Heywood et al.; Sophia Dagnello, NRAO/AUI/NSF; STScI. Hi-res image

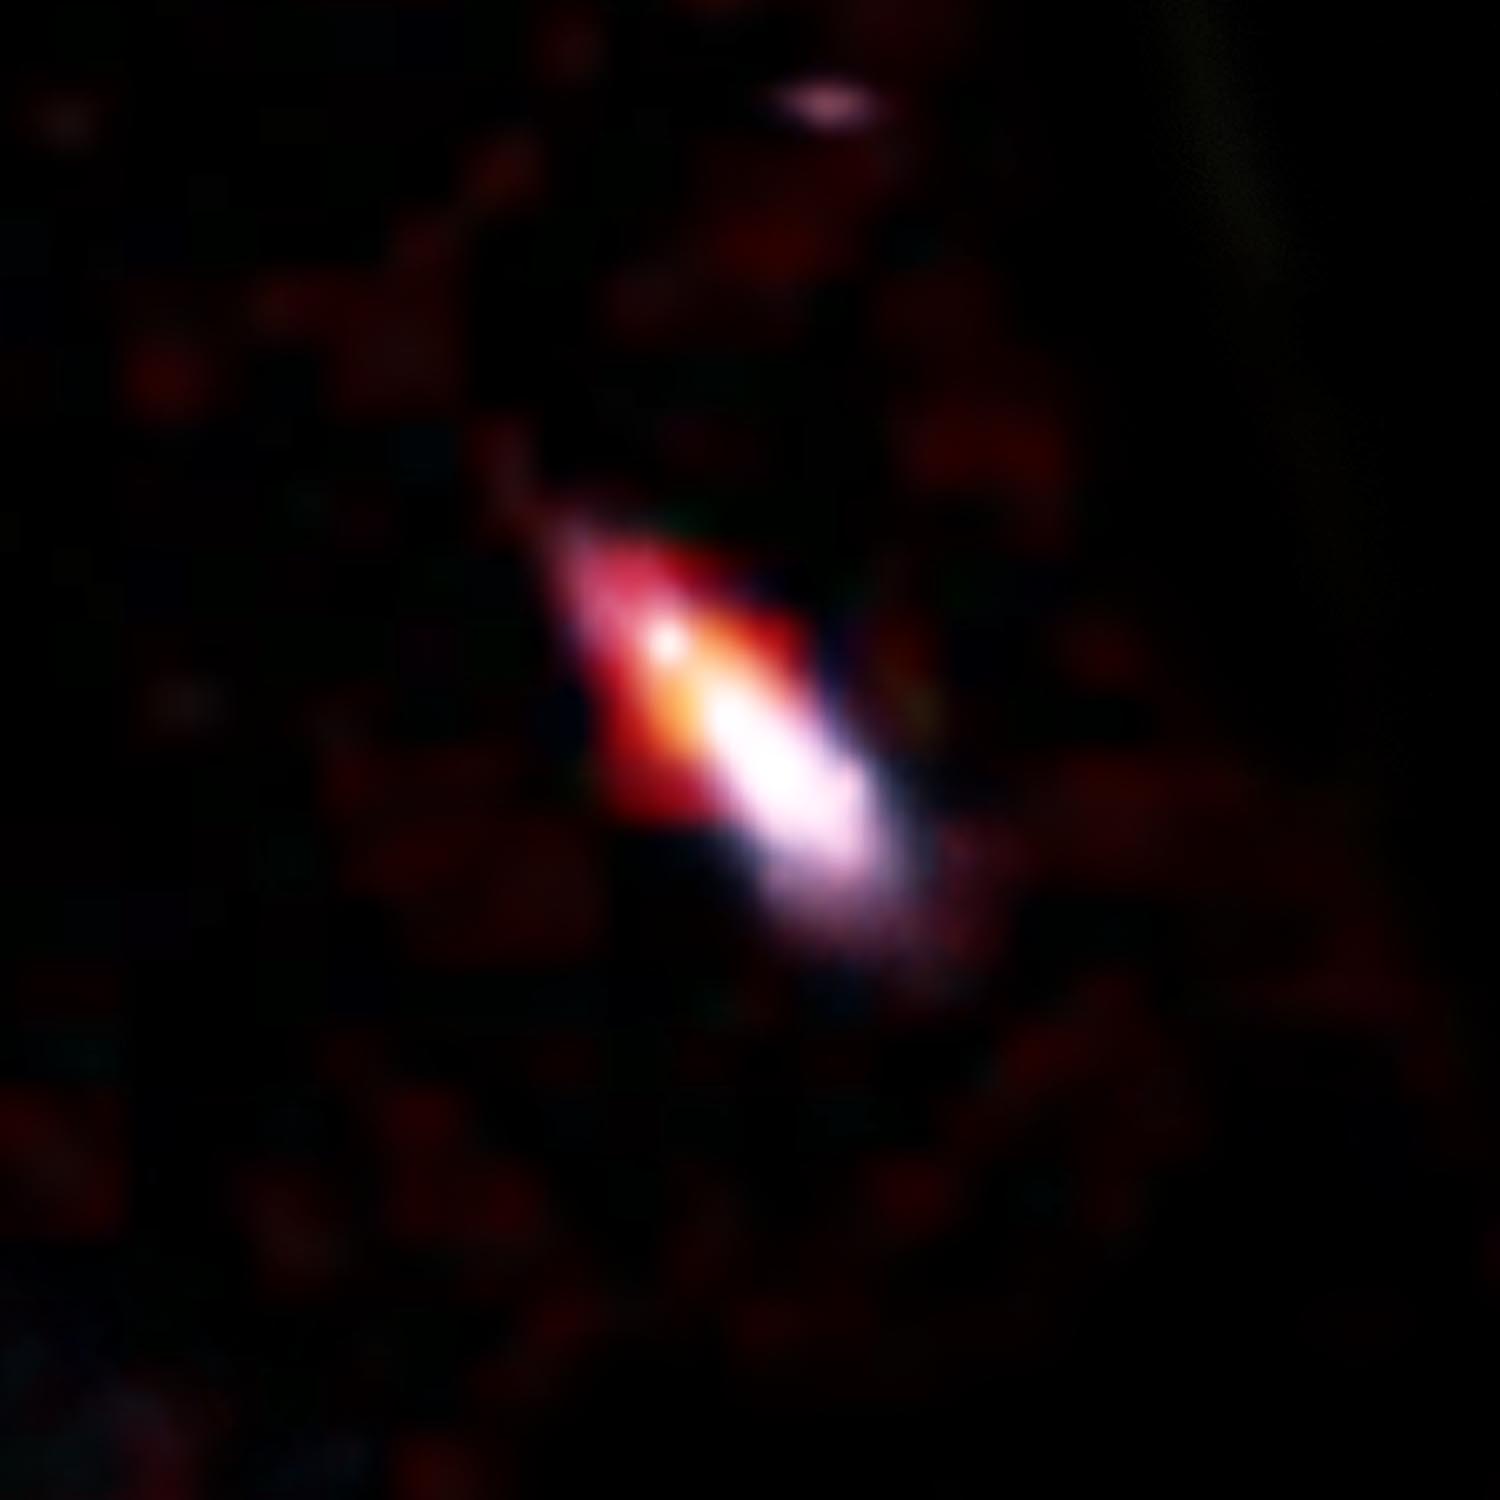
The distant galaxy VLAHFF-J071736.66+374506.4, more than 8 billion light-years from Earth.
Credit: Heywood et al.; Sophia Dagnello, NRAO/AUI/NSF; STScI
. Hi-res image

Radio telescopes are the world’s most sensitive radio receivers, capable of finding extremely faint wisps of radio emission coming from objects at the farthest reaches of the universe. Recently, a team of astronomers used the National Science Foundation’s Karl G. Jansky Very Large Array (VLA) to take advantage of a helping hand from nature to detect a distant galaxy that likely is the faintest radio-emitting object yet found.

The discovery was part of the VLA Frontier Fields Legacy Survey, led by NRAO Astronomer Eric Murphy, which used distant clusters of galaxies as natural lenses to study objects even farther away. The clusters served as gravitational lenses, using the gravitational pull of the galaxies in the clusters to bend and magnify light and radio waves coming from the more-distant objects.

In this composite, a VLA radio image is superimposed on a visible-light image from the Hubble Space Telescope. The prominent red-orange objects are radio relics — large structures possibly caused by shock waves — inside the foreground galaxy cluster, called MACSJ0717.5+3745, which is more than 5 billion light-years from Earth.

Detailed VLA observations showed that many of the galaxies in this image are emitting radio waves in addition to visible light. The VLA data revealed that one of these galaxies, shown in the pullout, is more than 8 billion light-years distant. Its light and radio waves have been bent by the intervening cluster’s gravitational-lensing effect.

The radio image of this distant galaxy, called VLAHFF-J071736.66+374506.4, has been magnified more than 6 times by the gravitational lens, the astronomers said. That magnification is what allowed the VLA to detect it.

“This probably is the faintest radio-emitting object ever detected,” said Ian Heywood, of Oxford University in the UK. “This is exactly why we want to use these galaxy clusters as powerful cosmic lenses to learn more about the objects behind them.”

“The magnification provided by the gravitational lens, combined with extremely sensitive VLA imaging, gave us an unprecedented look at the structure of a galaxy 300 times less massive than our Milky Way at a time when the universe was less than half its current age. This is giving us valuable insights on star formation in such low-mass galaxies at that time and how they eventually assembled into more massive galaxies,” said Eric Jimenez-Andrade, of NRAO.

The scientists are reporting their work in a pair of papers in the Astrophysical Journal.

The National Radio Astronomy Observatory is a facility of the National Science Foundation, operated under cooperative agreement by Associated Universities, Inc.

Links to Scientific Papers

***

Media Contact:

Dave Finley, Public Information Officer
(505) 241-9210

dfinley@nrao.edu

Source: National Radio Astronomy Observatory (NRAO)/News


Wednesday, March 17, 2021

Through the Clouds

Credit: ESA/Hubble & NASA, J. C. Tan (Chalmers University & University of Virginia), R. Fedriani (Chalmers University) Acknowledgement: Judy Schmidt

Nestled amongst the vast clouds of star-forming regions like this one lie potential clues about the formation of our own Solar System.

This week’s NASA/ESA Hubble Space Telescope Picture of the Week features AFGL 5180, a beautiful stellar nursery located in the constellation of Gemini (The Twins).

At the centre of the image, a massive star is forming and blasting cavities through the clouds with a pair of powerful jets, extending to the top right and bottom left of the image. Light from this star is mostly escaping and reaching us by illuminating these cavities, like a lighthouse piercing through the storm clouds.

Stars are born in dusty environments and although this dust makes for spectacular images, it can prevent astronomers from seeing stars embedded in it. Hubble’s Wide Field Camera 3 (WFC3) instrument is designed to capture detailed images in both visible and infrared light, meaning that the young stars hidden in vast star-forming regions like AFGL 5180 can be seen much more clearly.

Tuesday, March 16, 2021

Whispers from the dark side: What can gravitational waves reveal about dark matter? Scientists of the PRISMA+ Cluster of Excellence analyze data from the gravitational wave observatory NANOGrav

Representative illustration of the Earth embedded in space-time which is deformed by the background gravitational waves and its effects on radio signals coming from observed pulsars .  Credit: Ill./©: NANOGrav / T. Klein. Hi-res image

Scientists of the PRISMA+ Cluster of Excellence analyze data from the gravitational wave observatory NANOGrav

The NANOGrav Collaboration recently captured the first signs of very low-frequency gravitational waves. Prof. Pedro Schwaller and Wolfram Ratzinger analyzed the data and, in particular, considered the possibility of whether this may point towards new physics beyond the Standard Model. In an article published in the journal SciPost Physics, they report that the signal is consistent with both a phase transition in the early universe and the presence of a field of extremely light axion-like particles (ALPs). The latter are considered as promising candidates for dark matter.

Gravitational waves open a window into the early universe. While the ubiquitous cosmic microwave background yields no clues about the first 300,000 years of our universe, they provide some glimpses of what happened during Big Bang. "It's exactly this very early universe that is so exciting for particle physicists," explains Pedro Schwaller, Professor of Theoretical Physics at the PRISMA+ Cluster of Excellence at Johannes Gutenberg University Mainz (JGU). "This is the time when the elementary particles like quarks and gluons are present, and then combine to form the building blocks of atomic nuclei."

The special thing about the gravitational waves which the NANOGrav Collaboration has detected for the first time is that they have a very low frequency of 10-8 Hertz, which equates to approximately one oscillation per year. Due to their correspondingly large wavelength, in order to detect them any detector would also have to be equally large. As such a detector is not possible here on Earth, the astronomers at NANOGrav use distant pulsars and their light signals as huge detectors.

Wolfram Ratzinger outlines the motivation behind their work: "Even though so far the data only provides us with a first hint of the existence of low-frequency gravitational waves, it is still very exciting for us to work with them. This is because such waves could be produced by various processes that occurred in the early universe. We can now use the data we already have to decide, which of these come into consideration and which do not fit the data at all."

As a result, the Mainz-based scientists decided to take a particularly close look at two scenarios that could have caused the observed gravitational waves: Phase transitions in the early universe and a dark matter field of extremely light axion-like particles (ALPs). Phase transitions such as these occur due to the falling temperature in the primordial soup after the Big Bang and result in massive turbulences – however, like dark matter they are not covered by the Standard Model.

Based on the data available, Pedro Schwaller and Wolfram Ratzinger interpret the results of their analysis with relative caution: "Perhaps slightly more probable is the early phase transition scenario." On the other hand, the two physicists believe that the fact that they are able to work out certain possibilities based only on limited data proves the potential of their approach. "Our work is a first, but important development – it gives us a lot of confidence that with more precise data we can draw reliable conclusions about the message gravitational waves are sending us from the early universe."

"Furthermore," Pedro Schwaller concludes, "we can already begin to pin down certain characteristics of the scenarios and put constraints on them, in our case the strength of the phase transition and the mass of the axions." 

Publication

W. Ratzinger, P. Schwaller, Whispers from the dark side: Confronting light new physics with NANOGrav data, SciPost Physics 10, 23 February 2021,
DOI:10.21468/SciPostPhys.10.2.047

Related Links

Contact:

Prof. Dr. Pedro Schwaller
Theoretical High Energy Physics (THEP)
and PRISMA+ Cluster of Excellence
Institute of Physics 
Johannes Gutenberg-Universität Mainz
55099 Mainz

E-mail | Homepage

Wolfram Ratzinger
Theoretical High Energy Physics (THEP)
and PRISMA+ Cluster of Excellence
Institute of Physics 
Johannes Gutenberg-Universität Mainz
55099 Mainz

E-mail

 Source: Johannes Gutenberg-Universität Mainz/Press Release


Monday, March 15, 2021

Gravitational Waves Shed Light on How Heavy a Neutron Star Can Be

This still comes from a simulation of two neutron stars merging. Observations of collisions like these may help us determine the maximum mass a neutron star can attain. Credit: NASA/AEI/ZIB/M. Koppitz and L. Rezzolla

Artist’s impression of a strongly magnetized neutron star.
Credit:NASA/Penn State University/Casey Reed

Probability distribution function for the maximum mass of a non-rotating neutron star, as estimated by the authors’ genetic algorithm (blue curve) and in a previous study of GW170817 (purple curve). Credit: Nathanail et al. 2021 

What’s the largest mass that a neutron star — the dense, collapsed core of a massive star — can grow to before further collapsing into a black hole? Recent gravitational-wave events are providing new insight.

Finding the Maximum

Neutron stars consist almost entirely of neutrons packed together at the density of atomic nuclei. This extreme mass in such a small space results in an extraordinary inward gravitational pull that increases as more neutrons are packed in. When the crushing gravitational force exceeds the combined quantum and nuclear forces pushing outward, the star collapses to form a black hole.

What is the maximum mass limit above which a neutron star collapses? Theory suggests that, for a non-rotating neutron star, it’s somewhere around 2 or 3 times the mass of the Sun — but the precise value relies on the unknown state of matter inside the neutron star. To get around this missing information, we need observational constraints to help us pin down how heavy a neutron star can be.

Collisional Clues

In recent years, gravitational waves have provided valuable new insight. Two particular mergers of compact objects have tempted us with clues:

  1. GW170817
    In this event, two neutron stars in the range of 1.1–1.6 solar masses merged to form a larger object, which we think collapsed into a black hole shortly after merger. The gravitational-wave and electromagnetic observations of this process point to a maximum neutron star mass that’s less than 2.3 solar masses.
  2. GW190814
    In this event, a black hole of more than 20 solar masses merged with an object of just 2.5–2.7 solar masses — but we don’t know whether that smaller object was a black hole or a neutron star. If it was a non-rotating neutron star, then this would imply that the upper limit for neutron star mass is above 2.5 solar masses.

Can we reconcile these two potentially conflicting pieces of information? A study led by Antonios Nathanail (Institute for Theoretical Physics, Germany) presents new analysis that further explores what these mergers tell us about neutron star limits.

Probability distribution function for the maximum mass of a non-rotating neutron star, as estimated by the authors’ genetic algorithm (blue curve) and in a previous study of GW170817 (purple curve). Credit: Nathanail et al. 2021

A Lower Upper Limit

Nathanail and collaborators analyzed these two mergers by employing a genetic algorithm — an algorithm that explores a large parameter space and looks for optimized solutions by mimicking the process of natural selection. Using this algorithm, the authors identified which maximum mass solutions are consistent with gravitational-wave and electromagnetic observations of GW170817 and GW190814 and numerical simulations of mergers.

From their systematic investigation, the authors show that a large maximum neutron star mass — like the 2.5 solar masses required if GW190814’s secondary was a non-rotating neutron star — doesn’t mesh with our observations of GW170817 or with expectations from numerical simulations of gravitational wave production.

Instead, the authors find that a maximum neutron star mass of about 2.2 solar masses neatly reproduces the observations of GW170817 and is consistent with numerical simulations. This upper limit implies that GW190814’s secondary was too large to have been a non-rotating neutron star. Instead, GW190814 was likely the merger of two unequal-mass black holes.

Citation

“GW170817 and GW190814: Tension on the Maximum Mass,” Antonios Nathanail et al 2021 ApJL 908 L28.doi:10.3847/2041-8213/abdfc6

By


 Source: American Astronomical Society (AAS NOVA)


Sunday, March 14, 2021

How fast is the universe expanding? Galaxies provide one answer.

NGC 1453, a giant elliptical galaxy situated in the constellation Eridanus, was one of 63 galaxies used to calculate the expansion rate of the local universe. Last year, the MASSIVE survey team determined that the galaxy is located 166 million light years from Earth and has a black hole at its center with a mass nearly 3 billion times that of the sun. (Photo courtesy of the Carnegie-Irvine Galaxy Survey)

Determining how rapidly the universe is expanding is key to understanding our cosmic fate, but with more precise data has come a conundrum: Estimates based on measurements within our local universe don’t agree with extrapolations from the era shortly after the Big Bang 13.8 billion years ago.

A new estimate of the local expansion rate — the Hubble constant, or H0 (H-naught) — reinforces that discrepancy.

Using a relatively new and potentially more precise technique for measuring cosmic distances, which employs the average stellar brightness within giant elliptical galaxies as a rung on the distance ladder, astronomers calculate a rate — 73.3 kilometers per second per megaparsec, give or take 2.5 km/sec/Mpc — that lies in the middle of three other good estimates, including the gold standard estimate from Type Ia supernovae. This means that for every megaparsec — 3.3 million light years, or 3 billion trillion kilometers — from Earth, the universe is expanding an extra 73.3 ±2.5 kilometers per second. The average from the three other techniques is 73.5 ±1.4 km/sec/Mpc.

Perplexingly, estimates of the local expansion rate based on measured fluctuations in the cosmic microwave background and, independently, fluctuations in the density of normal matter in the early universe (baryon acoustic oscillations), give a very different answer: 67.4 ±0.5 km/sec/Mpc.

Astronomers are understandably concerned about this mismatch, because the expansion rate is a critical parameter in understanding the physics and evolution of the universe and is key to understanding dark energy — which accelerates the rate of expansion of the universe and thus causes the Hubble constant to change more rapidly than expected with increasing distance from Earth. Dark energy comprises about two-thirds of the mass and energy in the universe, but is still a mystery.

For the new estimate, astronomers measured fluctuations in the surface brightness of 63 giant elliptical galaxies to determine the distance and plotted distance against velocity for each to obtain H0. The surface brightness fluctuation (SBF) technique is independent of other techniques and has the potential to provide more precise distance estimates than other methods within about 100 Mpc of Earth, or 330 million light years. The 63 galaxies in the sample are at distances ranging from 15 to 99 Mpc, looking back in time a mere fraction of the age of the universe.

“For measuring distances to galaxies out to 100 megaparsecs, this is a fantastic method,” said cosmologist Chung-Pei Ma, the Judy Chandler Webb Professor in the Physical Sciences at the University of California, Berkeley, and professor of astronomy and physics. “This is the first paper that assembles a large, homogeneous set of data, on 63 galaxies, for the goal of studying H-naught using the SBF method.”

Ma leads the MASSIVE survey of local galaxies, which provided data for 43 of the galaxies — two-thirds of those employed in the new analysis.

The data on these 63 galaxies was assembled and analyzed by John Blakeslee, an astronomer with the National Science Foundation’s NOIRLab. He is first author of a paper now accepted for publication in The Astrophysical Journal that he co-authored with colleague Joseph Jensen of Utah Valley University in Orem. Blakeslee, who heads the science staff that support NSF’s optical and infrared observatories, is a pioneer in using SBF to measure distances to galaxies, and Jensen was one of the first to apply the method at infrared wavelengths. The two worked closely with Ma on the analysis.

“The whole story of astronomy is, in a sense, the effort to understand the absolute scale of the universe, which then tells us about the physics,” Blakeslee said, harkening back to James Cook’s voyage to Tahiti in 1769 to measure a transit of Venus so that scientists could calculate the true size of the solar system. “The SBF method is more broadly applicable to the general population of evolved galaxies in the local universe, and certainly if we get enough galaxies with the James Webb Space Telescope, this method has the potential to give the best local measurement of the Hubble constant.”

The James Webb Space Telescope, 100 times more powerful than the Hubble Space Telescope, is scheduled for launch in October.

Giant elliptical galaxies

The Hubble constant has been a bone of contention for decades, ever since Edwin Hubble first measured the local expansion rate and came up with an answer seven times too big, implying that the universe was actually younger than its oldest stars. The problem, then and now, lies in pinning down the location of objects in space that give few clues about how far away they are.

Hubble Space Telescope images of giant elliptical galaxies like this one, NGC 1453, are used to determine surface brightness fluctuations and estimate these galaxies’ distances from Earth. (Photo courtesy of the Space Telescope Science Institute)

Astronomers over the years have laddered up to greater distances, starting with calculating the distance to objects close enough that they seem to move slightly, because of parallax, as the Earth orbits the sun. Variable stars called Cepheids get you farther, because their brightness is linked to their period of variability, and Type Ia supernovae get you even farther, because they are extremely powerful explosions that, at their peak, shine as bright as a whole galaxy. For both Cepheids and Type Ia supernovae, it’s possible to figure out the absolute brightness from the way they change over time, and then the distance can be calculated from their apparent brightness as seen from Earth.

The best current estimate of H0 comes from distances determined by Type Ia supernova explosions in distant galaxies, though newer methods — time delays caused by gravitational lensing of distant quasars and the brightness of water masers orbiting black holes — all give around the same number.

The technique using surface brightness fluctuations is one of the newest and relies on the fact that giant elliptical galaxies are old and have a consistent population of old stars — mostly red giant stars — that can be modeled to give an average infrared brightness across their surface. The researchers obtained high-resolution infrared images of each galaxy with the Wide Field Camera 3 on the Hubble Space Telescope and determined how much each pixel in the image differed from the “average” — the smoother the fluctuations over the entire image, the farther the galaxy, once corrections are made for blemishes like bright star-forming regions, which the authors exclude from the analysis.

Neither Blakeslee nor Ma was surprised that the expansion rate came out close to that of the other local measurements. But they are equally confounded by the glaring conflict with estimates from the early universe — a conflict that many astronomers say means that our current cosmological theories are wrong, or at least incomplete.

The extrapolations from the early universe are based on the simplest cosmological theory — called lambda cold dark matter, or CDM — which employs just a few parameters to describe the evolution of the universe. Does the new estimate drive a stake into the heart of CDM?

“I think it pushes that stake in a bit more,” Blakeslee said. “But it (CDM) is still alive. Some people think, regarding all these local measurements, (that) the observers are wrong. But it is getting harder and harder to make that claim — it would require there to be systematic errors in the same direction for several different methods: supernovae, SBF, gravitational lensing, water masers. So, as we get more independent measurements, that stake goes a little deeper.”

Ma wonders whether the uncertainties astronomers ascribe to their measurements, which reflect both systematic errors and statistical errors, are too optimistic, and that perhaps the two ranges of estimates can still be reconciled.

“The jury is out,” she said. “I think it really is in the error bars. But assuming everyone’s error bars are not underestimated, the tension is getting uncomfortable.”

In fact, one of the giants of the field, astronomer Wendy Freedman, recently published a study pegging the Hubble constant at 69.8 ±1.9 km/sec/Mpc, roiling the waters even further. The latest result from Adam Riess, an astronomer who shared the 2011 Nobel Prize in Physics for discovering dark energy, reports 73.2 ±1.3 km/sec/Mpc. Riess was a Miller Postdoctoral Fellow at UC Berkeley when he performed this research, and he shared the prize with UC Berkeley and Berkeley Lab physicist Saul Perlmutter.

MASSIVE galaxies

The new value of H0 is a byproduct of two other surveys of nearby galaxies — in particular, Ma’s MASSIVE survey, which uses space and ground-based telescopes to exhaustively study the 100 most massive galaxies within about 100 Mpc of Earth. A major goal is to weigh the supermassive black holes at the centers of each one.

Another image of the giant elliptical galaxy NGC1453, taken by Pan-STARRS, the Panoramic Survey Telescope and Rapid Response System at the Haleakala Observatory on the island of Maui in Hawaii.

To do that, precise distances are needed, and the SBF method is the best to date, she said. The MASSIVE survey team used this method last year to determine the distance to a giant elliptical galaxy, NGC 1453, in the southern sky constellation of Eridanus. Combining that distance, 166 million light years, with extensive spectroscopic data from the Gemini and McDonald telescopes — which allowed Ma’s graduate students Chris Liepold and Matthew Quenneville to measure the velocities of the stars near the center of the galaxy — they concluded that NGC 1453 has a central black hole with a mass nearly 3 billion times that of the sun.

To determine H0, Blakeslee calculated SBF distances to 43 of the galaxies in the MASSIVE survey, based on 45 to 90 minutes of HST observing time for each galaxy. The other 20 came from another survey that employed HST to image large galaxies, specifically ones in which Type Ia supernovae have been detected.

Most of the 63 galaxies are between 8 and 12 billion years old, which means that they contain a large population of old red stars, which are key to the SBF method and can also be used to improve the precision of distance calculations. In the paper, Blakeslee employed both Cepheid variable stars and a technique that uses the brightest red giant stars in a galaxy — referred to as the tip of the red giant branch, or TRGB technique — to ladder up to galaxies at large distances. They produced consistent results. The TRGB technique takes account of the fact that the brightest red giants in galaxies have about the same absolute brightness.

“The goal is to make this SBF method completely independent of the Cepheid-calibrated Type Ia supernova method by using the James Webb Space Telescope to get a red giant branch calibration for SBFs,” he said.

“The James Webb telescope has the potential to really decrease the error bars for SBF,” Ma added. But for now, the two discordant measures of the Hubble constant will have to learn to live with one another.

“I was not setting out to measure H0; it was a great product of our survey,” she said. “But I am a cosmologist and am watching this with great interest.”

Co-authors of the paper with Blakeslee, Ma and Jensen are Jenny Greene of Princeton University, who is a leader of the MASSIVE team, and Peter Milne of the University of Arizona in Tucson, who leads the team studying Type Ia supernovae. The work was supported by the National Aeronautics and Space Administration (HST-GO-14219, HST-GO-14654, HST GO-15265) and the National Science Foundation (AST-1815417, AST-1817100).

 Related Information


Saturday, March 13, 2021

A Giant, Sizzling Planet May be Orbiting the Star Vega

Artist's conception showing the scorching-hot planet KELT-9b orbiting its host star. A newly detected signal may indicate the presence of a similar planet orbiting the star Vega. The discovery of KELT-9b also included major contributions from CfA scientists. Credit: NASA/JPL-Caltech. High Resolution (jpg)-Low Resolution (jpg)

The research, published this month in The Astronomical Journal, was led by Spencer Hurt, an astronomy undergraduate student at the University of Colorado Boulder. Hurt conducted the study during a 2019 summer research fellowship at the Center for Astrophysics | Harvard & Smithsonian, where he was mentored by astronomer Samuel Quinn.

The research focuses on an iconic and relatively young star, Vega, which is part of the constellation Lyra and has a mass twice that of our own sun. This celestial body sits just 25 light-years, or about 150 trillion miles, from Earth—pretty close, astronomically speaking.

Scientists can also see Vega with telescopes even when it’s light out, which makes it a prime candidate for research, says study co-author Quinn.

"It’s bright enough that you can observe it at twilight when other stars are getting washed out by sunlight," Quinn says.

Despite the star's fame, researchers have yet to find a single planet in orbit around Vega. That might be about to change: Drawing on a decade of observations from the ground, Hurt, Quinn and their colleagues unearthed a curious signal that could be the star's first-known world.

If the team's findings bear out, the alien planet would orbit so close to Vega that its years would last less than two-and-a-half Earth days. (Mercury, in contrast, takes 88 days to circle the sun). This candidate planet could also rank as the second hottest world known to science—with surface temperatures averaging a searing 5,390 degrees Fahrenheit.

Hurt says the group's research also helps to narrow down where other exotic worlds might be hiding in Vega's neighborhood.

"This is a massive system, much larger than our own solar system," Hurt says. "There could be other planets throughout that system. It's just a matter of whether we can detect them."

Youthful energy

Quinn would like to try. Scientists have discovered more than 4,000 exoplanets, or planets beyond Earth's solar system, to date. Few of those, however, circle stars that are as bright or as close to Earth as Vega. That means that, if there are planets around the star, scientists could get a really detailed look at them.

"It would be really exciting to find a planet around Vega because it offers possibilities for future characterization in ways that planets around fainter stars wouldn’t," Quinn says.

There's just one catch: Vega is what scientists call an A-type star, the name for objects that tend to be bigger, younger and much faster-spinning than our own sun. Vega, for example, rotates around its axis once every 16 hours—much faster than the sun with a rotational period that clocks in at 27 Earth days. Such a lightning-fast pace, Quinn says, can make it difficult for scientists to collect precise data on the star's motion and, by extension, any planets in orbit around it.

To take on that game of celestial hide-and-seek, he and colleagues pored through roughly 10 years of data on Vega collected by the Fred Lawrence Whipple Observatory in Arizona. In particular, the team was looking for a tell-tale signal of an alien planet—a slight jiggle in the star’s velocity.

"If you have a planet around a star, it tugs on the star, causing it to wobble back and forth," Quinn says.

Hot and puffy

The search may have paid off, Hurt says. The team discovered a signal that indicates that Vega might host what astronomers call a "hot Neptune" or maybe a "hot Jupiter."

"It would be at least the size of Neptune, potentially as big as Jupiter and would be closer to Vega than Mercury is to the sun," Hurt says.

That close to Vega, he adds, the candidate world might puff up like a balloon, and even iron would melt into gas in its atmosphere.

The researchers have a lot more work to do before they can definitively say that they’ve discovered this sizzling planet. Hurt noted that the easiest way to look for it might be to scan the stellar system directly to look for light emitted from the hot, bright planet.

For now, the student is excited to see his hard work reflected in the constellations: "Whenever I get to go outside and look at the night sky and see Vega, I say 'Hey, I know that star."

Other coauthors on the new study include David Latham, Gilbert Esquerdo, Michael Calkins, Perry Berlind, Christian Latham and George Zhou at the CfA; Andrew Vandeburg at the University of Wisconsin-Madison; and Ruth Angus at the American Museum of Natural History.

###

About the Center for Astrophysics | Harvard & Smithsonian

The Center for Astrophysics | Harvard & Smithsonian is a collaboration between Harvard and the Smithsonian designed to ask—and ultimately answer—humanity's greatest unresolved questions about the nature of the universe. The Center for Astrophysics is headquartered in Cambridge, MA, with research facilities across the U.S. and around the world.

Media Contact:

Nadia Whitehead
Public Affairs Officer
Center for Astrophysics | Harvard & Smithsonian

nadia.whitehead@cfa.harvard.edu
617-721-7371

Source:  Harvard-Smithsonian Center for Astrophysics (CfA)