Showing posts with label Type Ia supernovae. Show all posts

Thursday, August 14, 2025

NASA Roman Core Survey Will Trace Cosmic Expansion Over Time

These two images, taken one year apart by NASA's Hubble Space Telescope, show how the supernova designated SN 2018gv faded over time. The High-Latitude Time-Domain Survey by NASA’s Nancy Grace Roman Space Telescope will spot thousands of supernovae, including a specific type that can be used to measure the expansion history of the universe. Credits/Image: NASA, ESA, Martin Kornmesser (ESA), Mahdi Zamani (ESA/Hubble), Adam G. Riess (STScI, JHU), SH0ES Team

This infographic describes the High-Latitude Time-Domain Survey that will be conducted by NASA’s Nancy Grace Roman Space Telescope. The survey’s main component will cover over 18 square degrees — a region of sky as large as 90 full moons — and see supernovae that occurred up to about 8 billion years ago. Credits/Illustration: NASA-GSFC

This sonification that uses simulated data from NASA’s OpenUniverse project shows the variety of explosive events that will be detected by NASA’s Nancy Grace Roman Space Telescope and its High-Latitude Time-Domain Survey. Different sounds represent different types of events, as shown in the key at right. A single kilonova seen about 12 seconds into the video is represented with a cannon shot.

The sonification sweeps backward in time to greater distances from Earth, and the pitch of the instrument gets lower as you move outward. (Cosmological redshift has been converted to a light travel time expressed in billions of years.). Credits/Sonification: Martha Irene Saladino (STScI), Christopher Britt (STScI) - Visualization: Frank Summers (STScI) - Designer: NASA, STScI, Leah Hustak (STScI)


NASA’s Nancy Grace Roman Space Telescope will be a discovery machine, thanks to its wide field of view and resulting torrent of data. Scheduled to launch no later than May 2027, with the team working toward launch as early as fall 2026, its near-infrared Wide Field Instrument will capture an area 200 times larger than the Hubble Space Telescope’s infrared camera, and with the same image sharpness and sensitivity. Roman will devote about 75% of its science observing time over its five-year primary mission to conducting three core community surveys that were defined collaboratively by the scientific community. One of those surveys will scour the skies for things that pop, flash, and otherwise change, like exploding stars and colliding neutron stars.

Called the High-Latitude Time-Domain Survey, this program will peer outside of the plane of our Milky Way galaxy (i.e., high galactic latitudes) to study objects that change over time. The survey’s main goal is to detect tens of thousands of a particular type of exploding star known as type Ia supernovae. These supernovae can be used to study how the universe has expanded over time.

“Roman is designed to find tens of thousands of type Ia supernovae out to greater distances than ever before,” said Masao Sako of the University of Pennsylvania, who served as co-chair of the committee that defined the High-Latitude Time-Domain Survey. “Using them, we can measure the expansion history of the universe, which depends on the amount of dark matter and dark energy. Ultimately, we hope to understand more about the nature of dark energy.”

Probing Dark Energy

Type Ia supernovae are useful as cosmological probes because astronomers know their intrinsic luminosity, or how bright they inherently are, at their peak. By comparing this with their observed brightness, scientists can determine how far away they are. Roman will also be able to measure how quickly they appear to be moving away from us. By tracking how fast they’re receding at different distances, scientists will trace cosmic expansion over time.

Only Roman will be able to find the faintest and most distant supernovae that illuminate early cosmic epochs. It will complement ground-based telescopes like the Vera C. Rubin Observatory in Chile, which are limited by absorption from Earth’s atmosphere, among other effects. Rubin’s greatest strength will be in finding supernovae that happened within the past 5 billion years. Roman will expand that collection to much earlier times in the universe’s history, about 3 billion years after the big bang, or as much as 11 billion years in the past. This would more than double the measured timeline of the universe’s expansion history.

Recently, the Dark Energy Survey found hints that dark energy may be weakening over time, rather than being a constant force of expansion. Roman’s investigations will be critical for testing this possibility.

Seeking Exotic Phenomena

To detect transient objects, whose brightness changes over time, Roman must revisit the same fields at regular intervals. The High-Latitude Time-Domain Survey will devote a total of 180 days of observing time to these observations spread over a five-year period. Most will occur over a span of two years in the middle of the mission, revisiting the same fields once every five days, with an additional 15 days of observations early in the mission to establish a baseline.

“To find things that change, we use a technique called image subtraction,” Sako said. “You take an image, and you subtract out an image of the same piece of sky that was taken much earlier — as early as possible in the mission. So you remove everything that’s static, and you’re left with things that are new.”

The survey will also include an extended component that will revisit some of the observing fields approximately every 120 days to look for objects that change over long timescales. This will help to detect the most distant transients that existed as long ago as one billion years after the big bang. Those objects vary more slowly due to time dilation caused by the universe’s expansion.

“You really benefit from taking observations over the entire five-year duration of the mission,” said Brad Cenko of NASA’s Goddard Space Flight Center in Greenbelt, Maryland, the other co-chair of the survey committee. “It allows you to capture these very rare, very distant events that are really hard to get at any other way but that tell us a lot about the conditions in the early universe.”

This extended component will collect data on some of the most energetic and longest-lasting transients, such as tidal disruption events — when a supermassive black hole shreds a star — or predicted but as-yet unseen events known as pair-instability supernovae, where a massive star explodes without leaving behind a neutron star or black hole.

Survey Details

The High-Latitude Time-Domain Survey will be split into two imaging “tiers” — a wide tier that covers more area and a deep tier that will focus on a smaller area for a longer time to detect fainter objects. The wide tier, totaling a bit more than 18 square degrees, will target objects within the past 7 billion years, or half the universe’s history. The deep tier, covering an area of 6.5 square degrees, will reach fainter objects that existed as much as 10 billion years ago. The observations will take place in two areas, one in the northern sky and one in the southern sky. There will also be a spectroscopic component to this survey, which will be limited to the southern sky.

“We have a partnership with the ground-based Subaru Observatory, which will do spectroscopic follow-up of the northern sky, while Roman will do spectroscopy in the southern sky. With spectroscopy, we can confidently tell what type of supernovae we’re seeing,” said Cenko.

Together with Roman’s other two core community surveys, the High-Latitude Wide-Area Survey and the Galactic Bulge Time-Domain Survey, the High-Latitude Time-Domain Survey will help map the universe with a clarity and to a depth never achieved before.

The Nancy Grace Roman Space Telescope is managed at NASA’s Goddard Space Flight Center in Greenbelt, Maryland, with participation by NASA’s Jet Propulsion Laboratory in Southern California; Caltech/IPAC in Pasadena, California; the Space Telescope Science Institute in Baltimore; and a science team comprising scientists from various research institutions. The primary industrial partners are BAE Systems, Inc. in Boulder, Colorado; L3Harris Technologies in Melbourne, Florida; and Teledyne Scientific & Imaging in Thousand Oaks, California.


About This Release

Credits:

Media Contact:

Christine Pulliam
Space Telescope Science Institute, Baltimore

Permissions: Content Use Policy


Wednesday, July 23, 2025

Swirling spiral in Hydra

A spiral galaxy with a disc made up of several swirling arms. Patchy blue clouds of gas are speckled over the disc, where stars are forming and lighting up the gas around them. The core of the galaxy is large and shines brightly gold, while the spiral arms are a paler and faint reddish colour. Neighbouring galaxies - from small, elongated spots to larger swirling spirals - can be seen across the black background. Credit: ESA/Hubble & NASA, R. J. Foley (UC Santa Cruz)

The swirling spiral galaxy in this NASA/ESA Hubble Space Telescope Picture of the Week is NGC 3285B, which resides 137 million light-years away in the constellation Hydra (The Water Snake). Hydra has the largest area of the 88 constellations that cover the entire sky in a celestial patchwork. It’s also the longest constellation, stretching 100 degrees across the sky. It would take nearly 200 full Moons, placed side by side, to reach from one side of the constellation to the other.

NGC 3285B is a member of the Hydra I cluster, one of the largest galaxy clusters in the nearby Universe. Galaxy clusters are collections of hundreds to thousands of galaxies that are bound to one another by gravity. The Hydra I cluster is anchored by two giant elliptical galaxies at its centre. Each of these galaxies is about 150,000 light-years across, making them about 50% larger than our home galaxy, the Milky Way.

NGC 3285B sits on the outskirts of its home cluster, far from the massive galaxies at the centre. This galaxy drew Hubble’s attention because it hosted a Type Ia supernova in 2023. Type Ia supernovae happen when a type of condensed stellar core called a white dwarf detonates, igniting a sudden burst of nuclear fusion that briefly shines about 5 billion times brighter than the Sun. The supernova, named SN 2023xqm, is visible here as a blue-ish dot on the left edge of the galaxy’s disc.

Hubble observed NGC 3285B as part of an observing programme that targeted 100 Type Ia supernovae. By viewing each of these supernovae in ultraviolet, optical, and near-infrared light, researchers aim to disentangle the effects of distance and dust, both of which can make a supernova appear redder than it actually is. This programme will help refine cosmic distance measurements that rely on observations of Type Ia supernovae.


Tuesday, December 31, 2024

Pale blue (supernova) dot

A spiral galaxy with two thin, slowly-curving arms, one fainter than the other, coming off the tips of a bright, oval-shaped core region. The disc of the galaxy is also oval-shaped and filled with fuzzy dust under the arms. It has some bright spots where stars are concentrated, especially along the arms. The core has a white glow in the centre and thick bands of gas around it. A supernova is visible as a pale blue dot near the core. Credit: ESA/Hubble & NASA, R. J. Foley (UC Santa Cruz)

This NASA/ESA Hubble Space Telescope Picture of the Week features the galaxy LEDA 22057, which is located about 650 million light-years away in the constellation Gemini. Like the subject of last week’s Picture of the Week, LEDA 22057 is the site of a supernova explosion. This particular supernova, named SN 2024PI, was discovered by an automated survey in January 2024. The survey covers the entire northern half of the night sky every two days and has catalogued more than 10 000 supernovae.

The supernova is visible in this image: located just down and to the right of the galactic nucleus, the pale blue dot of SN 2024PI stands out against the galaxy’s ghostly spiral arms. This image was taken about a month and a half after the supernova was discovered, so the supernova is seen here many times fainter than its maximum brilliance.

SN 2024PI is classified as a Type Ia supernova. This type of supernova requires a remarkable object called a white dwarf, the crystallised core of a star with a mass less than about eight times the mass of the Sun. When a star of this size uses up the supply of hydrogen in its core, it balloons into a red giant, becoming cool, puffy and luminous. Over time, pulsations and stellar winds cause the star to shed its outer layers, leaving behind a white dwarf and a colourful planetary nebula. White dwarfs can have surface temperatures higher than 100 000 degrees and are extremely dense, packing roughly the mass of the Sun into a sphere the size of Earth.

While nearly all of the stars in the Milky Way will one day evolve into white dwarfs — this is the fate that awaits the Sun some five billion years in the future — not all of them will explode as Type Ia supernovae. For that to happen, the white dwarf must be a member of a binary star system. When a white dwarf syphons material from a stellar partner, the white dwarf can become too massive to support itself. The resulting burst of runaway nuclear fusion destroys the white dwarf in a supernova explosion that can be seen many galaxies away.


Tuesday, May 14, 2024

Lenticular dust in detail

Lenticular galaxy NGC 4753 is featured with a bright white core and surrounding defined dust lanes around its nucleus, that predominantly appear dark brown in colour. A variety of faint stars fill the background of the image. Credit: ESA/Hubble & NASA, L. Kelsey. Hi-res image

Featured in this new image from the NASA/ESA Hubble Space Telescope is a nearly edge-on view of the lenticular galaxy NGC 4753. These galaxies have an elliptical shape and ill-defined spiral arms.

This image is the object's sharpest view to date, showcasing Hubble’s incredible resolving power and ability to reveal complex dust structures. NGC 4753 resides around 60 million light-years from Earth in the constellation Virgo and was first discovered by the astronomer William Herschel in 1784. It is a member of the NGC 4753 Group of galaxies within the Virgo II Cloud, which comprises roughly 100 galaxies and galaxy clusters.

This galaxy is believed to be the result of a galactic merger with a nearby dwarf galaxy roughly 1.3 billion years ago. NGC 4753’s distinct dust lanes around its nucleus are believed to have been accreted from this merger event.

It is now believed that most of the mass in the galaxy lies in a slightly flattened spherical halo of dark matter. Dark matter is a form of matter that cannot currently be observed directly, but is thought to comprise about 85% of all matter in the Universe. It is referred to as ‘dark’ because it does not appear to interact with the electromagnetic field, and therefore does not seem to emit, reflect or refract light.

This object is also of scientific interest to test different theories of formation of lenticular galaxies, given its low-density environment and complex structure. Furthermore, this galaxy has been host to two known Type Ia supernovae. These types of supernovae are extremely important as they are all caused by exploding white dwarfs which have companion stars, and always peak at the same brightness — 5 billion times brighter than the Sun. Knowing the true brightness of these events, and comparing this with their apparent brightness, gives astronomers a unique chance to measure distances in the Universe.


Sunday, February 04, 2024

Monthly Roundup: Supernovae in the Spotlight

This narrow ribbon of glowing gas is a tiny section of the expanding bubble of the Cygnus Loop supernova remnant;

Credit:NASA, ESA, Ravi Sankrit (STScI)

A supernova is a spectacular way for a star to die. Massive stars meet this fate when the outward pressure exerted by core nuclear fusion can no longer hold off the gravity of the star’s outer layers, and the remnants of lower-mass stars can attain this honor through accretion or collisions. Today we’ll introduce four research articles that examine various aspects of supernova science, from attempts to determine how lightweight a supernova progenitor star can be to exploring why some massive stars don’t produce supernovae at all.


The main stellar evolution pathways. It’s not yet clear exactly which stars explode as supernovae and which become white dwarfs. Credit:
ESA

Probing the Smallest Supernova Stars

Where is the dividing line between stars that end their lives in core-collapse supernovae and those that are fated to become white dwarfs? The least massive stars that undergo core collapse lie somewhere in the 8–12-solar-mass range, and refining the estimate further requires researchers to track down the faintest, most rapidly evolving supernovae.

Luckily, increasing coverage by transient-hunting surveys has generated a growing sample of these faint, fast events. Kaustav Das (California Institute of Technology) and coauthors studied nine supernovae detected by the Zwicky Transient Facility that were found to have certain chemical abundance ratios that hint at the progenitor stars being low mass. These supernovae are calcium-rich Type IIb supernovae, which have much larger [Ca II]/[O I] ratios than typical core-collapse supernovae.

Das’s team used spectra of each of these supernovae to measure the amount of oxygen present, which can be used in theoretical models to estimate the mass of the star that exploded. The mass estimates for all stars in the sample were less than 12 solar masses, suggesting that this type of supernova tends to arise from stars near the low-mass end of the progenitor mass range. The current sample of known calcium-rich Type IIb supernovae is still small, but future detections should allow researchers to refine models and improve estimates.

Not all massive stars end their lives as supernovae, leaving behind a supernova remnant like W49B shown here.
Credit: X-ray:
NASA/CXC/MIT/L.Lopez et al.; Infrared: Palomar; Radio: NSF/NRAO/VLA

Focusing on Failed Supernovae

When massive stars extinguish their core nuclear fusion and collapse, do they always generate luminous supernovae? Both observations and theory suggest that the answer is no, with some would-be supernovae forming a black hole with no accompanying supernova. Up to a third of massive stars might fail to generate a supernova!

Eric Coughlin (Syracuse University) performed a mathematical exploration of failed supernovae, focusing on the creation and propagation of a shock between the collapsing core and the outward-moving outer layers of the star. Coughlin showed that while some dying massive stars don’t produce supernovae per se, they still undergo an explosion that marks their impending demise. The strength of the explosion from a failed supernova depends on the properties of the star and how much of its mass is lost in the form of neutrinos: chargeless, nearly massless subatomic particles that rarely interact with matter.

In addition to the mathematical solutions that described the explosions, the equations also permitted a solution in which the matter settles near the central object. While we’ll have to wait for future work for a full examination of these solutions, it’s possible that they’ll apply to smaller stellar outbursts that do not destroy the star.


The event rates for a 1.98-solar-mass protoneutron star with various accretion rates as seen by Super-Kamiokande (left) and DUNE (right) and for normal (top) and inverted (bottom) neutrino mass hierarchies. Credit: Akaho et al. 2024

Prospects for Detecting Supernova Neutrinos

When a massive star’s core collapses, it can form a black hole or a neutron star: an extremely dense, rapidly spinning, city-sized sphere made almost entirely of neutrons. As protons and electrons are crushed into neutrons in the star’s core, the transformation produces neutrinos that push the star’s collapsing outer layers outward. While most of the star’s outer layers escape, forming the glowing, complex structures of a supernova remnant, a small fraction of the material falls back onto the protoneutron star, generating even more neutrinos.

Ryuichiro Akaho (Waseda University) and collaborators calculated the likelihood of detecting the neutrinos that are produced when material rebounding from the collapsed stellar core falls back onto the core. Using detailed neutrino radiation–hydrodynamics simulations, the team modeled the fluxes and flavors of the neutrinos produced about ten seconds after the supernova occurs.

Akaho’s team found that the mass of the protoneutron star and the rate at which it gathers material from its surroundings both have an impact on the output neutrino luminosity and the average energy of the neutrinos. For a supernova happening about 33,000 light-years away, the neutrino flux should rise above the background measured by the existing Super-Kamiokande and under-construction Deep Underground Neutrino Experiment (DUNE) detectors. The exact strength of the signal depends on several factors, including neutrino oscillation — the process through which a neutrino born in a certain “flavor” morphs to a different flavor as it travels through space.


Illustrations of the two main Type Ia supernova pathways: the single-degenerate model (top) and the double-degenerate model (bottom). Both images from NASA’s Goddard Space Flight Center Conceptual Image Lab

Investigating Type Ia Supernova Diversity

Supernovae aren’t always the result of massive stars collapsing. Many arise from white dwarfs, which are the exposed cores of low- to intermediate-mass stars that have finished fusing hydrogen in their cores and lost their outer layers. When a white dwarf accretes gas from a companion star, the white dwarf gains mass and heats up, eventually triggering a supernova. Alternatively, the collision of two white dwarfs can generate a supernova. Supernovae arising from white dwarfs are called Type Ia or thermonuclear runaway supernovae.

Observations show that Type Ia supernovae have substantial variety in their light curves and properties, leading Mao Ogawa (Kyoto University) and collaborators to investigate the origins of this diversity. Ogawa’s team focused on the division between normal-velocity and high-velocity supernovae, which are differentiated by the velocity of their ejecta.

The team selected a sample of 14 Type Ia supernovae for which spectra were collected within one week of the explosion being detected at Earth. The sample included high-velocity supernovae, normal-velocity supernovae, and some that were similar to the peculiar supernova SN 1999aa. The team then used radiative transfer modeling to model the spectra and extract the properties of the supernova ejecta. Ultimately, they found that the supernovae fell into two groups: one with high-density, carbon-poor ejecta, which makes up the high-velocity sample and some of the normal-velocity sample and one that has low-density, carbon rich ejecta, which makes up the remaining normal-velocity sample and those like SN 1999aa. While more work remains to be done, the team suspects these two groups might be the result of different formation mechanisms.

By Kerry Hensley


Citation

“Probing the Low-Mass End of Core-Collapse Supernovae Using a Sample of Strongly Stripped Calcium-Rich Type IIb Supernovae from the Zwicky Transient Facility,” Kaustav K. Das et al 2023 ApJ 959 12. doi:10.3847/1538-4357/acfeeb

“The Division Between Weak and Strong Explosions from Failed Supernovae,” Eric R Coughlin 2023 ApJ 955 110. doi:10.3847/1538-4357/acf313

“Detectability of Late-Time Supernova Neutrinos with Fallback Accretion onto Protoneutron Star,” Ryuichiro Akaho et al 2024 ApJ 960 116. doi:10.3847/1538-4357/ad118c

“Systematic Investigation of Very-early-phase Spectra of Type Ia Supernovae,” Mao Ogawa et al 2023 ApJ 955 49. doi:10.3847/1538-4357/acec74


Thursday, May 19, 2022

Hubble Reaches New Milestone in Mystery of Universe's Expansion Rate


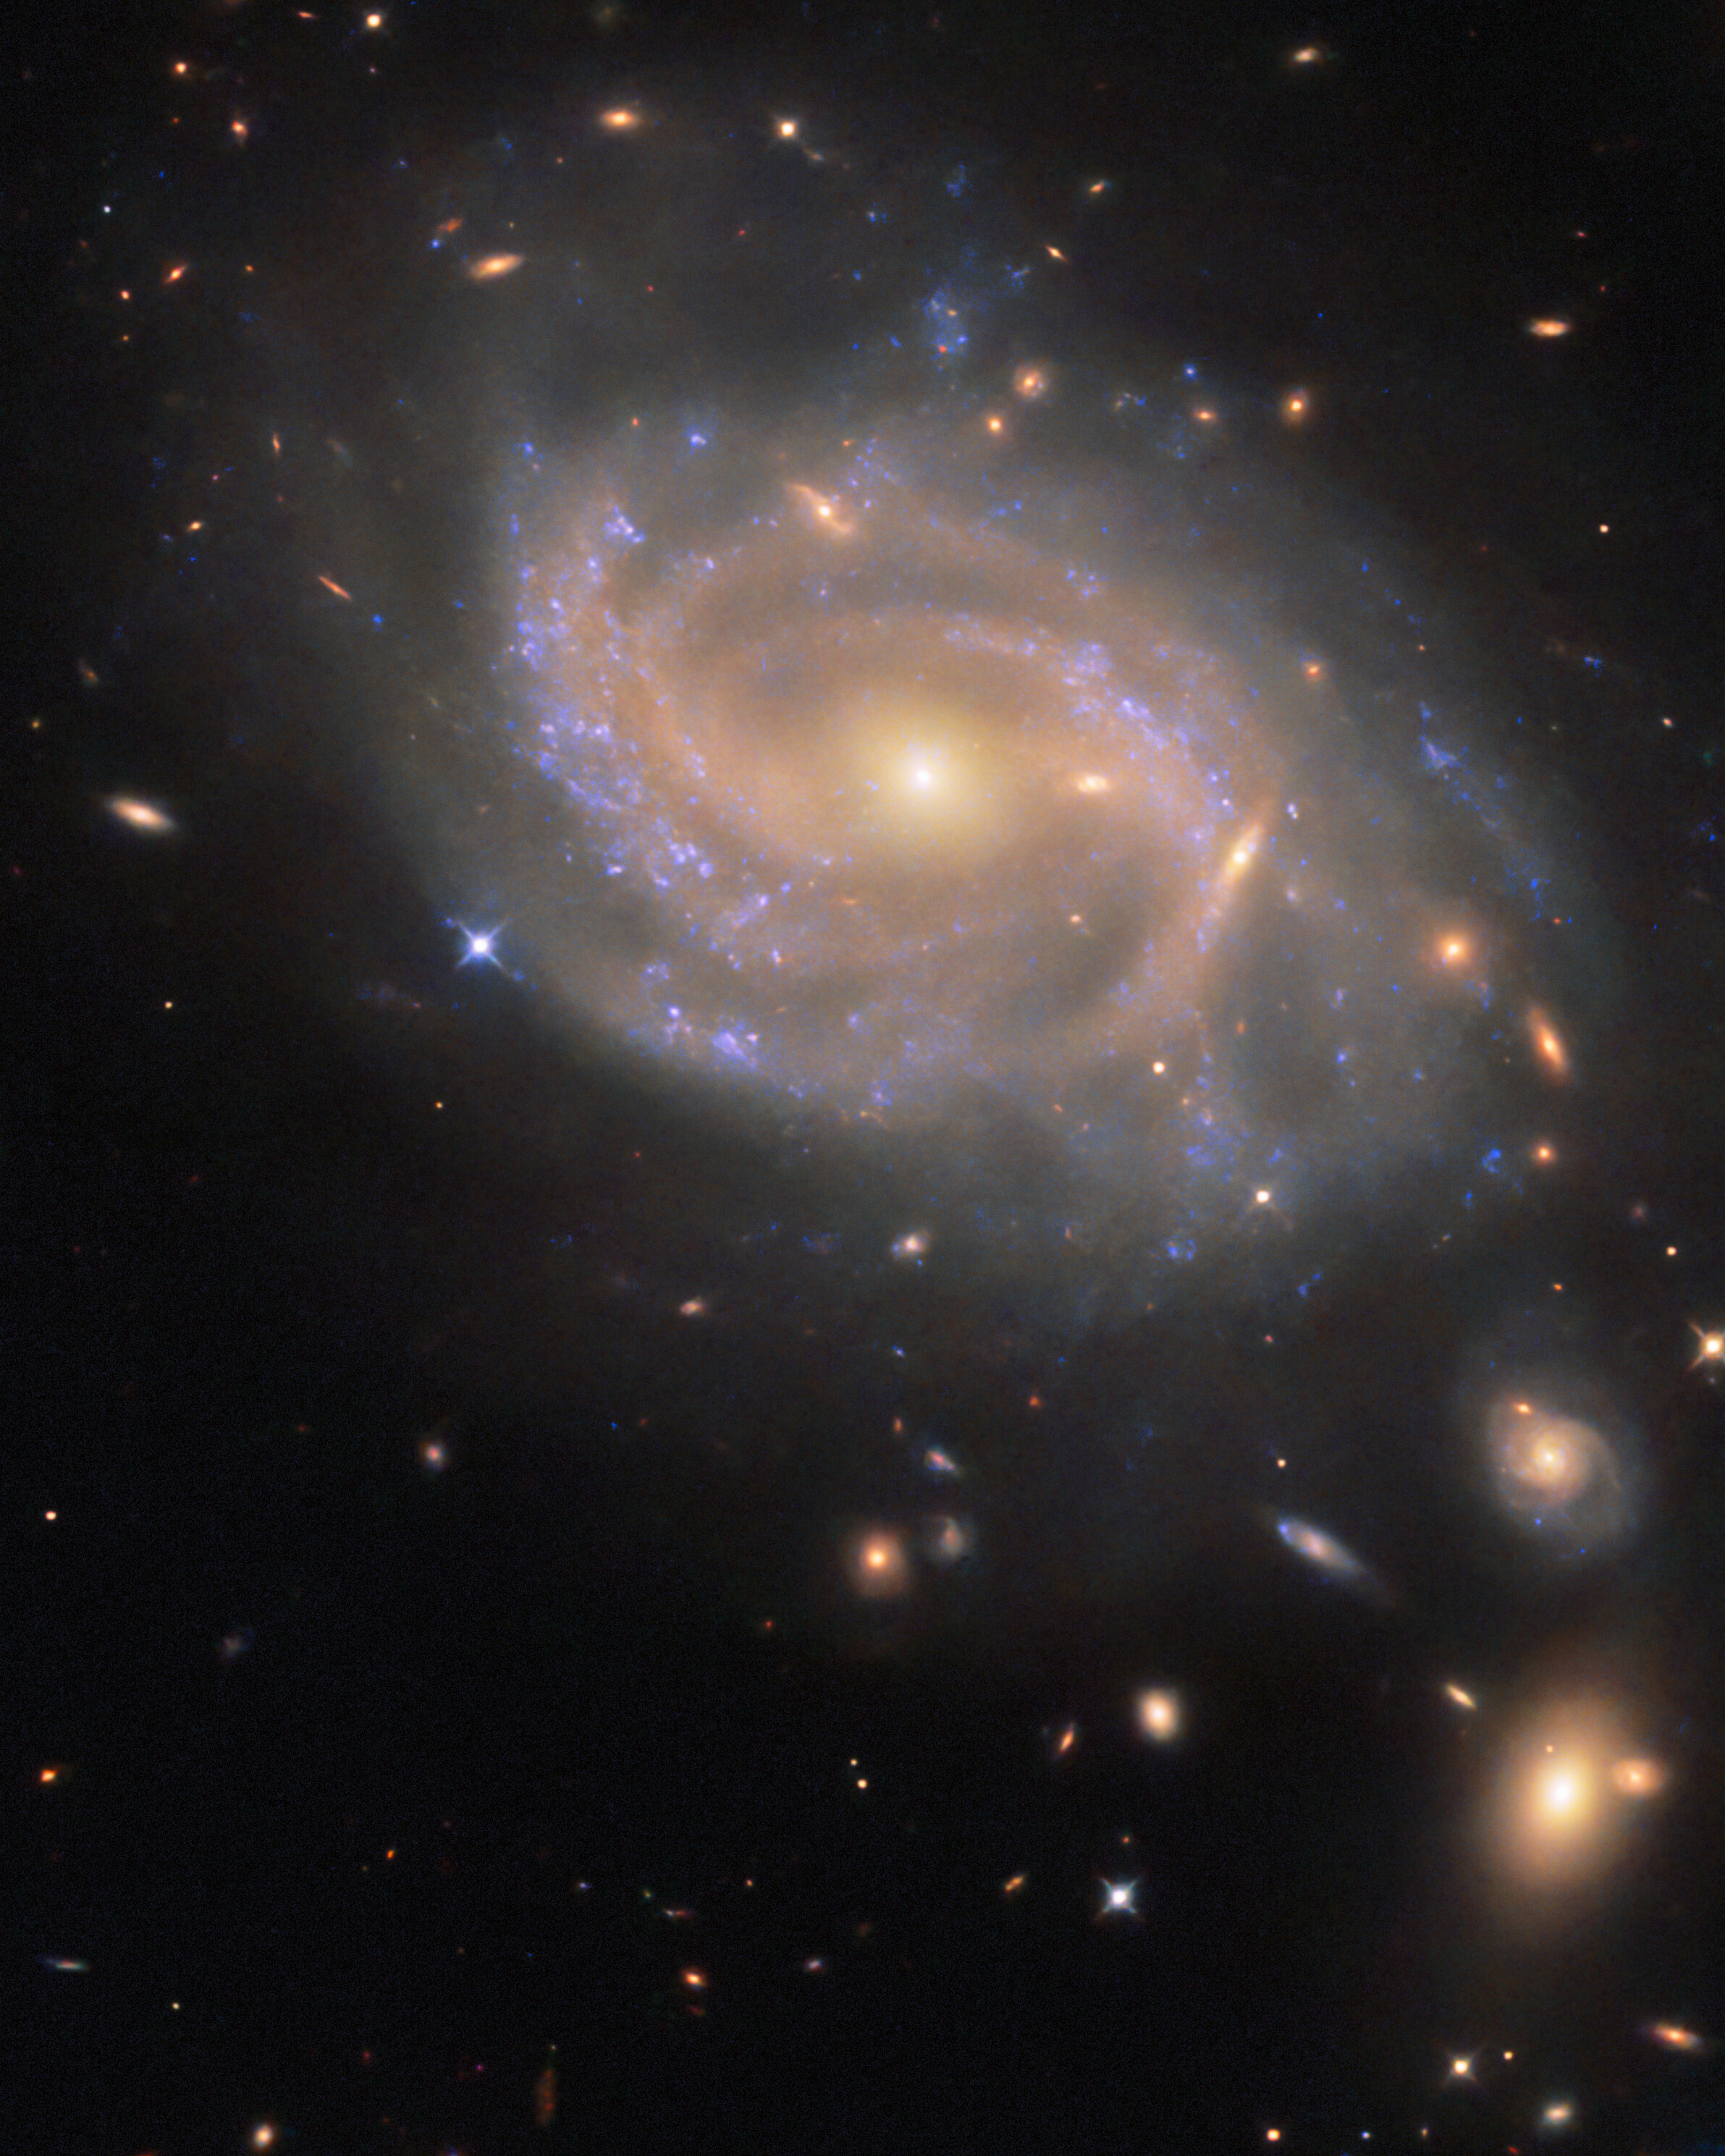
This collection of 36 images from NASA's Hubble Space Telescope features galaxies that are all hosts to both
Cepheid variables and supernovae. These two celestial phenomena are both crucial tools used by astronomers to determine astronomical distance, and have been used to refine our measurement of the Hubble constant, the expansion rate of the universe.

The galaxies shown in this photo (from top row, left to bottom row, right) are:


NGC 7541, NGC 3021, NGC 5643, NGC 3254, NGC 3147, NGC 105, NGC 2608, NGC 3583, NGC 3147, Mrk 1337, NGC 5861, NGC 2525, NGC 1015, UGC 9391, NGC 691, NGC 7678, NGC 2442, NGC 5468, NGC 5917, NGC 4639, NGC 3972, The Antennae Galaxies , NGC 5584, M106, NGC 7250, NGC 3370, NGC 5728, NGC 4424, NGC 1559, NGC 3982, NGC 1448, NGC 4680, M101, NGC 1365, NGC 7329, and NGC 3447. Credits: Science: NASA, ESA, Adam G. Riess (STScI, JHU)

Three Decades of Space Telescope Observations Converge on a Precise Value for the Hubble Constant

Science history will record that the search for the expansion rate of the universe was the great Holy Grail of 20th century cosmology. Without any observational evidence for space expanding, contracting, or standing still, we wouldn't have a clue to whether the universe was coming or going. What's more, we wouldn't have a clue about its age either – or in fact if the universe was eternal.

The first act of this revelation came when, a century ago, American astronomer Edwin Hubble discovered myriad galaxies outside of our home galaxy, the Milky Way. And, the galaxies weren't standing still. Hubble found that the farther a galaxy is, the faster it appears to be moving away from us. This could be interpreted as the uniform expansion of space. Hubble even said that he studied the galaxies simply as "markers of space." However he was never fully convinced of the idea of a uniformly expanding universe. He suspected his measurements might be evidence of something else more oddball going on in the universe.

For decades after Hubble, astronomers have toiled to nail down the expansion rate that would yield a true age for the universe. This required building a string of cosmic distance ladders assembled from sources that astronomers have a reasonable confidence in their intrinsic brightness. The brightest, and therefore farthest detectable milepost markers are Type Ia supernovae.

When the Hubble Space Telescope was launched in 1990 the universe's expansion rate was so uncertain that its age might only be 8 billion years or as great as 20 billion years.

After 30 years of meticulous work using the Hubble telescope's extraordinary observing power, numerous teams of astronomers have narrowed the expansion rate to a precision of just over 1%. This can be used to predict that the universe will double in size in 10 billion years.

The measurement is about eight times more precise than Hubble's expected capability. But it's become more than just refining a number to cosmologists. In the interim the mystery of dark energy pushing the universe apart was discovered. To compound things even further, the present expansion rate is different than it is expected to be as the universe appeared shortly after the big bang.

You think this would frustrate astronomers, but instead it opens the door to discovering new physics, and confronting unanticipated questions about the underlying workings of the universe. And, finally, reminding us that we have a lot more to learn among the stars.

Completing a nearly 30-year marathon, NASA's Hubble Space Telescope has calibrated more than 40 "milepost markers" of space and time to help scientists precisely measure the expansion rate of the universe — a quest with a plot twist.

Pursuit of the universe's expansion rate began in the 1920s with measurements by astronomers Edwin P. Hubble and Georges Lemaître. In 1998, this led to the discovery of "dark energy," a mysterious repulsive force accelerating the universe's expansion. In recent years, thanks to data from Hubble and other telescopes, astronomers found another twist: a discrepancy between the expansion rate as measured in the local universe compared to independent observations from right after the big bang, which predict a different expansion value.

The cause of this discrepancy remains a mystery. But Hubble data, encompassing a variety of cosmic objects that serve as distance markers, support the idea that something weird is going on, possibly involving brand new physics.

"You are getting the most precise measure of the expansion rate for the universe from the gold standard of telescopes and cosmic mile markers," said Nobel Laureate Adam Riess of the Space Telescope Science Institute (STScI) and the Johns Hopkins University in Baltimore, Maryland.

Riess leads a scientific collaboration investigating the universe's expansion rate called SHOES, which stands for Supernova, H0, for the Equation of State of Dark Energy. "This is what the Hubble Space Telescope was built to do, using the best techniques we know to do it. This is likely Hubble's magnum opus, because it would take another 30 years of Hubble's life to even double this sample size," Riess said.

Riess's team's paper , to be published in the Special Focus issue of The Astrophysical Journal reports on completing the biggest and likely last major update on the Hubble constant. The new results more than double the prior sample of cosmic distance markers. His team also reanalyzed all of the prior data, with the whole dataset now including over 1,000 Hubble orbits.

When NASA conceived of a large space telescope in the 1970s, one of the primary justifications for the expense and extraordinary technical effort was to be able to resolve Cepheids, stars that brighten and dim periodically, seen inside our Milky Way and external galaxies. Cepheids have long been the gold standard of cosmic mile markers since their utility was discovered by astronomer Henrietta Swan Leavitt in 1912. To calculate much greater distances, astronomers use exploding stars called Type Ia supernovae.

Combined, these objects built a "cosmic distance ladder" across the universe and are essential to measuring the expansion rate of the universe, called the Hubble constant after Edwin Hubble. That value is critical to estimating the age of the universe and provides a basic test of our understanding of the universe.

Starting right after Hubble's launch in 1990, the first set of observations of Cepheid stars to refine the Hubble constant was undertaken by two teams: the HST Key Project led by Wendy Freedman, Robert Kennicutt and Jeremy Mould, Marc Aaronson and another by Allan Sandage and collaborators, that used Cepheids as milepost markers to refine the distance measurement to nearby galaxies. By the early 2000s the teams declared "mission accomplished" by reaching an accuracy of 10 percent for the Hubble constant, 72 plus or minus 8 kilometers per second per megaparsec.

In 2005 and again in 2009, the addition of powerful new cameras onboard the Hubble telescope launched "Generation 2" of the Hubble constant research as teams set out to refine the value to an accuracy of just one percent. This was inaugurated by the SHOES program. Several teams of astronomers using Hubble, including SHOES, have converged on a Hubble constant value of 73 plus or minus 1 kilometer per second per megaparsec. While other approaches have been used to investigate the Hubble constant question, different teams have come up with values close to the same number.

The SHOES team includes long-time leaders Dr. Wenlong Yuan of Johns Hopkins University, Dr. Lucas Macri of Texas A&M University, Dr. Stefano Casertano of STScI and Dr. Dan Scolnic of Duke University. The project was designed to bracket the universe by matching the precision of the Hubble constant inferred from studying the cosmic microwave backgroundradiation leftover from the dawn of the universe. "The Hubble constant is a very special number. It can be used to thread a needle from the past to the present for an end-to-end test of our understanding of the universe. This took a phenomenal amount of detailed work," said Dr. Licia Verde, a cosmologist at ICREA and the ICC-University of Barcelona, speaking about the SHOES team's work.

The team measured 42 of the supernova milepost markers with Hubble. Because they are seen exploding at a rate of about one per year, Hubble has, for all practical purposes, logged as many supernovae as possible for measuring the universe's expansion. Riess said, "We have a complete sample of all the supernovae accessible to the Hubble telescope seen in the last 40 years." Like the lyrics from the song "Kansas City," from the Broadway musical Oklahoma, Hubble has "gone about as fur as it c'n go!"

Weird Physics?

The expansion rate of the universe was predicted to be slower than what Hubble actually sees. By combining the Standard Cosmological Model of the Universe and measurements by the European Space Agency's Planck mission (which observed the relic cosmic microwave background from 13.8 billion years ago), astronomers predict a lower value for the Hubble constant: 67.5 plus or minus 0.5 kilometers per second per megaparsec, compared to the SHOES team's estimate of 73.

Given the large Hubble sample size, there is only a one-in-a-million chance astronomers are wrong due to an unlucky draw, said Riess, a common threshold for taking a problem seriously in physics. This finding is untangling what was becoming a nice and tidy picture of the universe's dynamical evolution. Astronomers are at a loss for an explanation of the disconnect between the expansion rate of the local universe versus the primeval universe, but the answer might involve additional physics of the universe.

Such confounding findings have made life more exciting for cosmologists like Riess. Thirty years ago they started out to measure the Hubble constant to benchmark the universe, but now it has become something even more interesting. "Actually, I don't care what the expansion value is specifically, but I like to use it to learn about the universe," Riess added.

NASA's new Webb Space Telescope will extend on Hubble's work by showing these cosmic milepost markers at greater distances or sharper resolution than what Hubble can see.

The Hubble Space Telescope is a project of international cooperation between NASA and ESA (European Space Agency). NASA's Goddard Space Flight Center in Greenbelt, Maryland, manages the telescope. The Space Telescope Science Institute (STScI) in Baltimore, Maryland, conducts Hubble science operations. STScI is operated for NASA by the Association of Universities for Research in Astronomy in Washington, D.C.


Credits: Release: NASA, ESA, STScI

Media Contact:

Ray Villard
Space Telescope Science Institute, Baltimore, Maryland

Science Contact:

Adam G. Riess
Space Telescope Science Institute, Baltimore, Maryland
Johns Hopkins University, Baltimore, Maryland


Permissions: Content Use Policy

Related Links and Documents:


Friday, April 30, 2021

Black hole-neutron star collisions may settle dispute over Universe’s expansion

A black hole and star
Credit: iStock / Pitris

Studying the violent collisions of black holes and neutron stars may soon provide a new measurement of the Universe’s expansion rate, helping to resolve a long-standing dispute, suggests a new simulation study led by researchers at UCL. 

Our two current best ways of estimating the Universe’s rate of expansion – measuring the brightness and speed of pulsating and exploding stars, and looking at fluctuations in radiation from the early Universe – give very different answers, suggesting our theory of the Universe may be wrong.

A third type of measurement, looking at the explosions of light and ripples in the fabric of space caused by black hole-neutron star collisions, should help to resolve this disagreement and clarify whether our theory of the Universe needs rewriting.

The new study, published in Physical Review Letters, simulated 25,000 scenarios of black holes and neutron stars colliding, aiming to see how many would likely be detected by instruments on Earth in the mid- to late-2020s.

The researchers found that, by 2030, instruments on Earth could sense ripples in space-time caused by up to 3,000 such collisions, and that for around 100 of these events, telescopes would also see accompanying explosions of light.

They concluded that this would be enough data to provide a new, completely independent measurement of the Universe’s rate of expansion, precise and reliable enough to confirm or deny the need for new physics.

Lead author Dr Stephen Feeney (UCL Physics & Astronomy) said: “A neutron star is a dead star, created when a very large star explodes and then collapses, and it is incredibly dense – typically 10 miles across but with a mass up to twice that of our Sun. Its collision with a black hole is a cataclysmic event, causing ripples of space-time, known as gravitational waves, that we can now detect on Earth with observatories like LIGO and Virgo.

“We have not yet detected light from these collisions. But advances in the sensitivity of equipment detecting gravitational waves, together with new detectors in India and Japan, will lead to a huge leap forward in terms of how many of these types of events we can detect. It is incredibly exciting and should open up a new era for astrophysics.”

To calculate the Universe’s rate of expansion, known as the Hubble constant, astrophysicists need to know the distance of astronomical objects from Earth as well as the speed at which they are moving away. Analysing gravitational waves tells us how far away a collision is, leaving only the speed to be determined.

To tell how fast the galaxy hosting a collision is moving away, we look at the “redshift” of light – that is, how the wavelength of light produced by a source has been stretched by its motion. Explosions of light that may accompany these collisions would help us pinpoint the galaxy where the collision happened, allowing researchers to combine measurements of distance and measurements of redshift in that galaxy.

Dr Feeney said: “Computer models of these cataclysmic events are incomplete and this study should provide extra motivation to improve them. If our assumptions are correct, many of these collisions will not produce explosions that we can detect – the black hole will swallow the star without leaving a trace. But in some cases a smaller black hole may first rip apart a neutron star before swallowing it, potentially leaving matter outside the hole that emits electromagnetic radiation.”

Co-author Professor Hiranya Peiris (UCL Physics & Astronomy and Stockholm University) said: “The disagreement over the Hubble constant is one of the biggest mysteries in cosmology. In addition to helping us unravel this puzzle, the spacetime ripples from these cataclysmic events open a new window on the universe. We can anticipate many exciting discoveries in the coming decade.”

Gravitational waves are detected at two observatories in the United States (the LIGO Labs), one in Italy (Virgo), and one in Japan (KAGRA). A fifth observatory, LIGO-India, is now under construction.

Our two best current estimates of the Universe’s expansion are 67 kilometres per second per megaparsec (3.26 million light years) and 74 kilometres per second per megaparsec. The first is derived from analysing the cosmic microwave background, the radiation left over from the Big Bang, while the second comes from comparing stars at different distances from Earth – specifically Cepheids, which have variable brightness, and exploding stars called type Ia supernovae.

Dr Feeney explained: “As the microwave background measurement needs a complete theory of the Universe to be made but the stellar method does not, the disagreement offers tantalising evidence of new physics beyond our current understanding. Before we can make such claims, however, we need confirmation of the disagreement from completely independent observations – we believe these can be provided through black hole-neutron star collisions.”

The study was carried out by researchers at UCL, Imperial College London, Stockholm University and the University of Amsterdam. It was supported by the Royal Society, the Swedish Research Council (VR), the Knut and Alice Wallenberg Foundation, and the Netherlands Organisation for Scientific Research (NWO).

 Links:

Media Contacts:

Mark Greaves
T: +44 (0)7990 675947
E:
m.greaves@ucl.ac.uk

Source: UCL/News


Sunday, March 21, 2021

LCO Scientists Use Supernovae to Make a New Measurement of the Hubble Constant


SN 2011fe in the galaxy M101 is a Type Ia supernova, the type used as standard candles in this study.  This composite image was created from data taken by Las Cumbres Observatory and the Palomar Transient Factory.  Credit: BJ Fulton / LCO / PTF.

One of the longest standing and most controversial questions in astronomy is — how fast is the universe expanding today? New work, including measurements made by Las Cumbres Observatory, has applied new techniques to the problem and found a surprising answer.

Astronomers call the local expansion rate of the universe the Hubble constant, H0, (pronounced H-naught). Measurements have gotten extremely precise in recent years — some claim to have measured it to better than a few percent. Different groups have come up with results that vary by more than 10% — far larger than the claimed uncertainty. Complicating matters, the measurements seem to cluster high or low depending on where they are made in the universe. The Hubble constant measured from nearby supernovae tends to be high, while measurements built up from the afterglow of the Big Bang — the Cosmic Microwave Background — give a low value. Some have argued that this is a crisis for the field, one requiring “new physics.” Perhaps an unknown property of Dark Energy is causing the local expansion rate of the universe to be highly sensitive to the distance at which it is measured. Others argue that there must be some kind of mistake in building the “distance ladder” — in using one set of distance indicators to calibrate another.

The new study, released March 12 in the journal Astronomy & Astrophysics, involves an international team of scientists led by Nandita Khetan, a PhD student at the Gran Sasso Science Institute in Italy, and an associate researcher at the Istituto Nazionale di Fisica Nucleare. It used the Surface Brightness Fluctuations of galaxies to calibrate the distances to nature’s best distance indicators — Type Ia supernovae. Type Ia supernovae are used as “standard candles” to map out distances in the universe. They were used to determine that the universe was accelerating in its expansion, leading to the discovery of Dark Energy that resulted in the 2011 Nobel Prize in Physics.

The standard candle method relies on measuring the apparent brightness of a distant known light, say a 100W light bulb, and using the difference between the apparent and intrinsic brightness to work out how far away the light is. This requires knowing the intrinsic power output —the wattage — of the “standard candle,” something that is unknown for Type Ia supernovae. Astronomers have to calibrate their brightness using a handful of nearby supernovae in galaxies with distances determined by other means. Traditionally this has been done with galaxies whose distances are known from observations of Cepheid variable stars. The new paper research swaps out the Cepheids for a different fundamental calibrator, Surface Brightness Fluctuations. This measures the resolution of individual stars in different galaxies, since stars tend to blur together the farther away a galaxy is. It is similar to how a street will appear rough when photographed up close, but smooth when seen from farther away.

The new study found an answer that is in between the two discordant values of the expansion rate of the universe. This argues that perhaps new physics isn’t needed after all. It may be that previous researchers overestimated the precision of their studies.

Andy Howell, a staff scientist at Las Cumbres Observatory, and adjunct faculty at the University of California Santa Barbara, is the Principal Investigator of the Global Supernova Project, a worldwide collaboration that provided some of the observations of supernovae used in the study. He explains, “At a recent conference about this Hubble Constant crisis, after each speaker walked through their methodology, I couldn’t find any problems with what they were doing. I started to question whether we do need new physics to explain the different Hubble constants. But now we, like several studies before ours, found an answer in the middle. Maybe there’s some weirdness to some of the other measurements that we don’t fully understand. That’s more comforting, because you don’t want to upend our understanding of physics unless you have to.”

The new work does not undermine the discovery or characterization of Dark Energy, since that relies on only relative, not absolute, measurements of supernovae and has been verified by other means.

The new supernova observations were obtained with Las Cumbres Observatory’s worldwide network of robotic telescopes, specifically designed to study time-variable phenomena like supernovae. Howell adds, “Supernovae are hard to observe, because you need just a little bit of telescope time per night, over months. But a robotic telescope network is perfect for this — nobody has to travel — the telescopes can make the observations wherever and whenever they are needed. This is what we built Las Cumbres Observatory for and I’m delighted to see it being used to refine our understanding of the universe.”

The study “A new measurement of the Hubble constant using Type Ia supernovae calibrated with surface brightness fluctuations” involves an international team of scientists with expertise in supernova observations, Surface Brightness Fluctuations, and theory working, at the Gran Sasso Science Institute, INAF, INFN, DARK-Niels Bohr Institute, University of Copenhagen, Centre for Astrophysics and Supercomputing, Swinburne University, Las Cumbres Observatory, UC Santa Barbara, and UC Davis.

Source:  Las Cumbres Observatory (LCO)/News


Saturday, December 07, 2019

Scientists Reveal Potential New Class of X-ray Star System Research

The large donor star has a tear-drop shape because it is filling its Roche lobe, donating mass to two compact stars in a tight binary that correspond to a pair of neutron stars or black holes. If the mass-gaining binary were simply a single star, mass would flow steadily through one point, the L1 point. Because the mass gainer is a binary, we see interesting patterns of mass flow, executing a complex dance. Credit: Sophie Schroeder, Niels Bohr Institute, and Morgan Macleod, Institute for Theory and Computation at CfA. animation.mp4

Cambridge, MA - A scientist at the Center for Astrophysics | Harvard & Smithsonian has announced the discovery that mass in triple star systems takes on the characteristics of recipient stars before mass is actually transferred, which may allow scientists to re-examine previously labeled binary star systems for evidence of a third companion.

"Scientists already knew that the transfer of mass from one star to another is one of the most important processes in astronomy, because it produces events that release tremendous amounts of energy -- from Type Ia supernovae to the merger of black holes. I wanted to extend this to understand what happens if one star transfers mass to a pair of stars," said Rosanne Di Stefano, astronomer at CfA. "To do that I had to generalize the familiar process of star-to-star mass flow."

Di Stefano suggests that the flow of mass is similar to the flow of water through a faucet. "The mass-giving star takes on a tear-drop shape, filling its 'Roche Lobe' and transferring mass through a small region called the L1 point," said Di Stefano. "The Roche Lobe and the L1 point provide a mathematical basis for computing exactly what happens to transferred mass in a binary where both gravity and rotation influence the flow of matter."

While the base of knowledge for binary star systems is broad and growing, our understanding of mass transfer in triple-star systems is more limited. Astronomical observations have established that triple-star systems are common, and even dominant amongst the population of known high-mass stars.

"In triple-star systems, instead of a fixed position with respect to the rotating stars, like we see in binary systems, the L1 point executes an orbit over a three-dimensional surface, and the shape of the Roche Lobe pulsates in a periodic fashion,” said Di Stefano. "This means that mass is pulled away from the donor star with its motion already imprinted with the periodicity of the inner binary, even though it has yet to travel to that binary, and the visual outcome looks much like an elegant, yet explosive Pas de trois."

Followup revealed that the pulsation also had the effect of increasing the rate of mass flow, with a stunning outcome for discerning observers. "If the inner binary consists of stellar remnants, the high rate of mass flow can make these systems among the brightest X-ray sources in galactic populations. This suggests that X-ray astronomers may be able to identify mass-transfer triples," said Di Stefano. “But what’s really exciting is that this new ability to identify triples in X-ray may allow us to discover that some systems previously thought to be X-ray binaries are actually a new class of star system: an X-ray triple with mass transfer from the outer star to an inner binary."

Di Stefano's work is published in the Monthly Notices of the Royal Astronomical Society, and is accompanied by a dynamical simulation by Sophie Schroeder, Niels Bohr Institute, and Morgan Macleod, Institute for Theory and Computation at CfA.


About Center for Astrophysics | Harvard & Smithsonian


Headquartered in Cambridge, Mass., the Center for Astrophysics | Harvard & Smithsonian (CfA) is a collaboration between the Smithsonian Astrophysical Observatory and the Harvard College Observatory. CfA scientists, organized into six research divisions, study the origin, evolution and ultimate fate of the universe.


Media Contact:

Amy Oliver, Public Affairs
Center for Astrophysics | Harvard & Smithsonian
Fred Lawrence Whipple Observatory
amy.oliver@cfa.harvard.edu


Monday, November 04, 2019

Ancient gas cloud shows that the first stars must have formed very quickly

Astronomers found a pristine gas cloud in the proximity of one of the most distant quasars known, seen just 850 million after the Big Bang (1/14th of the universe's current age). The gas cloud absorbs some of the light from the background quasar, leaving signatures that allow astronomers to study its chemical composition. This is the most distant gas cloud for which astronomers have been able to measure a metallicity to date. This system has one of the smallest amount of metals ever identified in a gas cloud but the ratio of its chemical elements are still similar to what observed in more evolved systems. © graphics department.

Astronomers led by Eduardo Bañados of the Max Planck Institute for Astronomy have discovered a gas cloud that contains information about an early phase of galaxy and star formation, merely 850 million years after the Big Bang. The cloud was found serendipitously during observations of a distant quasar, and it has the properties that astronomers expect from the precursors of modern-day dwarf galaxies. When it comes to relative abundances, the cloud's chemistry is surprisingly modern, showing that the first stars in the universe must have formed very quickly after the Big Bang. The results have been published in the Astrophysical Journal.

When astronomers look at distant objects, they necessarily look back in time. The gas cloud discovered by Bañados et al. is so distant that its light has taken nearly 13 billion years to reach us; conversely, the light reaching us now tells us how the gas cloud looked nearly 13 billion years ago, no more than about 850 million years after the Big Bang. For astronomers, this is an extremely interesting epoch. Within the first several hundred million years after the Big Bang, the first stars and galaxies formed, but the details of that complex evolution are still largely unknown.

This very distant gas cloud was a fortuitous discovery. Bañados, then at the Carnegie Institution for Science, and his colleagues were following up on several quasars from a survey of 15 of the most distant quasars known (z³6.5), which had been prepared by Chiara Mazzucchelli as part of her PhD research at the Max Planck Institute for Astronomy. At first, the researchers just noted that the quasar P183+05 had a rather unusual spectrum. But when Bañados analyzed a more detailed spectrum, obtained with the Magellan Telescopes at Las Campanas Observatory in Chile, he recognized that there was something else going on: The weird spectral features were the traces of a gas cloud that was very close to the distant quasar – one of the most distant gas clouds astronomers have yet been able to identify.

Lit up by a distant quasar

Quasars are the extremely bright active nuclei of distant galaxies. The driving force behind their luminosity is the galaxy’s central supermassive black hole. Matter swirling around that black hole (before falling in) heats up to temperatures reaching hundreds of thousands of degrees, giving off enormous amounts of radiation. This allows astronomers to use quasars as background sources to detect hydrogen and other chemical elements in absorption: If a gas cloud is directly between the observer and a distant quasar, some of the quasar’s light will be absorbed.

Astronomers can detect this absorption by studying the quasar’s spectrum, that is, the rainbow-like decomposition of the quasar’s light into the different wavelength regions. The absorption pattern contains information about the gas cloud’s chemical composition, temperature, density and even about the cloud’s distance from us (and from the quasar). Behind this is the fact that each chemical element has a “fingerprint” of spectral lines – narrow wavelengths region in which that element’s atoms can emit or absorb light particularly well. The presence of a characteristic fingerprint reveals the presence and abundance of a specific chemical element.

Not quite the cloud they were looking for

From the spectrum of the gas cloud, the researchers could immediately tell the distance of the cloud, and that they were looking back into the first billion years of cosmic history. They also found traces of several chemical elements including carbon, oxygen, iron, and magnesium. However, the amount of these elements was tiny, about 1/800 times the abundance in the atmosphere of our sun. Astronomers summarily call all elements heavier than helium “metals;” this measurement makes the gas cloud one of the most metal-poor (and distant) systems known in the universe. Michael Rauch from the Carnegie Institution of Science, who is co-author of the new study, says: "After we were convinced that were were looking at such pristine gas only 850 million years after the Big Bang we started wondering whether this system could still retain chemical signatures produced by the very first generation of stars."

Finding these first generation, so-called “population III” stars is one of the most important goals in reconstructing the history of the universe. In the later universe, chemical elements heavier than hydrogen play an important role in letting gas clouds collapse to form stars. But those chemical elements, notably carbon, are themselves produced in stars, and flung into space in supernova explosions. For the first stars, those chemical facilitators would simply not have been there, since directly after the Big Bang phase, there were only hydrogen and helium atoms. That is what makes the first stars fundamentally different from all later stars.

The analysis showed that the cloud’s chemical make-up was not chemically primitive, but instead the relative abundances were surprisingly similar to the chemical abundances observed in today’s intergalactic gas clouds. The ratios of the abundances of heavier elements were very close to the ratios in the modern universe. The fact that this gas cloud in the very early universe already contains metals with modern relative chemical abundances poses key challenges for the formation of the first generation of stars.

So many stars, so little time

This study implies that the formation of the first stars in this system must have begun much earlier: the chemical yields expected from the first stars had already been erased by the explosions of at least one more generation of stars. A particular time constraint comes from supernovae of type Ia, cosmic explosions that would be required to produce metals with the observed relative abundances. Such supernovae typically need about 1 billion years to happen, which puts a serious constraint on any scenarios of how the first stars formed.

Now that the astronomers have found this very early cloud, they are systematically looking for additional examples. Eduardo Bañados says: “It is exciting that we can measure metallicity and chemical abundances so early in the history of the universe, but if we want to identify the signatures of the first stars we need to probe even earlier in cosmic history. I am optimistic that we will find even more distant gas clouds, which could help us understand how the first stars were born.”

Background information

The results described here have been published in Bañados et al., “A metal–poor damped Lyαsystem at redshift 6.4,” in the Astrophysical Journal.

The MPIA researchers involved are Eduardo Bañados (also Carnegie Institution for Science), Emanuele Farina and Joe Hennawi (both also UCSB), Bram P. Venemans, and Fabian Walter (also NRAO), in collaboration with Michael Rauch (Carnegie Institution for Science), Roberto Decarli (INAF Bologna), Chiara Mazzucchelli (ESO), Robert A. Simcoe (MIT-Kavli Center for Astrophysics and Space Research), J. Xavier Prochaska (UCSC), Thomas Cooper (Carnegie Institution for Science), Frederick B. Davies (UCSB) and Shi-Fan S. Chen (MIT-Kavli Center for Astrophysics and Space Research and UC Berkeley)

e-print of the article  


Contact

Eduardo Banados Torres
Phone: +49 6221 528-461
Email: banados@mpia.de
Room: 329
Links: Personal homepage

Markus Pössel
Public Information Officer
Phone:+49 6221 528-261
Email: pr@mpia.de


Monday, October 07, 2019

Scientists Observe Year-long Plateaus in Decline of Type Ia Supernova Light Curves

Hubble Space Telescope color composite of SN2013dy within its host galaxy.
Credit: HST, Adam Riess, Or Graur

Hubble Space Telescope color composite of SN2018gv within its host galaxy.
Credit: HST, Adam Riess, Or Graur

Cambridge, MA - Scientists at the Center for Astrophysics | Harvard & Smithsonian have announced the discovery that, contrary to previously accepted knowledge, Type Ia supernovae experience light curve decline plateaus, and lengthy ones at that, lasting up to a year.

CfA scientist Or Graur first noticed strange light curve behaviors while studying late-time Type Ia supernovae in 2015, and this year confirmed light curve plateaus in Type Ia supernovae. "Most supernova research is conducted in the weeks or months immediately following an explosion, but we wanted to see how light curves behave at late times, around 500 to 1000 days after explosion," said Graur. "Optical observations of SN2012gc in 2015 revealed a slowdown in the light curve as expected, but as we studied additional supernovae over time, it became apparent that other mechanisms were at play, so we started looking for patterns to explain what was going on."

To better understand the strange behavior, Graur teamed up with Adam Riess of The Johns Hopkins University and the Space Telescope Science Institute, and 2011 winner of the Nobel Prize in Physics, to study nearby supernovae using Riess's already-set HST programs. "Even though these were all nearby supernovae, at these late times they were very faint. We needed Hubble's resolving power to be able to tell them apart from other stars in their respective galaxies," said Graur. "But what made the difference to our observations was that Adam's programs on Hubble also had near-infrared data in the H-band. What started as a fishing expedition revealed a portion of time where the light curve is flat, and that period lasts for up to a year. That was a surprise. I didn't expect to see that."

The idea of supernova light curve plateaus is not new to cosmology. Type IIP supernovae, which are born of the collapse and explosion of hydrogen-rich red super giants, commonly experience light curve plateaus roughly 100 days in length. Until the discovery of the Type Ia supernova light curve plateau, 100 days was considered a long-period plateau. Type Ia supernova light curve plateaus begin at between 150 and 500 days after explosion, and last approximately 350 days, or nearly a year.

"Up until this moment, the only plateaus seen in any type of supernova were in Type IIP, and they were relatively short compared to what we're seeing in our observations. This is only the second time we've ever seen a plateau like this in a supernova," said Graur. "What we’re seeing is in stark contrast to what we’ve always believed about Type Ia supernovae and it's going to impact the way we apply Type Ia light curves to cosmological models in the future."

The results of the study are published in Nature Astronomy. In addition to Graur—who also serves as a Research Associate at the American Museum of Natural History—and Riess, the study involved CfA scientist Arturo Avelino along with scientists Kate Maguire, Trinity College Dublin; Russell Ryan, Space Telescope Science Institute; Matt Nicholl, University of Edinburgh; Luke Shingles, Queens University Belfast; Ivo R. Seitenzahl, University of New South Wales Canberra; and, Robert Fisher, University of Massachusetts Dartmouth.

About Center for Astrophysics | Harvard & Smithsonian

Headquartered in Cambridge, Mass., the Center for Astrophysics | Harvard & Smithsonian (CfA) is a collaboration between the Smithsonian Astrophysical Observatory and the Harvard College Observatory. CfA scientists, organized into six research divisions, study the origin, evolution and ultimate fate of the universe.

For more information, contact:

Amy Oliver, Public Affairs
Fred Lawrence Whipple Observatory
Center for Astrophysics | Harvard & Smithsonian
+1 520-879-4406
amy.oliver@cfa.harvard.edu


Saturday, December 01, 2018

Kepler’s Supernova Experiment Captures First Moments of a Dying Star

The above animation shows the scenario leading to a particular kind of Type Ia supernova in which a single white dwarf siphons off so much material from its companion star that it can no longer sustain its own weight and blows up. It is one theory explaining the data from SN 2018oh.Image Credit: NASA/JPL-Caltech. Release image

In a galaxy far away, an old star exploded and became a supernova. About 170 million years later on Feb. 4, 2018, the light emanating from the explosion was received by an arsenal of high-powered telescopes.

NASA’s Kepler space telescope detected the unfurling light of SN 2018oh, as it has been labeled. The first ground-based facility to identify the signal was with the All-Sky Automated Survey for Supernova and soon observatories around the globe were monitoring the supernova as part of a unique scientific experiment designed to help solve the mystery of how stars explode.

NASA retired the Kepler space telescope on October 30, following the exhaustion of fuel supplies after nine and a half years of ground-breaking operations. But from December to May, while there was still fuel left, the Kepler team oriented the spacecraft toward two distinct patches of sky that were simultaneously observable from Earth by ground-based observatories. The telescopes were able to view both patches of sky teeming with galaxies. Each of these thousands of galaxies has billions of stars.

While the telescopes watched, a few of those stars ended their long lives in dramatic explosions. With its unique capabilities, Kepler observed the minute changes in brightness of these explosions from their very beginnings while the ground-based telescopes tracked changes in color and the atomic composition of these dying stars.

With the combined data from these telescopes, astronomers achieved what they had hoped for — an unprecedented observation of the onset of a supernova. Three research papers by 130 scientists attempt to explain the unusual data revealed in the details of SN 2018oh, which was caught in the spiral galaxy UGC 4780 in the Cancer constellation. One of the papers has been accepted for publication in The Astrophysical Journal Letters, while the other two have been accepted to The Astrophysical Journal.

A hot, bright burn

SN 2018oh is an example of a Type Ia supernova — the kind that astronomers use to track the expansion of the universe and probe the nature of the invisible “dark energy” that glues together the cosmos.

A typical Type Ia supernova brightens over the course of three weeks before gradually fading away. But Kepler observed this particular supernova brightening rapidly a few days after the initial explosion — about three times faster than a typical supernova at this time period — before reaching peak brightness. Meanwhile, color details obtained by the Dark Energy Camera at Cerro Tololo Inter-American Observatory in Chile, and the Panoramic Survey Telescope and Rapid Response System at Haleakala Observatory in Hawaii, showed this supernova gleaming blue during this period of intensity, an indication of high temperatures.

For nearly a decade, scientists have been in search of a signal of a supernova similar to this one. Because Kepler was already staring at this patch of sky before the supernova went off, it was able to detect its early signals and measure it continuously for weeks.

The scenarios giving rise to Type Ia supernovae have been long-debated. So far, most evidence points to the merging of two white dwarfs, the compact corpses of stars, as the source of these explosions. Yet theoretical models have held out the possibility of an alternative scenario, in which a single degenerate white dwarf siphons off so much material from its companion star that it can no longer sustain its own weight and blows up.

Some of the scientists examining SN 2018oh’s peculiar data believe it is a compelling example of this alternative scenario. They explain that the shock wave from the exploding white dwarf ran into the companion star, creating an extremely hot and bright gaseous material that accounts for the added brightness and heat observed.

Another group of scientists favor a different mechanism to explain the excess flux of light and temperature. Type Ia supernovae produce radioactive nickel during the explosion. The radioactive decay of this heavy metal produces much of the light we see from Type Ia supernovae. If a large amount of nickel was located in the outer layers of the exploding material it would produce the observed early bump in the light.

Refining the models

If the single degenerate white dwarf theory holds true for SN 2018oh, the next step is to figure out the frequency of this kind of Type Ia supernova. If, however, the theory of nickel in the outer layers prevails, we will glean details about the inner workings of supernova explosions. Either way, understanding the details of Type Ia supernovae are important for refining the models used in cosmology to estimate the expansion rate of the universe.

The team of astronomers detected more than 40 supernova candidates during this experiment with Kepler, including several others that are also proving scientifically interesting. Though Kepler’s fuel has run out and cannot be replaced, the data it has collected on supernovae, exoplanets and other astronomical phenomena will be studied for many years to come.

The authors of these papers include scientists from dozens of institutions, including members of the Kepler team. Additional observatories providing valuable data to support the experiment include Las Cumbres Observatory, a global network of robotic telescopes based in Goleta, California; Tsinghua-NAOC and Lijiang Telescopes in China; Konkoly Observatory in Hungary; Lick Observatory on Mount Hamilton in California; Las Campanas Observatory in Chile, and others.

NASA's Ames Research Center in California’s Silicon Valley manages the Kepler and K2 missions for NASA’s Science Mission Directorate. NASA's Jet Propulsion Laboratory in Pasadena, California, managed Kepler mission development. Ball Aerospace & Technologies Corporation operates the flight system with support from the Laboratory for Atmospheric and Space Physics at the University of Colorado in Boulder.

The above animation shows the scenario leading to a particular kind of Type Ia supernova in which a single white dwarf siphons off so much material from its companion star that it can no longer sustain its own weight and blows up. It is one theory explaining the data from SN 2018oh. Image Credit: NASA/JPL-Caltech

Editor: Rick Chen