Sunday, May 12, 2024

NASA, JAXA XRISM Spots Iron Fingerprints in Nearby Active Galaxy

The Resolve instrument aboard XRISM (X-ray Imaging and Spectroscopy Mission) captured data from the center of galaxy NGC 4151, where a supermassive black hole is slowly consuming material from the surrounding accretion disk. The resulting spectrum reveals the presence of iron in the peak around 6.5 keV and the dips around 7 keV, light thousands of times more energetic that what our eyes can see. Background: An image of NGC 4151 constructed from a combination of X-ray, optical, and radio light. Spectrum: JAXA/NASA/XRISM Resolve. Background: X-rays, NASA/CXC/CfA/J.Wang et al.; optical, Isaac Newton Group of Telescopes, La Palma/Jacobus Kapteyn Telescope; radio, NSF/NRAO/VLA

After starting science operations in February, Japan-led XRISM (X-ray Imaging and Spectroscopy Mission) studied the monster black hole at the center of galaxy NGC 4151.

“XRISM’s Resolve instrument captured a detailed spectrum of the area around the black hole,” said Brian Williams, NASA’s project scientist for the mission at the agency’s Goddard Space Flight Center in Greenbelt, Maryland. “The peaks and dips are like chemical fingerprints that can tell us what elements are present and reveal clues about the fate of matter as it nears the black hole.”

XRISM (pronounced “crism”) is led by JAXA (Japan Aerospace Exploration Agency) in collaboration with NASA, along with contributions from ESA (European Space Agency). It launched Sept. 6, 2023. NASA and JAXA developed Resolve, the mission’s microcalorimeter spectrometer.

NGC 4151 is a spiral galaxy around 43 million light-years away in the northern constellation Canes Venatici. The supermassive black hole at its center holds more than 20 million times the Sun’s mass.

The galaxy is also active, which means its center is unusually bright and variable. Gas and dust swirling toward the black hole form an accretion disk around it and heat up through gravitational and frictional forces, creating the variability. Some of the matter on the brink of the black hole forms twin jets of particles that blast out from each side of the disk at nearly the speed of light. A puffy donut-shaped cloud of material called a torus surrounds the accretion disk.

In fact, NGC 4151 is one of the closest-known active galaxies. Other missions, including NASA’s Chandra X-ray Observatory and Hubble Space Telescope, have studied it to learn more about the interaction between black holes and their surroundings, which can tell scientists how supermassive black holes in galactic centers grow over cosmic time.

This artist’s concept shows the possible locations of iron revealed in XRISM’s X-ray spectrum of NGC 4151. Scientists think X-ray-emitting iron is in the hot accretion disk, close to the black hole. The X-ray-absorbing iron may be further away, in a cooler cloud of material called a torus. NASA's Goddard Space Flight Center Conceptual Image Lab.

The galaxy is uncommonly bright in X-rays, which made it an ideal early target for XRISM.

Resolve’s spectrum of NGC 4151 reveals a sharp peak at energies just under 6.5 keV (kiloelectron volts) — an emission line of iron. Astronomers think that much of the power of active galaxies comes from X-rays originating in hot, flaring regions close to the black hole. X-rays bouncing off cooler gas in the disk causes iron there to fluoresce, producing a specific X-ray peak. This allows astronomers to paint a better picture of both the disk and erupting regions much closer to the black hole.

The spectrum also shows several dips around 7 keV. Iron located in the torus caused these dips as well, although through absorption of X-rays, rather than emission, because the material there is much cooler than in the disk. All this radiation is some 2,500 times more energetic than the light we can see with our eyes.

Iron is just one element XRISM can detect. The telescope can also spot sulfur, calcium, argon, and others, depending on the source. Each tells astrophysicists something different about the cosmic phenomena scattered across the X-ray sky.

XRISM is a collaborative mission between JAXA and NASA, with participation by ESA. NASA’s contribution includes science participation from CSA (Canadian Space Agency).

Download high-resolution images on NASA's Scientific Visualization Studio

By Jeanette Kazmierczak
NASA’s Goddard Space Flight Center, Greenbelt, Md.


Media Contact:

Claire Andreoli
301-286-1940

claire.andreoli@nasa.gov
NASA’s Goddard Space Flight Center, Greenbelt, Md.


Saturday, May 11, 2024

NASA's Webb Hints at Possible Atmosphere Surrounding Rocky Exoplanet

Super-Earth Exoplanet 55 Cancri e (Artist’s Concept)
Credits: Illustration: NASA, ESA, CSA, Ralf Crawford (STScI)

Super-Earth Exoplanet 55 Cancri e (MIRI Secondary Eclipse Light Curve)
Credits: Illustration: NASA, ESA, CSA, Joseph Olmsted (STScI)
Science: Aaron Bello-Arufe (NASA-JPL)

Super-Earth Exoplanet 55 Cancri e (NIRCam + MIRI Emission Spectrum)
Credits: Illustration: NASA, ESA, CSA, Joseph Olmsted (STScI)
Science: Renyu Hu (NASA-JPL), Aaron Bello-Arufe (NASA-JPL), Michael Zhang (University of Chicago), Mantas Zilinskas (SRON)


Researchers using NASA’s James Webb Space Telescope may have detected atmospheric gases surrounding 55 Cancri e, a hot rocky exoplanet 41 light-years from Earth. This is the best evidence to date for the existence of any rocky planet atmosphere outside our solar system.

Renyu Hu from NASA’s Jet Propulsion Laboratory (JPL) in Pasadena, California, is lead author on a paper published today in Nature. “Webb is pushing the frontiers of exoplanet characterization to rocky planets,” Hu said. “It is truly enabling a new type of science.”

Super-Hot Super-Earth 55 Cancri e

55 Cancri e, also known as Janssen, is one of five known planets orbiting the Sun-like star 55 Cancri, in the constellation Cancer. With a diameter nearly twice that of Earth and density slightly greater, the planet is classified as a super-Earth: larger than Earth, smaller than Neptune, and likely similar in composition to the rocky planets in our solar system.

To describe 55 Cancri e as “rocky,” however, could leave the wrong impression. The planet orbits so close to its star (about 1.4 million miles, or one-twenty-fifth the distance between Mercury and the Sun) that its surface is likely to be molten – a bubbling ocean of magma. With such a tight orbit, the planet is also likely to be tidally locked, with a dayside that faces the star at all times and a nightside in perpetual darkness.

In spite of numerous observations since it was discovered to transit in 2011, the question of whether or not 55 Cancri e has an atmosphere – or even could have one given its high temperature and the continuous onslaught of stellar radiation and wind from its star – has gone unanswered.

“I’ve worked on this planet for more than a decade,” said Diana Dragomir, an exoplanet researcher at the University of New Mexico and co-author on the study. “It’s been really frustrating that none of the observations we’ve been getting have robustly solved these mysteries. I am thrilled that we're finally getting some answers!”

Unlike the atmospheres of gas giant planets, which are relatively easy to spot (the first was detected by NASA’s Hubble Space Telescope more than two decades ago), thinner and denser atmospheres surrounding rocky planets have remained elusive.

Previous studies of 55 Cancri e using data from NASA’s now-retired Spitzer Space Telescope suggested the presence of a substantial atmosphere rich in volatiles (molecules that occur in gas form on Earth) like oxygen, nitrogen, and carbon dioxide. But researchers could not rule out another possibility: that the planet is bare, save for a tenuous shroud of vaporized rock, rich in elements like silicon, iron, aluminum, and calcium. “The planet is so hot that some of the molten rock should evaporate,” explained Hu.

Measuring Subtle Variations in Infrared Colors

To distinguish between the two possibilities, the team used Webb’s NIRCam (Near-Infrared Camera) and MIRI (Mid-Infrared Instrument) to measure 4- to 12-micron infrared light coming from the planet.

Although Webb cannot capture a direct image of 55 Cancri e, it can measure subtle changes in light from the system as the planet orbits the star.

By subtracting the brightness during the secondary eclipse, when the planet is behind the star (starlight only), from the brightness when the planet is right beside the star (light from the star and planet combined), the team was able to calculate the amount of various wavelengths of infrared light coming from the dayside of the planet.

This method, known as secondary eclipse spectroscopy, is similar to that used by other research teams to search for atmospheres on other rocky exoplanets, like TRAPPIST-1 b.

Cooler than Expected

The first indication that 55 Cancri e could have a substantial atmosphere came from temperature measurements based on its thermal emission, or heat energy given off in the form of infrared light. If the planet is covered in dark molten rock with a thin veil of vaporized rock or no atmosphere at all, the dayside should be around 4,000 degrees Fahrenheit (~2,200 degrees Celsius).

“Instead, the MIRI data showed a relatively low temperature of about 2,800 degrees Fahrenheit [~1540 degrees Celsius],” said Hu. “This is a very strong indication that energy is being distributed from the dayside to the nightside, most likely by a volatile-rich atmosphere.” While currents of lava can carry some heat around to the nightside, they cannot move it efficiently enough to explain the cooling effect.

When the team looked at the NIRCam data, they saw patterns consistent with a volatile-rich atmosphere. “We see evidence of a dip in the spectrum between 4 and 5 microns — less of this light is reaching the telescope,” explained co-author Aaron Bello-Arufe, also from NASA JPL. “This suggests the presence of an atmosphere containing carbon monoxide or carbon dioxide, which absorb these wavelengths of light.” A planet with no atmosphere or an atmosphere consisting only of vaporized rock would not have this specific spectral feature.

“We’ve spent the last ten years modelling different scenarios, trying to imagine what this world might look like,” said co-author Yamila Miguel from the Leiden Observatory and the Netherlands Institute for Space Research (SRON). “Finally getting some confirmation of our work is priceless!”

Bubbling Magma Ocean

The team thinks that the gases blanketing 55 Cancri e would be bubbling out from the interior, rather than being present ever since the planet formed. “The primary atmosphere would be long gone because of the high temperature and intense radiation from the star,” said Bello-Arufe. “This would be a secondary atmosphere that is continuously replenished by the magma ocean. Magma is not just crystals and liquid rock; there’s a lot of dissolved gas in it, too.”

While 55 Cancri e is far too hot to be habitable, researchers think it could provide a unique window for studying interactions between atmospheres, surfaces, and interiors of rocky planets, and perhaps provide insights into the early conditions of Earth, Venus, and Mars, which are thought to have been covered in magma oceans far in the past. “Ultimately, we want to understand what conditions make it possible for a rocky planet to sustain a gas-rich atmosphere: a key ingredient for a habitable planet,” said Hu. This research was conducted as part of Webb’s General Observers (GO) Program 1952. Analysis of additional secondary eclipse observations of 55 Cancri e are currently in progress.

The James Webb Space Telescope is the world’s premier space science observatory. Webb is solving mysteries in our solar system, looking beyond to distant worlds around other stars, and probing the mysterious structures and origins of our universe and our place in it. Webb is an international program led by NASA with its partners, ESA (European Space Agency) and the Canadian Space Agency.


About This Release

Credits:

Media Contact:

Margaret W. Carruthers
Space Telescope Science Institute, Baltimore, Maryland

Christine Pulliam
Space Telescope Science Institute, Baltimore, Maryland

Science: Renyu Hu (NASA-JPL)

Permissions: Content Use Policy

 Contact Us: Direct inquiries to the News Team.

Related Links and Documents


Friday, May 10, 2024

A Vampire’s Sandwich Filled with Gas and Dust Jennifer Chu | MIT News

These images show the serendipitously discovered protoplanetary disk named Dracula's Chivito
Adapted from Breghea et al. 2024


The observations suggest some of earliest “monster” black holes grew from massive cosmic seeds.

Title: Dracula’s Chivito: Discovery of a Large Edge-On Protoplanetary Disk with Pan-STARRS
Authors: Ciprian T. Berghea et al.
First Author’s Institution: US Naval Observatory
Status: Accepted to ApJL

Where Planets Are Born

Studying protoplanetary disks helps us understand how planets, including those in our solar system, are born. These disks are vast and flared structures, consisting of dust and gas orbiting a young star. Protoplanetary disks contain the remnants of the stellar birth process, in which a collapsing molecular cloud gives rise to a central star surrounded by a swirling disk of material. Protoplanetary disks are vital to observe as they are the birth sites of planets. The tiny dust particles come together, sticking to each other and forming larger bodies. This process, influenced by gravity, gas, and radiation, leads to the birth of planets in developing planetary systems.

Meet the Vampire Sub

This research article features a large edge-on protoplanetary disk that was stumbled upon when going through images from the Pan-STARRS research project as a part of a study of active galactic nucleus candidates. This disk is one of the largest known disks in the sky and is oriented edge on, completely obscuring its central star. Associated with a source of infrared light in the same region of the sky, IRAS 23077+6707, the disk spans approximately 11″ in apparent size, with a very faint structure in the disk’s northern part extending out to about 17″. It is possibly the largest protoplanetary disk (by angular extent) discovered to date. The structure of this disk is reminiscent of the popular Gomez’s Hamburger, which is not associated with any star-forming region, just like the subject of this article. The similarity to a sandwich, along with the fang-like structures in the northern part of the disk as seen in the images in Figure 1, earned the IRAS 23077+6707 protoplanetary disk the name “Dracula’s Chivito” (chivito is a type of sandwich and the national dish of Uruguay, where one of the co-authors is from).

Decoding DraChi

Analysis: Images of Dracula’s Chivito (henceforth referred to as DraChi) were obtained in the grizy filters of Pan-STARRS (Figure 1). These images and data from the Galaxy Evolution Explorer (GALEX) (ultraviolet), the Two Micron All-Sky Survey (2MASS) (infrared), the Infrared Astronomical Satellite (IRAS) (infrared), and AKARI (infrared) were used for photometric analysis, i.e., flux or brightness measurements. These data were used to construct the spectral energy distribution of the disk (Figure 2), together with a radiative transfer model generated using the code HOCHUNK3D. Radiative transfer models help us understand the disk geometry and how light is scattered by the dust grains in the disk. This light, which we see along our line of sight, is plotted as a spectral energy distribution. Spectral energy distributions give information about how much energy an object gives off at different wavelengths.

Figure 2: The spectral energy distribution of the disk, using photometric data from the image, the model, and other sources as mentioned in the article. Brightness is plotted as a function of wavelength. The data (colored dots) match the model (the solid red line shows the model without extinction, and the dashed red line shows the model with extinction) in most places except in near- and mid-infrared wavelengths, which could be due to discrepancies between instruments or possible variability in the disk’s luminosity. Berghea et al. 2024

Distance: It is hard to estimate DraChi’s distance because it is not associated with a known star-forming region. Accurate distances to local molecular clouds are vital to locating protoplanetary disks and comprehending planet formation processes. Therefore, using the Gaia DR3 data for nearby stars, the extinction of the disk was estimated to find the distance to the nearest interstellar clouds, and DraChi is hence estimated to be 978 light-years away.

Basic Properties: The spectral energy distribution suggests that the host star of the disk is a pre-main-sequence star of type A with a temperature of about 6500–8500K. The images of the disk and the resultant radiative transfer model constrain the disk inclination to be between 80° and 84°. The scale height of the disk is about 25–50 au at a radius of 500 au (astronomical units), where 1 au is the distance from Earth to the Sun. Using the distance and the angular extent of the disk in the sky, the disk’s radius is estimated to be 1,650 au. The radiative transfer model, based on the scattering of the light, quantifies the mass of the disk to be about 0.2 times that of the Sun.

The Fangs: The authors noticed two “fang-like” features in the northern part of the disk, and these features were also reproduced in the model of the disk. The “fangs” closely resemble the “edge” of the shadow created by the disk in the bright surrounding envelope. They could be filaments due to a possible outflow from the central part of the disk, which is characteristic of a young disk at the end of the Class I phase (~0.5 million years old). It is possible that the fangs are present in the south, but this region is likely obscured in the images from Pan-STARRS and could be perhaps seen in infrared (longer-wavelength) imaging.

Is DraChi the Only One?

The short answer is no. DraChi is certainly different from most other protoplanetary disks, given its size and large distance from any known star-forming regions. But the existence of Gomez’s Hamburger proves there are more such disks awaiting discovery. A disk as young as DraChi is vital to understanding planet formation in its earlier stages, and its large size makes for interesting future observations using more sensitive instruments.

Original astrobite edited by Kylee Carden and Jessie Thwaites.


About the author, Maria Vincent:

Maria is a PhD candidate in astronomy at the Institute for Astronomy, University of Hawai’i at Manoa. Her research focuses on adaptive optics and high-contrast imaging science and instrumentation with ground-based telescopes. Driven by a fascination with planet formation and the intricate processes shaping our solar system, she uses the Subaru Coronagraphic Extreme Adaptive Optics suite to observe and study morphological features of protoplanetary disks in near-infrared wavelengths, aiming to understand disk structure and processes governing planet formation. On the instrumentation side, she is working on designing and constructing an optical testbed to test and characterize a new deformable mirror as part of the upcoming High-order Advanced Keck Adaptive Optics upgrade. Outside of work, she enjoys blogging, mystery, historical and science fiction literature and cinemedia, photography, hiking, and travel.


Editor’s Note: Astrobites is a graduate-student-run organization that digests astrophysical literature for undergraduate students. As part of the partnership between the AAS and astrobites, we occasionally repost astrobites content here at AAS Nova. We hope you enjoy this post from astrobites; the original can be viewed at astrobites.org.


Thursday, May 09, 2024

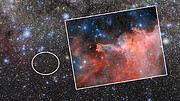
Dark Energy Camera Spies Cometary Globule Reaching for the Stars

PR Image noirlab2412a
Dark Energy Camera Images Cometary Globule CG 4

PR Image noirlab2412b
Excerpts from Giant Cometary Globule CG 4 Image


Videos

Cosmoview Episode 81: Dark Energy Camera Spies Cometary Globule Reaching for the Stars
PR Video noirlab2412a
Cosmoview Episode 81: Dark Energy Camera Spies Cometary Globule Reaching for the Stars

Cosmoview Episodio 81: Desde Tololo observan la “mano de Dios” emergiendo desde una nebulosa
PR Video noirlab2412b
Cosmoview Episodio 81: Desde Tololo observan la “mano de Dios” emergiendo desde una nebulosa

Pan on CG 4
PR Video noirlab2412c
Pan on CG 4

Zooming Into CG 4
PR Video noirlab2412d
Zooming Into CG 4


Dark Energy Camera captures the red glow of a cosmic ‘hand’ emerging from within the Gum Nebula

The dark, dusty cometary globule known as CG 4 is spotlighted in this image from the Department of Energy-fabricated Dark Energy Camera mounted on the U.S. National Science Foundation Víctor M. Blanco 4-meter Telescope at Cerro Tololo Inter-American Observatory, a Program of NSF NOIRLab. How these hard-to-detect clouds get their distinctive structure is still unclear, but astronomers speculate that it’s a consequence of the hot, massive stars that surround them.

About 1300 light-years away, in the constellation Puppis, a ghostly hand appears to be emerging from the interstellar medium and reaching out into the cosmos. This cloudy, ominous structure is CG 4, a cometary globule that has been given the nickname ‘God’s Hand’. CG 4 is one of many cometary globules present within the Milky Way, and how these objects get their distinctive form is still a matter of debate among astronomers.

Cometary globules are a subclass of the dark nebulae known as Bok globules — isolated clouds of dense cosmic gas and dust surrounded by hot, ionized material. When these clouds exhibit stripping of material that results in an extended tail, they are referred to as cometary globules because of their vague resemblance to a comet, though they have nothing in common. The features that classify CG 4 as a cometary globule are hard to miss in this image captured with the Department of Energy-fabricated Dark Energy Camera (DECam) mounted on the U.S. National Science Foundation Víctor M. Blanco 4-meter Telescope at Cerro Tololo Inter-American Observatory (CTIO), a Program of NSF NOIRLab. Its dusty head, which has a diameter of 1.5 light-years, and its long, faint tail, which is about eight light-years long, make CG 4 a comparatively small Bok globule, a general characteristic of cometary globules.

First recognized in 1976 from pictures taken with the UK Schmidt Telescope in Australia, cometary globules went undetected by astronomers for a long time because they are so faint. Their tails, shrouded in dark stellar dust, block most light from passing through. But with its special Hydrogen-alpha filter [1], DECam can pick up the faint red glow of ionized hydrogen present within CG 4’s head and around its outer rim. This light is produced when hydrogen becomes excited after being bombarded by radiation from nearby hot, massive stars.

The intense radiation generated by these neighboring massive stars, however, is gradually destroying the head of the globule and sweeping away the tiny particles that scatter the starlight. Still, the dusty cloud of CG 4 contains enough gas to feed the active formation of several new, Sun-sized stars.

While astronomers have observed these structures throughout the Milky Way, the overwhelming majority of them, including CG 4, are found within a huge patch of glowing gas called the Gum Nebula. Believed to be the expanding remains of a supernova that took place about a million years ago, the Gum Nebula is currently known to contain at least 31 cometary globules in addition to CG 4.

The mechanism by which these comet-like objects get their distinct shape is not entirely known, but astronomers have developed two main ideas about their origins. The first idea is that they could have originally been spherical nebulae — like the well-known Ring Nebula — which were then disrupted by a nearby supernova explosion, possibly the original explosion that created the Gum Nebula.

The second idea is that cometary globules are shaped by a combination of stellar winds and radiation pressure from nearby hot, massive stars. In fact, all of the cometary globules found within the Gum Nebula appear to have tails pointing away from the center of the nebula, which is where the Vela Supernova Remnant and Vela Pulsar are located. The Vela Pulsar is a rapidly spinning neutron star that was formed when a massive star collapsed, and it’s possible that its stellar winds and radiation pressure are shaping the nearby globules.

Also in this image it looks as if CG 4 is about to devour the edge-on spiral galaxy ESO 257-19 (PGC 21338), which appears to be placed so defenselessly in front of it. But in reality, this galaxy is more than a hundred million light-years beyond CG 4 and only appears to be close because of a chance alignment.


Notes

[1] At 62 cm (25 inches) in diameter, DECam’s narrow-band filters are some of the largest in operation anywhere. There are currently 11, centered on different wavelengths of interest, with 3 more being fabricated. Making narrow-band filters of this size that work in wide-field instruments like DECam is a significant technical challenge.


More information

NSF NOIRLab (U.S. National Science Foundation National Optical-Infrared Astronomy Research Laboratory), the U.S. center for ground-based optical-infrared astronomy, operates the International Gemini Observatory (a facility of NSF, NRC–Canada, ANID–Chile, MCTIC–Brazil, MINCyT–Argentina, and KASI–Republic of Korea), Kitt Peak National Observatory (KPNO), Cerro Tololo Inter-American Observatory (CTIO), the Community Science and Data Center (CSDC), and Vera C. Rubin Observatory (operated in cooperation with the Department of Energy’s SLAC National Accelerator Laboratory). It is managed by the Association of Universities for Research in Astronomy (AURA) under a cooperative agreement with NSF and is headquartered in Tucson, Arizona. The astronomical community is honored to have the opportunity to conduct astronomical research on I’oligam Du’ag (Kitt Peak) in Arizona, on Maunakea in Hawai‘i, and on Cerro Tololo and Cerro Pachón in Chile. We recognize and acknowledge the very significant cultural role and reverence that these sites have to the Tohono O’odham Nation, to the Native Hawaiian community, and to the local communities in Chile, respectively.


Links


Contacts

Josie Fenske
Jr. Public Information Officer
NSF NOIRLab
Email:
josie.fenske@noirlab.edu


Wednesday, May 08, 2024

A star forming factory

A spiral galaxy in the centre of a dark background, surrounded by a few distant galaxies and nearby stars. The galaxy is tilted diagonally and partially towards the viewer. Its disc is cloudy and threaded with dust, without clear arms. A bar of light extends across the disc from the glowing core. A faint halo of gas surrounds the disc.

The celestial object showcased in this week's Hubble Picture of the Week is the spiral galaxy UGC 9684, which lies around 240 million light-years from Earth in the constellation Boötes. This image shows an impressive example of several classic galactic features, including a clear bar in the galaxy's centre, and a halo surrounding its disc.

The impetus for this Hubble image was a study into the host galaxies of Type-II supernovae. These cataclysmic stellar explosions take place throughout the Universe, and are of great interest to astronomers, so automated surveys scan the night sky and attempt to catch sight of them. The supernova which brought UGC 9684 to Hubble's attention occurred during 2020. It has faded from view in this image, which was taken in 2023.

Remarkably, the 2020 supernova in this galaxy isn't the only one that's been seen there — four supernova-like events have been spotted in UGC 9684 since 2006, putting it up there with the most active supernova-producing galaxies. It turns out that UGC 9684 is a quite active star-forming galaxy, calculated as producing one solar mass worth of stars every few years! This level of stellar formation makes UGC 9684 a veritable supernova factory, and a galaxy to watch for astronomers hoping to examine these exceptional events.


Tuesday, May 07, 2024

Orion Nebula (M42)

Orion Nebula (M42)
Hi-res imaage

Distance from Earth : 1,500 light-years

Detail : The Orion Nebula (M42) is a star-forming region in the winter constellation. It is located at a distance of 1,500 light-years from Earth and is known as one of the nearest star-forming regions. Due to its large apparent size, the Orion Nebula is easy to find with the naked eye, and many stars can be seen through an amateur telescope.

At the center of the Orion Nebula is a cluster of massive newborn stars called Trapezium that ionize surrounding hydrogen gas by their ultraviolet light. The ionized gas emits a red glow.

See also the near-infrared image of the center of the Orion Nebula, near Trapezium, that was taken in January 1999 when the Subaru Telescope made its first "First Light" observation.

Instrument: Hyper Suprime-Cam (HSC)

This image was created by combining three different wavelengths: g-band ( 470 nanometers), i-band ( 760 nanometers), and y-band ( 980 nanometers). Blue, green, and red colors were assigned to these wavelengths respectively.

Relevant Links:


Monday, May 06, 2024

Unveiling the Universe at the field level

Galaxies are only the “tip of the iceberg” of the matter distribution in the universe. On the left, the gray structures represent a slice through the dark matter distribution in a large cosmological simulation with red points indicating the positions of galaxies. The right panel shows the same galaxies, where the colours represent their density on a coarse grid. This large-scale galaxy density is the data considered for the field-level analysis, and is computed directly from the observed galaxy positions. © MPA

The distribution of galaxies on large, cosmological scales holds important clues on the nature of dark matter, the properties of dark energy and the origin of our Universe. Yet, optimally retrieving this information from observations is challenging. MPA researchers are developing a novel analysis approach, where they follow the evolution of cosmic structures through their entire formation history. Enabling a very detailed comparison between theoretical models and observational data, this approach will allow measuring key parameters of dark matter and dark energy very precisely.

The spatial pattern of galaxies in the Universe exhibits a complex, web-like structure with large galaxy clusters at the nodes that is interspersed by fast voids. Cosmologists have developed a detailed understanding how this cosmic large-scale structure emerged. In a nutshell, an early inflationary period of rapid expansion created very small (of order 1 in 100,000) fluctuations in the cosmic energy density, which subsequently evolved under their self-gravity as the Universe expanded. Yet, in this picture, there remain several open questions:
  • What is the nature of dark energy that drives the accelerated expansion of the Universe?
  • What is the nature of dark matter, whose presence is required by gravitational dynamics?
  • What is the physical mechanism that drives inflation?
Dark matter is about five times more abundant than ordinary, “visible” matter. General Relativity requires visible and dark matter to experience the same gravitational forces, so the evolution of dark matter fluctuations can be predicted very precisely. ;It depends sensitively on the interplay between gravitational attraction and the cosmological expansion. Therefore, the cosmic large-scale structure holds important clues on the fundamental questions about our Universe. Large cosmological surveys map the distribution of galaxies out to very large distances. Yet, these galaxies comprise only the “tip of the iceberg” while the majority of the cosmic large-scale structure resides in dark matter and remains invisible.

Is there a way to deduce the distribution of dark matter in our Universe from the observed positions of galaxies? Can we understand how the structures we see today have formed? And can this help us to better answer the fundamental questions we have about our cosmos? The answer is yes. However, as we will see, we first need to overcome some challenges.

First, galaxies do not follow the distribution of matter one-to-one, we only observe a limited number of them, and measurement uncertainties affect the observations. Thus, the matter distribution that explains the observations is not unique – there can be multiple possibilities. A statistical Bayesian analysis can capture this uncertainty: we generate several plausible matter distributions, evaluate how consistent they are with the observations, and only keep those that show the highest level of agreement.

The relation between galaxies and the underlying matter density field is modelled with a theoretical framework called the Effective Field Theory (EFT) of Large Scale Structure. This effective theory has a number of free parameters designed to make our results insensitive to the details of galaxy formation on small scales, which we cosmologists do not yet understand completely. Moreover, the theory gives us a “likelihood” that quantifies the level of agreement between a proposed matter distribution and the observed galaxies. Since this comparison is done voxel by voxel (3D pixels), this is also known as a field-level analysis.

The second challenge is how to propose plausible matter distributions in the first place. The matter distribution in the universe today is the result of a complex dynamical evolution. In contrast, the distribution of primordial perturbations, which provide the starting point to this evolution, have simple statistical properties. We can take a guess on the primordial density, forward model their evolution in time, and compare that prediction to the observation. We repeat this over and over to discover the configurations best explaining the data and explore all possible solutions.


The field–level analysis starts from guessing a possible matter distribution in the very early Universe (left) and evolves it through cosmic time to predict the expected large-scale galaxy distribution (middle) that we can observe with cosmological surveys (right). Shown here are two-dimensional slices; in reality, each panel corresponds to a three-dimensional cube. Each frame in the animation shows a separate realization of the large-scale structure that is compatible with the observation. By optimizing the agreement between model prediction and observation, we can infer the distribution of dark matter in the Universe and measure properties of dark matter and dark energy very precisely.

Each possible realization of the three-dimensional primordial density is characterized by up to a million parameters. And for each of these realizations we have the full history of structure formation. To explore this huge range of possibilities efficiently, we have developed our own numerical code LEFTfield, which is heavily parallelized, provides gradient information and runs on computing clusters. It can generate plausible matter distributions and forward evolve them through cosmic time in just a few seconds. Figure 2 illustrates the result of such an analysis on a simulated dataset, where each frame of the animation shows a separate simulated universe that is compatible with the observation. The observations best constrain the distribution of matter on large scales. Correspondingly, the animation shows little variability in the inferred density for larger structures, but more movement in smaller ones.

How does this help to answer the questions posed above? The properties of dark matter and dark energy are built into our numerical forward model for structure formation. We can now modify these parameters and see how the agreement with the data changes. For example, changing the amount of dark energy or how it evolves leads to a different expansion rate of the universe, which in turn affects the growth of structure. This comparison therefore allows us to measure key parameters of dark matter and dark energy.

The field-level analysis extracts all information available in the large-scale galaxy distribution; our ultimate goal is to achieve a much more precise measurement of dark matter and dark energy than current state-of-the-art analyses. The latter only compare theory and data at the level of highly-compressed summary statistics (such as the RMS fluctuations as a function of scale). A further advantage of forward modeling is that we can incorporate observational and instrumental effects present in cosmological surveys. One example are redshift-space distortions from the peculiar motion of galaxies. In fact, the peculiar motions allow us to extract additional cosmological information, as they directly probe the growth rate of cosmic structures.

We are continuing to advance the technique to apply it to state-of-the-art cosmological observations, where they will hopefully allow us to better understand dark matter and dark energy. A comparative analysis that we performed recently shows that field-level analysis indeed yields tighter measurements than the standard approach, so stay tuned for some exciting highlights we hope to share soon.


Authors:

Julia Stadler
Postdoc
tel:2205

jstadler@mpa-garching.mpg.de

Fabian Schmidt
Scientific Staff Member of the works council,
Representative of the Scientific Coworkers
tel:2274

fschmidt@mpa-garching.mpg.de

Beatriz Tucci Schiewaldt
PhD student
tel:2358

tucci@mpa-garching.mpg.de


Original publications:

1. Fabian Schmidt
An n-th order Lagrangian Forward Model for Large-Scale Structure
JCAP 04 (2021), 033


DOI

2. Andrija Kostić, Nhat-Minh Nguyen, Fabian Schmidt, Martin Reinecke
Consistency tests of field level inference with the EFT likelihood
JCAP 07 (2023), 063


DOI

3. Julia Stadler, Fabian Schmidt, Martin Reinecke
Cosmology inference at the field level from biased tracers in redshift-space
JCAP 10 (2023), 069

DOI


Sunday, May 05, 2024

A Tale of Three Dwarf Galaxies

ESO 185, ESO 338, HARO 11
The images above show three blue compact dwarf galaxies dotted with pink star-forming knots. Just a tenth of the size of the Milky Way, blue compact dwarfs are unique among galaxies with high star-formation rates in that they’re mostly free of dust and have low abundances of metals (elements heavier than helium) — properties they share with galaxies in the early universe. Using Hubble Space Telescope data, Rupali Chandar (University of Toledo) and collaborators investigated the star-formation histories of the three blue compact dwarfs pictured above. The team sought to understand whether these galaxies are all undergoing bursts of star formation, in which new stars are created at 10 times the usual rate. Their analysis revealed that while all three galaxies are forming plenty of new stars, only Haro 11 is truly experiencing a burst; ESO 185 was forming stars about four times faster than normal about 40 million years ago, and ESO 338 hasn’t seen much change in its star formation over the last few billion years. To learn more about the star-formation histories of these peculiar blue galaxies, be sure to check out the full research article linked below.

Citation

“A Tale of Three Dwarfs: Cluster-Based Star Formation Histories of Blue Compact Dwarf Galaxies,” Rupali Chandar et al 2024 ApJ 965 95. doi:10.3847/1538-4357/ad293a


Saturday, May 04, 2024

On the hunt for X-rays

A spiral galaxy viewed tilted at a diagonal angle. The core and the disc of the galaxy are different colours, but are otherwise difficult to tell apart, with the disc having wispy, ragged edges and many arcs of glowing star-forming patches. A few distant galaxies can be seen in the background around the spiral galaxy, as well as several foreground stars. Credit: ESA/Hubble & NASA, M. Sun

Featured in this Hubble Picture of the Week this week is the dwarf galaxy IC 776. This swirling collection of stars new and old is located in the constellation Virgo — in fact, in the Virgo galaxy cluster — 100 million light-years from Earth. While a dwarf galaxy, it's also been classified as an SAB-type or ‘weakly barred’ spiral, one study naming it a “complex case” in morphology. This highly detailed view from Hubble demonstrates that complexity well. IC 776 has a ragged, disturbed disc that nevertheless looks to spiral around the core, and arcs of star-forming regions.

This image is from an observation programme dedicated to the study of dwarf galaxies in the Virgo cluster, searching for sources of X-rays in such galaxies. X-rays are often emitted by accretion discs, where material that is drawn into a compact object by gravity crashes together and forms a hot, glowing disc. The compact object can be a white dwarf or neutron star in a binary pair, stealing material from its companion star, or it can be the supermassive black hole at the heart of a galaxy, devouring all around it. Dwarf galaxies like IC 776, travelling through the Virgo cluster, experience a pressure from the intergalactic gas which can both stimulate star formation and feed the central black hole in a galaxy. That can create energetic accretion discs, hot enough to emit X-rays.

While Hubble is not able to see X-rays, it can coordinate with X-ray telescopes such as NASA’s Chandra, revealing the sources of this radiation in high resolution using visible light. Dwarf galaxies are thought to be very important for our understanding of cosmology and the evolution of galaxies. As with many areas of astronomy, the ability to examine these galaxies across the electromagnetic spectrum is critical to their study.

Link


Friday, May 03, 2024

Gemini South Reveals Origin of Unexpected Differences in Giant Binary Stars

PR Image noirlab2410a
Artist’s Impression of a Giant-Giant Binary


Videos

Cosmoview Episode 80: Gemini South Reveals Origin of Unexpected Differences in Giant Binary Stars
PR Video noirlab2410a
Cosmoview Episode 80: Gemini South Reveals Origin of Unexpected Differences in Giant Binary Stars

Cosmoview Episodio 80: Desde Chile descubren causas de la diversidad estelar en estrellas binarias
PR Video noirlab2410b
Cosmoview Episodio 80: Desde Chile descubren causas de la diversidad estelar en estrellas binarias


Astronomers confirm that differences in the chemical composition of binary stars can be traced back to the earliest stages of their formation

Using the Gemini South telescope a team of astronomers have confirmed for the first time that differences in binary stars’ composition can originate from chemical variations in the cloud of stellar material from which they formed. The results help explain why stars born from the same molecular cloud can possess different chemical composition and host different planetary systems, as well as pose challenges to current stellar and planet formation models.

It is estimated that up to 85% of stars exist in binary star systems, some even in systems with three or more stars. These stellar pairs are born together out of the same molecular cloud from a shared abundance of chemical building blocks, so astronomers would expect to find that they have nearly identical compositions and planetary systems. However, for many binaries that isn’t the case. While some proposed explanations attribute these dissimilarities to events occurring after the stars evolved, a team of astronomers have confirmed for the first time that they can actually originate from before the stars even began to form.

Led by Carlos Saffe of the Institute of Astronomical, Earth and Space Sciences (ICATE-CONICET) in Argentina, the team used the Gemini South telescope in Chile, one half of the International Gemini Observatory, supported in part by the U.S. National Science Foundation and operated by NSF NOIRLab. With the new, precise Gemini High Resolution Optical SpecTrograph (GHOST) the team studied the different wavelengths of light, or spectra, given off by a pair of giant stars, which revealed significant differences in their chemical make-up. “GHOST’s extremely high-quality spectra offered unprecedented resolution,” said Saffe, “allowing us to measure the stars’ stellar parameters and chemical abundances with the highest possible precision.” These measurements revealed that one star had higher abundances of heavy elements than the other. To disentangle the origin of this discrepancy, the team used a unique approach.

Previous studies have proposed three possible explanations for observed chemical differences between binary stars. Two of them involve processes that would occur well into the stars’ evolution: atomic diffusion, or the settling of chemical elements into gradient layers depending on each star’s temperature and surface gravity; and the engulfment of a small, rocky planet, which would introduce chemical variations in a star’s composition.

The third possible explanation looks back at the beginning of the stars’ formation, suggesting that the differences originate from primordial, or pre-existing, areas of nonuniformity within the molecular cloud. In simpler terms, if the molecular cloud has an uneven distribution of chemical elements, then stars born within that cloud will have different compositions depending on which elements were available at the location where each formed.

So far, studies have concluded that all three explanations are probable; however, these studies focused solely on main-sequence binaries. The ‘main-sequence’ is the stage where a star spends most of its existence, and the majority of stars in the Universe are main-sequence stars, including our Sun. Instead, Saffe and his team observed a binary consisting of two giant stars. These stars possess extremely deep and strongly turbulent external layers, or convective zones. Owing to the properties of these thick convective zones, the team was able to rule out two of the three possible explanations.

The continuous swirling of fluid within the convective zone would make it difficult for material to settle into layers, meaning giant stars are less sensitive to the effects of atomic diffusion — ruling out the first explanation. The thick external layer also means that a planetary engulfment would not change a star’s composition much since the ingested material would rapidly be diluted — ruling out the second explanation. This leaves primordial inhomogeneities within the molecular cloud as the confirmed explanation. “This is the first time astronomers have been able to confirm that differences between binary stars begin at the earliest stages of their formation,” said Saffe.

“Using the precision-measurement capabilities provided by the GHOST instrument, Gemini South is now collecting observations of stars at the end of their lives to reveal the environment in which they were born,” says Martin Still, NSF program director for the International Gemini Observatory. “This gives us the ability to explore how the conditions in which stars form can influence their entire existence over millions or billions of years.”

Three consequences of this study are of particular significance. First, these results offer an explanation for why astronomers see binary stars with such different planetary systems. “Different planetary systems could mean very different planets — rocky, Earth-like, ice giants, gas giants — that orbit their host stars at different distances and where the potential to support life might be very different,” said Saffe.

Second, these results pose a crucial challenge to the concept of chemical tagging — using chemical composition to identify stars that came from the same environment or stellar nursery — by showing that stars with different chemical compositions can still have the same origin.

Finally, observed differences previously attributed to planetary impacts on a star’s surface will need to be reviewed, as they might now be seen as having been there from the very beginning of the star’s life.

“By showing for the first time that primordial differences really are present and responsible for differences between twin stars, we show that star and planet formation could be more complex than initially thought,” said Saffe. “The Universe loves diversity!”


More information

This research was presented in a paper accepted in Astronomy & Astrophysics Letters. DOI: 10.1051/0004-6361/202449263

The team is composed of C. Saffe (ICATE-CONICET/UNSJ, Argentina), P. Miquelarena (ICATE-CONICET/UNSJ, Argentina), J. Alacoria (ICATE-CONICET, Argentina), E. Martioli (LNA/MCTI, Brasil), M. Flores (ICATE-CONICET/UNSJ, Argentina), M. Jaque Arancibia (Universidad de La Serena, Chile), R. Angeloni (International Gemini Observatory/NSF NOIRLab, Chile), E. Jofré (OAC/CONICET, Argentina), J. Yana Galarza (Carnegie Institution for Science, CA), E. González (UNSJ, Argentina), and A. Collado (ICATE-CONICET/UNSJ, Argentina).

NSF NOIRLab (U.S. National Science Foundation National Optical-Infrared Astronomy Research Laboratory), the U.S. center for ground-based optical-infrared astronomy, operates the International Gemini Observatory (a facility of NSF, NRC–Canada, ANID–Chile, MCTIC–Brazil, MINCyT–Argentina, and KASI–Republic of Korea), Kitt Peak National Observatory (KPNO), Cerro Tololo Inter-American Observatory (CTIO), the Community Science and Data Center (CSDC), and Vera C. Rubin Observatory (operated in cooperation with the Department of Energy’s SLAC National Accelerator Laboratory). It is managed by the Association of Universities for Research in Astronomy (AURA) under a cooperative agreement with NSF and is headquartered in Tucson, Arizona. The astronomical community is honored to have the opportunity to conduct astronomical research on I’oligam Du’ag (Kitt Peak) in Arizona, on Maunakea in Hawai‘i, and on Cerro Tololo and Cerro Pachón in Chile. We recognize and acknowledge the very significant cultural role and reverence that these sites have to the Tohono O’odham Nation, to the Native Hawaiian community, and to the local communities in Chile, respectively.


Links


Contacts:

Carlos Saffe
Institute of Astronomical, Earth and Space Sciences, Argentina
Email:
saffe.carlos@gmail.com

Josie Fenske
Jr. Public Information Officer
NSF NOIRLab
Email:
josie.fenske@noirlab.edu


Thursday, May 02, 2024

NASA's Webb Maps Weather on Planet 280 Light-Years Away

Hot Gas-Giant Exoplanet WASP-43 b (Artist’s Concept)
Credits: Artwork: NASA, ESA, CSA, Ralf Crawford (STScI)


Hot Gas-Giant Exoplanet WASP-43 b (MIRI Phase Curve)
Credits: Illustration: NASA, ESA, CSA, Ralf Crawford (STScI)
Science: Taylor Bell (BAERI), Joanna Barstow (The Open University), Michael Roman (University of Leicester)


Hot Gas-Giant Exoplanet WASP-43 b (Temperature Maps)
Credits: Illustration: NASA, ESA, CSA, Ralf Crawford (STScI)
Science: Taylor Bell (BAERI), Joanna Barstow (The Open University), Michael Roman (University of Leicester)


Hot Gas-Giant Exoplanet WASP-43 b (Rotating Global Temperature Map) (Video)
Credits: Video: Thomas Muller (MPIA)


An international team of researchers has successfully used NASA’s James Webb Space Telescope to map the weather on the hot gas-giant exoplanet WASP-43 b.

Precise brightness measurements over a broad spectrum of mid-infrared light, combined with 3D climate models and previous observations from other telescopes, suggest the presence of thick, high clouds covering the nightside, clear skies on the dayside, and equatorial winds upwards of 5,000 miles per hour mixing atmospheric gases around the planet.

The investigation is just the latest demonstration of the exoplanet science now possible with Webb’s extraordinary ability to measure temperature variations and detect atmospheric gases trillions of miles away.

Tidally Locked “Hot Jupiter”

WASP-43 b is a “hot Jupiter” type of exoplanet: similar in size to Jupiter, made primarily of hydrogen and helium, and much hotter than any of the giant planets in our own solar system. Although its star is smaller and cooler than the Sun, WASP-43 b orbits at a distance of just 1.3 million miles – less than 1/25th the distance between Mercury and the Sun.

With such a tight orbit, the planet is tidally locked, with one side continuously illuminated and the other in permanent darkness. Although the nightside never receives any direct radiation from the star, strong eastward winds transport heat around from the dayside.

Since its discovery in 2011, WASP-43 b has been observed with numerous telescopes, including NASA’s Hubble and now-retired Spitzer space telescopes.

“With Hubble, we could clearly see that there is water vapor on the dayside. Both Hubble and Spitzer suggested there might be clouds on the nightside,” explained Taylor Bell, researcher from the Bay Area Environmental Research Institute and lead author of a study published today in Nature Astronomy . “But we needed more precise measurements from Webb to really begin mapping the temperature, cloud cover, winds, and more detailed atmospheric composition all the way around the planet.”

Mapping Temperature and Inferring Weather

Although WASP-43 b is too small, dim, and close to its star for a telescope to see directly, its short orbital period of just 19.5 hours makes it ideal for phase curve spectroscopy, a technique that involves measuring tiny changes in brightness of the star-planet system as the planet orbits the star.

Since the amount of mid-infrared light given off by an object depends largely on how hot it is, the brightness data captured by Webb can then be used to calculate the planet’s temperature.

The team used Webb’s MIRI (Mid-Infrared Instrument) to measure light from the WASP-43 system every 10 seconds for more than 24 hours. “By observing over an entire orbit, we were able to calculate the temperature of different sides of the planet as they rotate into view,” explained Bell. “From that, we could construct a rough map of temperature across the planet.”

The measurements show that the dayside has an average temperature of nearly 2,300 degrees Fahrenheit (1,250 degrees Celsius) – hot enough to forge iron. Meanwhile, the nightside is significantly cooler at 1,100 degrees Fahrenheit (600 degrees Celsius). The data also helps locate the hottest spot on the planet (the “hotspot”), which is shifted slightly eastward from the point that receives the most stellar radiation, where the star is highest in the planet’s sky. This shift occurs because of supersonic winds, which move heated air eastward.

“The fact that we can map temperature in this way is a real testament to Webb’s sensitivity and stability,” said Michael Roman, a co-author from the University of Leicester in the U.K.

To interpret the map, the team used complex 3D atmospheric models like those used to understand weather and climate on Earth. The analysis shows that the nightside is probably covered in a thick, high layer of clouds that prevent some of the infrared light from escaping to space. As a result, the nightside – while very hot – looks dimmer and cooler than it would if there were no clouds.

Missing Methane and High Winds

The broad spectrum of mid-infrared light captured by Webb also made it possible to measure the amount of water vapor (H2O) and methane (CH4) around the planet. “Webb has given us an opportunity to figure out exactly which molecules we’re seeing and put some limits on the abundances,” said Joanna Barstow, a co-author from the Open University in the U.K.

The spectra show clear signs of water vapor on the nightside as well as the dayside of the planet, providing additional information about how thick the clouds are and how high they extend in the atmosphere.

Surprisingly, the data also shows a distinct lack of methane anywhere in the atmosphere. Although the dayside is too hot for methane to exist (most of the carbon should be in the form of carbon monoxide), methane should be stable and detectable on the cooler nightside.

“The fact that we don't see methane tells us that WASP-43 b must have wind speeds reaching something like 5,000 miles per hour,” explained Barstow. “If winds move gas around from the dayside to the nightside and back again fast enough, there isn’t enough time for the expected chemical reactions to produce detectable amounts of methane on the nightside.”

The team thinks that because of this wind-driven mixing, the atmospheric chemistry is the same all the way around the planet, which wasn’t apparent from past work with Hubble and Spitzer.

The MIRI observation of WASP-43 b was conducted as part of the Webb Early Release Science programs, which are providing researchers with a vast set of robust, open-access data for studying a wide array of cosmic phenomena.

The James Webb Space Telescope is the world's premier space science observatory. Webb is solving mysteries in our solar system, looking beyond to distant worlds around other stars, and probing the mysterious structures and origins of our universe and our place in it. Webb is an international program led by NASA with its partners, ESA (European Space Agency) and the Canadian Space Agency.


About This Release

Credits:

Media Contact:

Margaret W. Carruthers
Space Telescope Science Institute, Baltimore, Maryland

Christine Pulliam
Space Telescope Science Institute, Baltimore, Maryland

Science: Taylor Bell (BAERI)

Permissions: Content Use Policy

Contact Us: Direct inquiries to the News Team.

Related Links and Documents


Wednesday, May 01, 2024

A giant galactic explosion catches galaxy pollution in the act

Gas (in red, top and bottom) is ejected from the nearby galaxy NGC 4383
Credit: Watts et al, 2024
. Full Size Picture

Astronomers have produced the first high-resolution map of a massive explosion in the nearby galaxy NGC 4383, providing important clues on how the space between galaxies is polluted with chemical elements.

A team of international researchers studied the galaxy NGC 4383, in the nearby Virgo cluster, revealing a gas outflow so large that it would take 20,000 years for light to travel from one side to the other.

This gas outflow is the result of extremely powerful stellar explosions in the central regions of the galaxy that can eject enormous amounts of hydrogen and heavier elements. The mass of gas ejected is equivalent to over 50 million Suns.


Lead author Dr Adam Watts, from the University of Western Australia node at the International Centre for Radio Astronomy Research (ICRAR), said very little is known about the physics of outflows and their properties because outflows are very hard to detect.

“The ejected gas is quite rich in heavy elements giving us a unique view of the complex process of mixing between hydrogen and metals in the outflowing gas. In this particular case, we can detect oxygen, nitrogen, sulphur and many other chemical elements”.

Gas outflows are crucial to regulate how fast and for how long galaxies can keep forming stars. The gas ejected by these explosions pollutes the space between stars within a galaxy, and even between galaxies, and can float in the intergalactic medium forever.


The high-resolution map was produced with data from the MAUVE survey. The survey used the MUSE Integral Field Spectrograph on the European Southern Observatoryʼs Very Large Telescope, located in northern Chile.

ICRAR researchers Professors Barbara Catinella and Luca Cortese, co-authors of the study and co-leaders of MAUVE, said “We designed MAUVE to investigate how physical processes such as gas outflows help stop star formation in galaxies.”

“NGC 4383 was our first target, as we suspected something very interesting was happening, but the data exceeded all our expectations.”

In the future, MAUVE observations promise to reveal the importance of gas outflows in the local Universe with exquisite detail.

The discovery was published today in the journal Monthly Notices of the Royal Astronomical Society.

An intricate network of pipes surrounding the 24 spectrographs of the MUSE instrument on the VLT.

The MUSE instrument, attached to the Very Large Telescope (VLT) in Chile
Credit: A. Tudorica/ESO

Publication