Monday, February 13, 2017

Scientists estimate solar nebula’s lifetime

By studying the magnetic orientations in ancient meteorites, an MIT team has determined that the solar nebula — the vast of disc of gas and dust that ultimately gave rise to the solar system — lasted around 3 to 4 million years. Image: NASA/JHUAPL


Study finds the swirling gas disk disappeared within the solar system’s first 4 million years

About 4.6 billion years ago, an enormous cloud of hydrogen gas and dust collapsed under its own weight, eventually flattening into a disk called the solar nebula. Most of this interstellar material contracted at the disk’s center to form the sun, and part of the solar nebula’s remaining gas and dust condensed to form the planets and the rest of our solar system.

Now scientists from MIT and their colleagues have estimated the lifetime of the solar nebula — a key stage during which much of the solar system evolution took shape.

This new estimate suggests that the gas giants Jupiter and Saturn must have formed within the first 4 million years of the solar system’s formation. Furthermore, they must have completed gas-driven migration of their orbital positions by this time.

“So much happens right at the beginning of the solar system’s history,” says Benjamin Weiss, professor of earth, atmospheric, and planetary sciences at MIT. “Of course the planets evolve after that, but the large-scale structure of the solar system was essentially established in the first 4 million years.”

Weiss and MIT postdoc Huapei Wang, the first author of this study, report their results today in the journal Science. Their co-authors are Brynna Downey, Clement Suavet, and Roger Fu from MIT; Xue-Ning Bai of the Harvard-Smithsonian Center for Astrophysics; Jun Wang and Jiajun Wang of Brookhaven National Laboratory; and Maria Zucolotto of the National Museum in Rio de Janeiro.

Spectacular recorders

By studying the magnetic orientations in pristine samples of ancient meteorites that formed 4.653 billion years ago, the team determined that the solar nebula lasted around 3 to 4 million years. This is a more precise figure than previous estimates, which placed the solar nebula’s lifetime at somewhere between 1 and 10 million years.

The team came to its conclusion after carefully analyzing angrites, which are some of the oldest and most pristine of planetary rocks. Angrites are igneous rocks, many of which are thought to have erupted onto the surface of asteroids very early in the solar system’s history and then quickly cooled, freezing their original properties — including their composition and paleomagnetic signals — in place.

Scientists view angrites as exceptional recorders of the early solar system, particularly as the rocks also contain high amounts of uranium, which they can use to precisely determine their age.
“Angrites are really spectacular,” Weiss says. “Many of them look like what might be erupting on Hawaii, but they cooled on a very early planetesimal.”

Weiss and his colleagues analyzed four angrites that fell to Earth at different places and times.

“One fell in Argentina, and was discovered when a farm worker was tilling his field,” Weiss says. “It looked like an Indian artifact or bowl, and the landowner kept it by this house for about 20 years, until he finally decided to have it analyzed, and it turned out to be a really rare meteorite.”

The other three meteorites were discovered in Brazil, Antarctica, and the Sahara Desert. All four meteorites were remarkably well-preserved, having undergone no additional heating or major compositional changes since they originally formed.

Measuring tiny compasses

The team obtained samples from all four meteorites. By measuring the ratio of uranium to lead in each sample, previous studies had determined that the three oldest formed around 4.653 billion years ago. The researchers then measured the rocks’ remnant magnetization using a precision magnetometer in the MIT Paleomagnetism Laboratory.

“Electrons are little compass needles, and if you align a bunch of them in a rock, the rock becomes magnetized,” Weiss explains. “Once they’re aligned, which can happen when a rock cools in the presence of a magnetic field, then they stay that way. That’s what we use as records of ancient magnetic fields.”

When they placed the angrites in the magnetometer, the researchers observed very little remnant magnetization, indicating there was very little magnetic field present when the angrites formed.
The team went a step further and tried to reconstruct the magnetic field that would have produced the rocks’ alignments, or lack thereof. To do so, they heated the samples up, then cooled them down again in a laboratory-controlled magnetic field.

“We can keep lowering the lab field and can reproduce what’s in the sample,” Weiss says. “We find only very weak lab fields are allowed, given how little remnant magnetization is in these three angrites.”

Specifically, the team found that the angrites’ remnant magnetization could have been produced by an extremely weak magnetic field of no more than 0.6 microteslas, 4.653 billion years ago, or, about 4 million years after the start of the solar system.

In 2014, Weiss’ group analyzed other ancient meteorites that formed within the solar system’s first 2 to 3 million years, and found evidence of a magnetic field that was about 10-100 times stronger — about 5-50 microtesla.

“It’s predicted that once the magnetic field drops by a factor of 10-100 in the inner solar system, which we’ve now shown, the solar nebula goes away really quickly, within 100,000 years,” Weiss says. “So even if the solar nebula hadn’t disappeared by 4 million years, it was basically on its way out.”

The planets align

The researchers’ new estimate is much more precise than previous estimates, which were based on observations of faraway stars.

“What’s more, the angrites’ paleomagnetism constrains the lifetime of our own solar nebula, while astronomical observations obviously measure other faraway solar systems,” Wang adds. “Since the solar nebula lifetime critically affects the final positions of Jupiter and Saturn, it also affects the later formation of the Earth, our home, as well as the formation of other terrestrial planets.”

Now that the scientists have a better idea of how long the solar nebula persisted, they can also narrow in on how giant planets such as Jupiter and Saturn formed. Giant planets are mostly made of gas and ice, and there are two prevailing hypotheses for how all this material came together as a planet. One suggests that giant planets formed from the gravitational collapse of condensing gas, like the sun did. The other suggests they arose in a two-stage process called core accretion, in which bits of material smashed and fused together to form bigger rocky, icy bodies. Once these bodies were massive enough, they could have created a gravitational force that attracted huge amounts of gas to ultimately form a giant planet.

According to previous predictions, giant planets that form through gravitational collapse of gas should complete their general formation within 100,000 years. Core accretion, in contrast, is typically thought to take much longer, on the order of 1 to several million years. Weiss says that if the solar nebula was around in the first 4 million years of solar system formation, this would give support to the core accretion scenario, which is generally favored among scientists.

“The gas giants must have formed by 4 million years after the formation of the solar system,” Weiss says. “Planets were moving all over the place, in and out over large distances, and all this motion is thought to have been driven by gravitational forces from the gas. We’re saying all this happened in the first 4 million years.”

This research was supported, in part, by NASA and a generous gift from Thomas J. Peterson, Jr.

Jennifer Chu | MIT News Office

Source: MIT/News

Sunday, February 12, 2017

When Stars Explode

Credit: ESO
Acknowledgement: Flickr user Josh Barrington


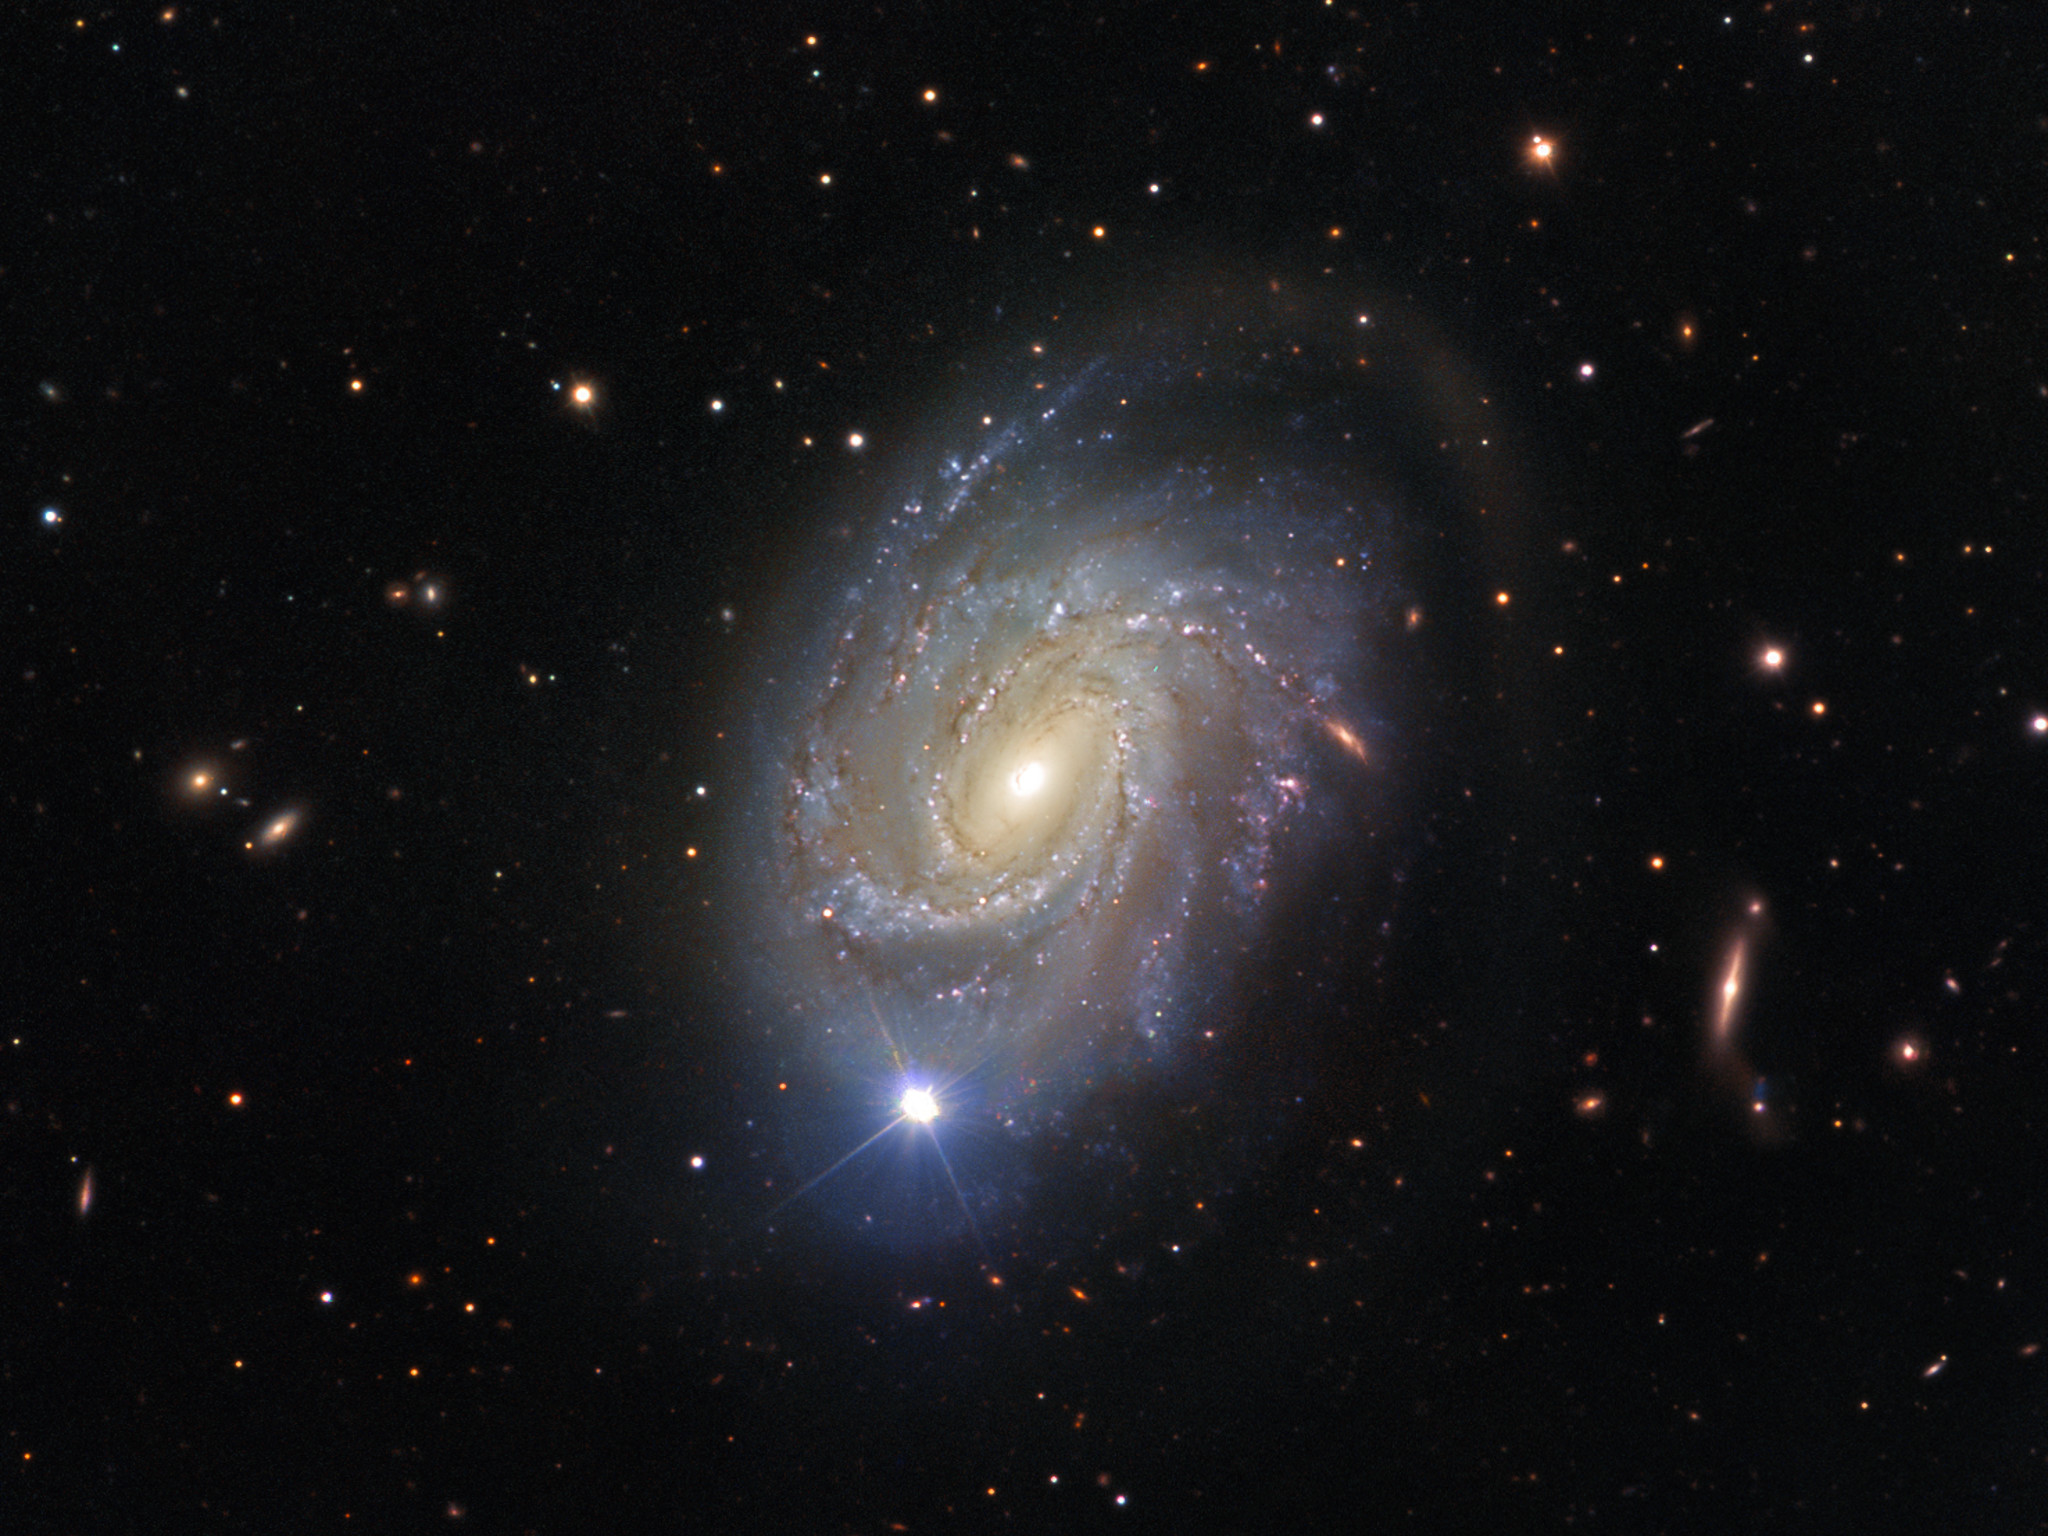
Over 75 million light-years away in the constellation of Virgo (The Virgin) lies NGC 4981 — a spiral galaxy with a rather explosive past.

NGC 4981 was discovered on 17 April 1784 by William Herschel, and subsequently documented in John Dreyer’s New General Catalogue. Over a century later, on 23 April 1968, the galaxy once again made it into the records when a Type la supernova — a stellar explosion in a binary star system — occurred within its confines: SN 1968I. SN 1968I, however, was not to be the galaxy’s only supernova. Decades later, the core collapse of a massive star led to supernova SN 2007c.

This spectacular shot of NGC 4981 — not showing any of the supernovae explosions; the bright star visible in the image is a foreground star — was captured by FORS, the visible and near-UV FOcal Reducer and low dispersion Spectrograph for ESO’s Very Large Telescope (VLT). FORS is the Swiss Army knife of ESO’s instruments — it is able to study many different astronomical objects in many different ways, and is responsible for some of the most iconic photos ever captured with the VLT (see eso9948f and eso0202a).

The data to create this image was selected from the ESO archive by Josh Barrington as part of the Hidden Treasures competition.


Source: ESO/images

Saturday, February 11, 2017

Blue jets studied from Space Station

Blue jets studied from Space Station
Copyright ESA/NAS

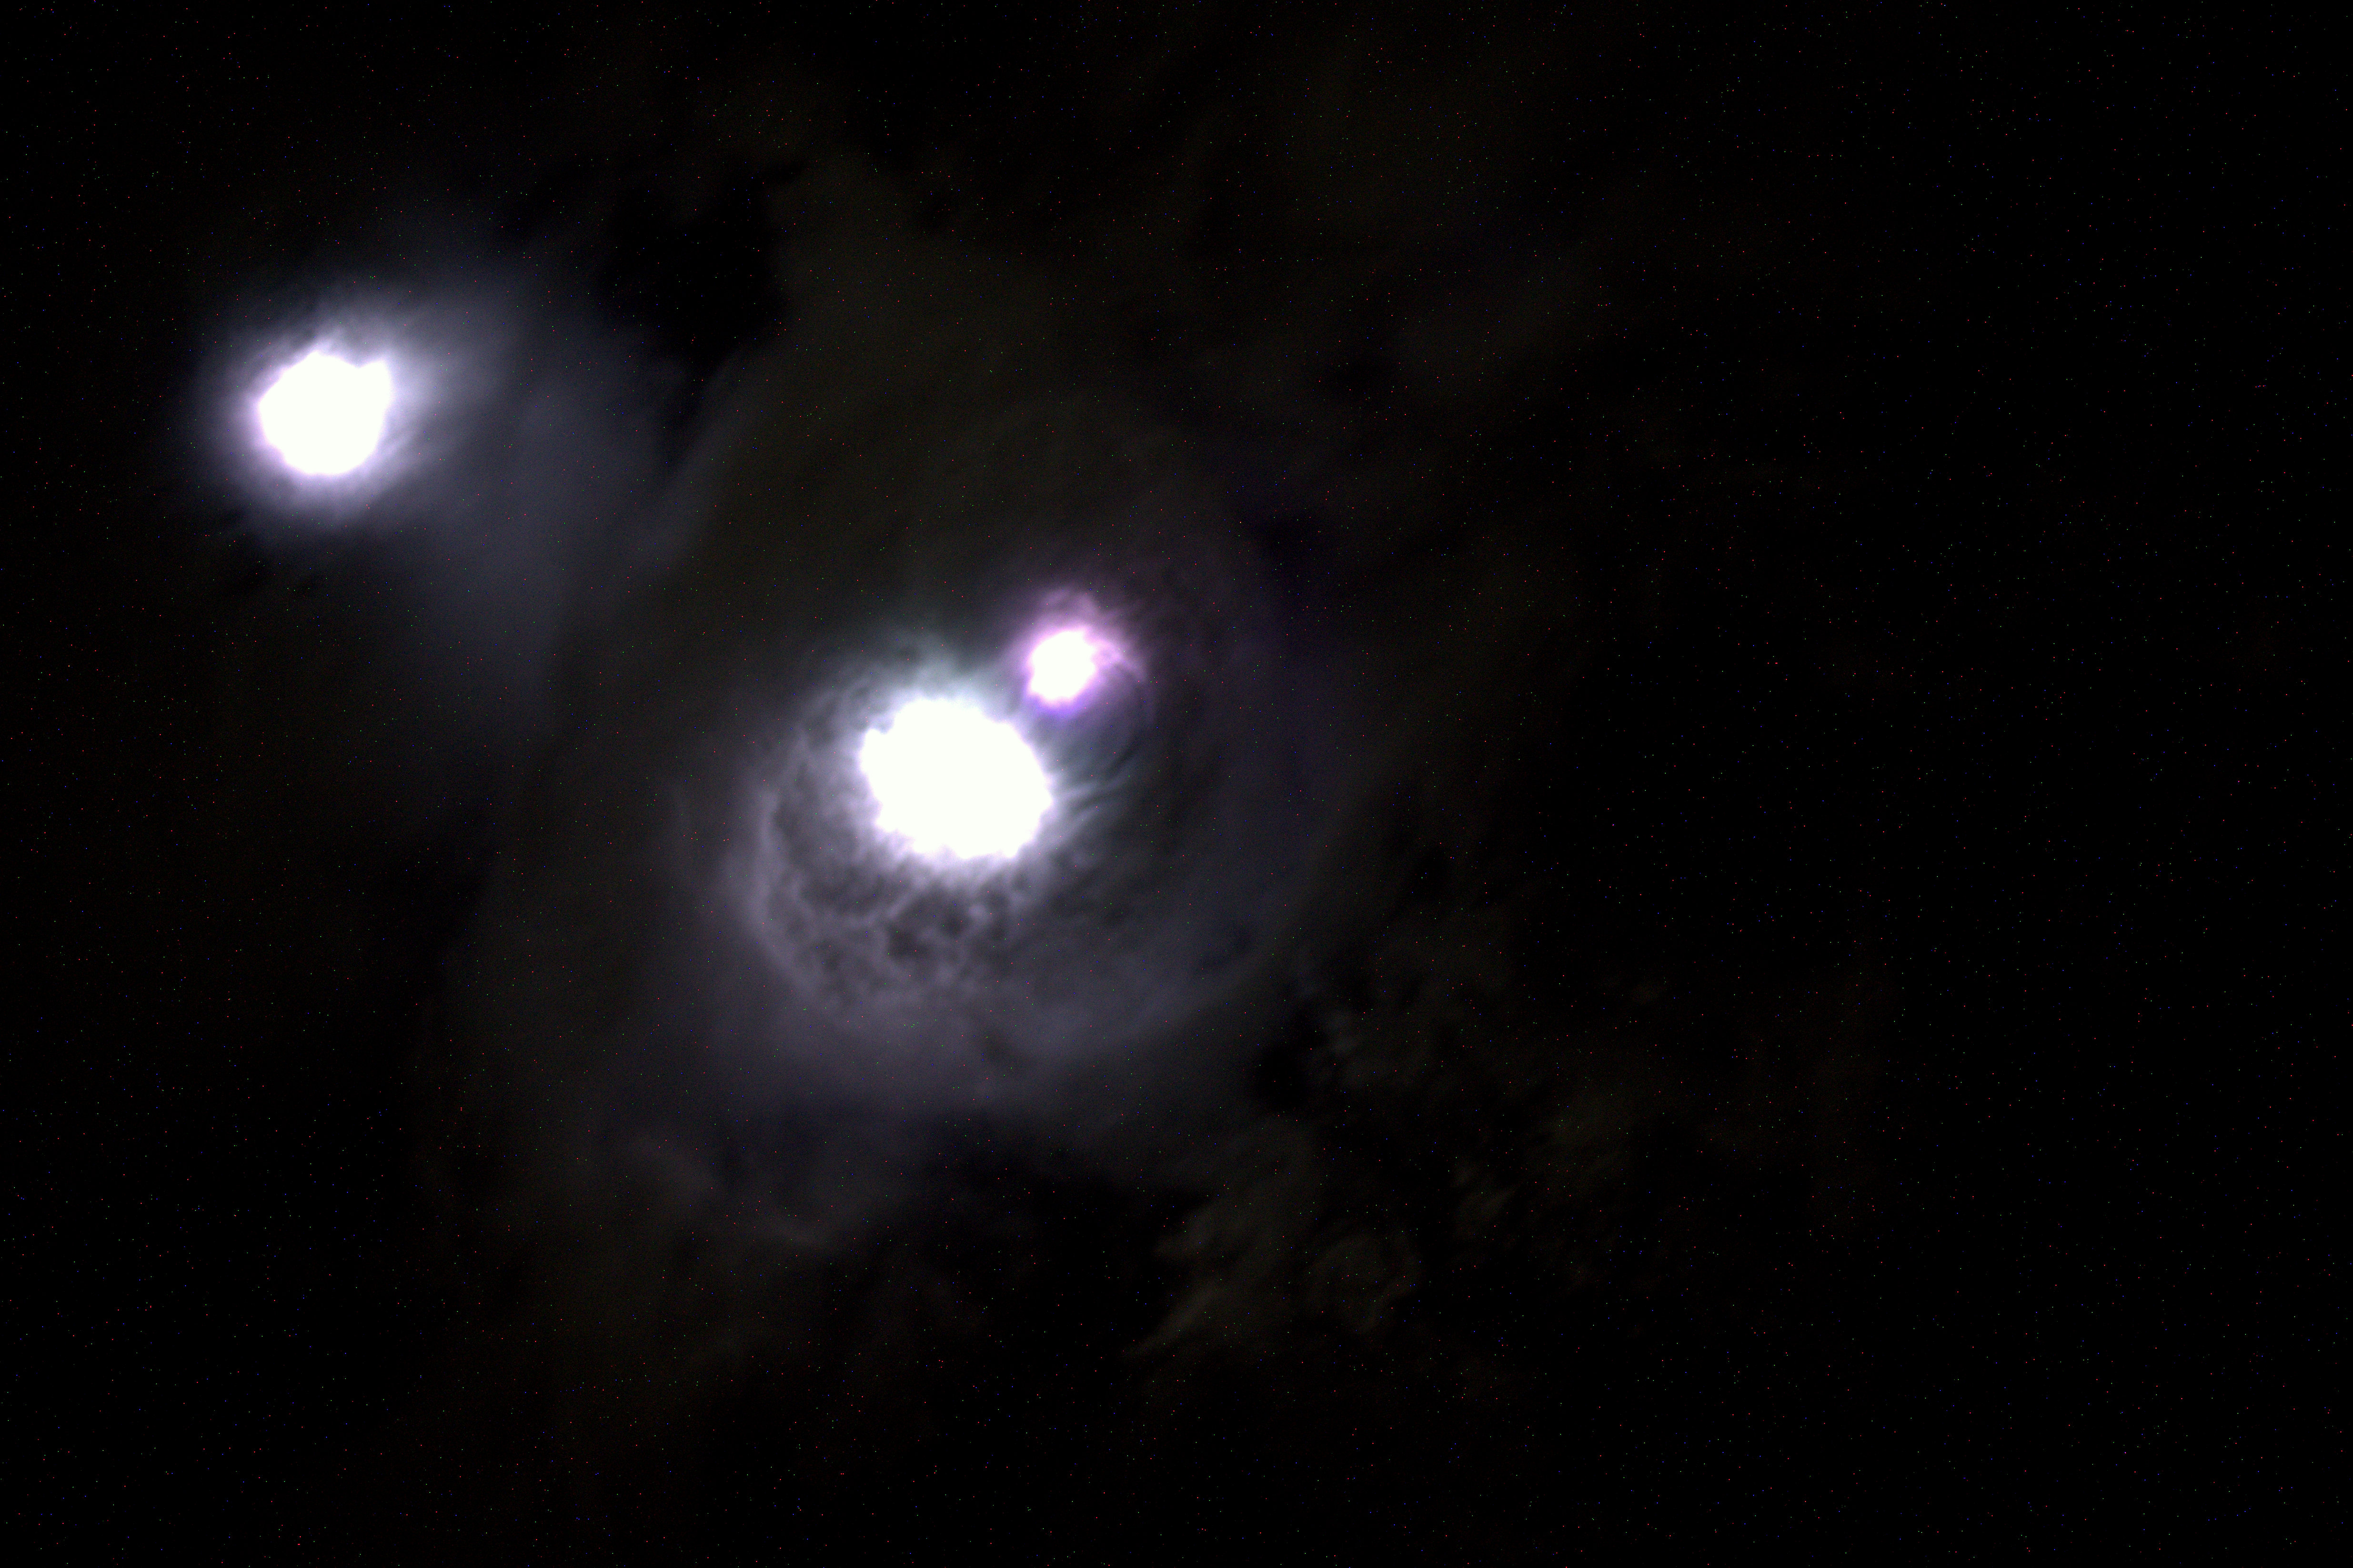
For years, their existence has been debated: elusive electrical discharges in the upper atmosphere that sport names such as red sprites, blue jets, pixies and elves. Reported by pilots, they are difficult to study as they occur above thunderstorms.

ESA astronaut Andreas Mogensen during his mission on the International Space Station in 2015 was asked to take pictures over thunderstorms with the most sensitive camera on the orbiting outpost to look for these brief features.

Denmark’s National Space Institute has now published the results, confirming many kilometre-wide blue flashes around 18 km altitude, including a pulsating blue jet reaching 40 km. A video recorded by Andreas as he flew over the Bay of Bengal at 28 800 km/h on the Station shows the electrical phenomena clearly – a first of its kind.

Andreas Mogensen captures gigantic lightning from the International Space Station
Youtube
 DTUBroadcast
 
Copyright: NASA

Satellites had probed these events but their viewing angle is not ideal for gathering data on the scale of the blue jets and smaller blue discharges. In contrast, the Station’s lower orbit is ideally placed to capture the sprites and jets. 

Andreas aimed for cloud turrets – cloud pillars extending into the upper atmosphere – and shot a 160 second video showing 245 blue flashes from the top of a turret that drifted from the Bay of Bengal’s thunderstorm.  

The blue discharges and jets are examples of a little-understood part of our atmosphere. Electrical storms reach into the stratosphere and have implications for how our atmosphere protects us from radiation.

Copyright: ESA/NASA 

Copyright: ESA

Permanent observation 

This experiment confirms that the Space Station is a suitable base for observing these phenomena. As a follow-up, the Atmosphere–Space Interactions Monitor is being prepared for launch later this year for installation outside Europe’s Columbus laboratory to monitor thunderstorms continuously to gather information about such ‘transient luminous events’.

Andreas concludes, “It is not every day that you get to capture a new weather phenomenon on film, so I am very pleased with the result – but even more so that researchers will be able to investigate these intriguing thunderstorms in more detail soon.

Source: ESA/IRISS

Friday, February 10, 2017

A spiral in Andromeda A spiral in Andromeda

Credit: ESA/Hubble & NASA


Not to be confused with our neighbouring Andromeda Galaxy, the Andromeda constellation is one of the 88 modern constellations. More importantly for this image, it is home to the pictured NGC 7640.

Many different classifications are used to identify galaxies by shape and structure — NGC 7640 is a barred spiral type. These are recognisable by their spiral arms, which fan out not from a circular core, but from an elongated bar cutting through the galaxy’s centre. Our home galaxy, the Milky Way, is also a barred spiral galaxy. NGC 7640 might not look much like a spiral in this image, but this is due to the orientation of the galaxy with respect to Earth — or to Hubble, which acted as photographer in this case! We often do not see galaxies face on, which can make features such as spiral arms less obvious. 

There is evidence that NGC 7640 has experienced some kind of interaction in its past. Galaxies contain vast amounts of mass, and therefore affect one another via gravity. Sometimes these interactions can be mild, and sometimes hugely dramatic, with two or more colliding and merging into a new, bigger galaxy. Understanding the history of a galaxy, and what interactions it has experienced, helps astronomers to improve their understanding of how galaxies — and the stars within them — form.

Source: ESA/ News

Thursday, February 09, 2017

Protostar displays a strange geometry


Figure 1: Integrated intensity distribution of CCH, superposed on the 0.8 mm dust continuum map. The infalling rotating envelope traced by CCH is broadened inward of the radius of about 150 au.Credit: Sakai et al. (RIKEN) .  Click to enlarge


One of the big puzzles in astrophysics is how stars like the sun manage to form from collapsing molecular clouds in star-forming regions of the universe. The puzzle is known technically as the angular momentum problem in stellar formation. The problem essentially is that the gas in the star-forming cloud have some rotation, which gives each element of the gas an amount of angular momentum. As they collapse inward, eventually they reach a state where the gravitational pull of the nascent star is balanced by the centrifugal force, so that they will no longer collapse inward of a certain radius unless they can shed some of the angular momentum. This point is known as the centrifugal barrier.

Now, using measurements taken by radio antennas, a group led by Nami Sakai of the RIKEN Star and Planet Formation Laboratory has found clues as to how the gas in the cloud can find their way to the forming star. To gain a better understanding of the process, Sakai and her group turned to the ALMA observatory, a network of 66 radio dishes located high in the Atacama Desert of northern Chile. The dishes are connected together in a carefully choreographed configuration so that they can provide images on radio emissions from protostellar regions around the sky. 

The group chose to observe a protostar designated as L1527, located in a nearby star-forming region known as the Taurus Molecular Cloud. The protostar, located about 450 light years away, has a spinning protoplanetary disk, almost edge-on to our view, embedded in a large envelope of molecules and dust. 

Previously, Sakai had discovered, from observations of molecules around the same protostar, that unlike the commonly held hypothesis, the transition from envelope to the inner disk--which later forms into planets--was not smooth but very complex. "As we looked at the observational data," says Sakai, "we realized that the region near the centrifugal barrier--where particles can no longer infall--is quite complex, and we realized that analyzing the movements in this transition zone could be crucial for understanding how the envelope collapses. Our observations showed that there is a broadening of the envelope at that place, indicating something like a 'traffic jam' in the region just outside the centrifugal barrier, where the gas heats up as the result of a shock wave. It became clear from the observations that a significant part of the angular momentum is lost by gas being cast in the vertical direction from the flattened protoplanetary disk that formed around the protostar."

Figure 2: Artist's impression of L1527
Credit: RIKEN 

This behavior accorded well with calculations the group had done using a purely ballistic model, where the particles behave like simple projectiles that do not need to be influenced by magnetic or other forces. 

According to Sakai, "We plan to continue to use observations from the powerful ALMA array to further refine our understanding of the dynamics of stellar formation and fully explain how matter collapses onto the forming star. This work could also help us to better understand the evolution of our own solar system."


Paper and Research team

These observation results were published as Sakai et al. "Vertical Structure of the Transition Zone from Infalling Rotating Envelope to Disk in the Class 0 Protostar, IRAS04368+2557" in the Monthly Notices of the Royal Astronomical Society in February 2017.

The research team members are:

Nami Sakai (The Institute of Physical and Chemical Research (RIKEN)), Yoko Oya (The University of Tokyo), Aya E. Higuchi (RIKEN), Yuri Aikawa (University of Tsukuba), Tomoyuki Hanawa (Chiba University), Cecilia Ceccarelli (Laboratoire d'Astrophysique de Grenoble), B. Lefloch (Laboratoire d'Astrophysique de Grenoble), Ana López-Sepulcre (The University of Tokyo / Institut de Radioastronomie Millimétrique), Yoshimasa Watanabe (The University of Tokyo), Takeshi Sakai (The University of Electro-Communications), Tomoya Hirota (National Astronomical Observatory of Japan), Emmanuel Caux (Universite de Toulouse), Charlotte Vastel (Universite de Toulouse), Claudine Kahane (Laboratoire d'Astrophysique de Grenoble), Satoshi Yamamoto (The University of Tokyo)

This research was supported by a Grant-in-Aid from the Japan Society for the Promotion of Science and the Ministry of Education, Culture, Sports, Science and Technology, Japan (No. 25400223, 25108005, 16H03964).

ALMA array from the air
Credit: Clem & Adri Bacri-Normier (wingsforscience.com)/ESO


ALMA


The Atacama Large Millimeter/submillimeter Array (ALMA), an international astronomy facility, is a partnership of the European Organisation for Astronomical Research in the Southern Hemisphere (ESO), the U.S. National Science Foundation (NSF) and the National Institutes of Natural Sciences (NINS) of Japan in cooperation with the Republic of Chile. ALMA is funded by ESO on behalf of its Member States, by NSF in cooperation with the National Research Council of Canada (NRC) and the National Science Council of Taiwan (NSC) and by NINS in cooperation with the Academia Sinica (AS) in Taiwan and the Korea Astronomy and Space Science Institute (KASI).

ALMA construction and operations are led by ESO on behalf of its Member States; by the National Radio Astronomy Observatory (NRAO), managed by Associated Universities, Inc. (AUI), on behalf of North America; and by the National Astronomical Observatory of Japan (NAOJ) on behalf of East Asia. The Joint ALMA Observatory (JAO) provides the unified leadership and management of the construction, commissioning and operation of ALMA.


Wednesday, February 08, 2017

NASA Finds Planets of Red Dwarf Stars May Face Oxygen Loss in Habitable Zones

In this artist’s concept, X-ray and extreme ultraviolet light from a young red dwarf star cause ions to escape from an exoplanet’s atmosphere. Scientists have developed a model that estimates the oxygen ion escape rate on planets around red dwarfs, which plays an important role in determining an exoplanet’s habitability. Credits: NASA Goddard/Conceptual Image Lab, Michael Lentz, animator/Genna Duberstein, producer. Download this video in HD formats from NASA Goddard's Scientific Visualization Studio


The search for life beyond Earth starts in habitable zones, the regions around stars where conditions could potentially allow liquid water – which is essential for life as we know it – to pool on a planet’s surface. New NASA research suggests some of these zones might not actually be able to support life due to frequent stellar eruptions – which spew huge amounts of stellar material and radiation out into space – from young red dwarf stars.

Now, an interdisciplinary team of NASA scientists wants to expand how habitable zones are defined, taking into account the impact of stellar activity, which can threaten an exoplanet’s atmosphere with oxygen loss. This research was published in The Astrophysical Journal Letters on Feb. 6, 2017.

"If we want to find an exoplanet that can develop and sustain life, we must figure out which stars make the best parents,” said Vladimir Airapetian, lead author of the paper and a solar scientist at NASA’s Goddard Space Flight Center in Greenbelt, Maryland. “We’re coming closer to understanding what kind of parent stars we need.”

To determine a star’s habitable zone, scientists have traditionally considered how much heat and light the star emits. Stars more massive than our sun produce more heat and light, so the habitable zone must be farther out. Smaller, cooler stars yield close-in habitable zones.

But along with heat and visible light, stars emit X-ray and ultraviolet radiation, and produce stellar eruptions such as flares and coronal mass ejections – collectively called space weather. One possible effect of this radiation is atmospheric erosion, in which high-energy particles drag atmospheric molecules – such as hydrogen and oxygen, the two ingredients for water – out into space. Airapetian and his team's new model for habitable zones now takes this effect into account.

The search for habitable planets often hones in on red dwarfs, as these are the coolest, smallest and most numerous stars in the universe – and therefore relatively amenable to small planet detection.

"On the downside, red dwarfs are also prone to more frequent and powerful stellar eruptions than the sun," said William Danchi, a Goddard astronomer and co-author of the paper. "To assess the habitability of planets around these stars, we need to understand how these various effects balance out."

Another important habitability factor is a star's age, say the scientists, based on observations they've gathered from NASA’s Kepler mission. Every day, young stars produce superflares, powerful flares and eruptions at least 10 times more powerful than those observed on the sun. On their older, matured counterparts resembling our middle-aged sun today, such superflares are only observed once every 100 years.

“When we look at young red dwarfs in our galaxy, we see they’re much less luminous than our sun today,” Airapetian said. “By the classical definition, the habitable zone around red dwarfs must be 10 to 20 times closer-in than Earth is to the sun. Now we know these red dwarf stars generate a lot of X-ray and extreme ultraviolet emissions at the habitable zones of exoplanets through frequent flares and stellar storms.”

Superflares cause atmospheric erosion when high-energy X-ray and extreme ultraviolet emissions first break molecules into atoms and then ionize atmospheric gases. During ionization, radiation strikes the atoms and knocks off electrons. Electrons are much lighter than the newly formed ions, so they escape gravity’s pull far more readily and race out into space.

Opposites attract, so as more and more negatively charged electrons are generated, they create a powerful charge separation that lures positively charged ions out of the atmosphere in a process called ion escape.

“We know oxygen ion escape happens on Earth at a smaller scale since the sun exhibits only a fraction of the activity of younger stars,” said Alex Glocer, a Goddard astrophysicist and co-author of the paper. “To see how this effect scales when you get more high-energy input like you’d see from young stars, we developed a model.”

The model estimates the oxygen escape on planets around red dwarfs, assuming they don’t compensate with volcanic activity or comet bombardment. Various earlier atmospheric erosion models indicated hydrogen is most vulnerable to ion escape. As the lightest element, hydrogen easily escapes into space, presumably leaving behind an atmosphere rich with heavier elements such as oxygen and nitrogen.

But when the scientists accounted for superflares, their new model indicates the violent storms of young red dwarfs generate enough high-energy radiation to enable the escape of even oxygen and nitrogen – building blocks for life’s essential molecules. 

“The more X-ray and extreme ultraviolet energy there is, the more electrons are generated and the stronger the ion escape effect becomes,” Glocer said. “This effect is very sensitive to the amount of energy the star emits, which means it must play a strong role in determining what is and is not a habitable planet.”

Considering oxygen escape alone, the model estimates a young red dwarf could render a close-in exoplanet uninhabitable within a few tens to a hundred million years. The loss of both atmospheric hydrogen and oxygen would reduce and eliminate the planet’s water supply before life would have a chance to develop.

“The results of this work could have profound implications for the atmospheric chemistry of these worlds,” said Shawn Domagal-Goldman, a Goddard space scientist not involved with the study. “The team’s conclusions will impact our ongoing studies of missions that would search for signs of life in the chemical composition of those atmospheres.”

Modeling the oxygen loss rate is the first step in the team’s efforts to expand the classical definition of habitability into what they call space weather-affected habitable zones. When exoplanets orbit a mature star with a mild space weather environment, the classical definition is sufficient. When the host star exhibits X-ray and extreme ultraviolet levels greater than seven to 10 times the average emissions from our sun, then the new definition applies. The team’s future work will include modeling nitrogen escape, which may be comparable to oxygen escape since nitrogen is just slightly lighter than oxygen.

The new habitability model has implications for the recently discovered planet orbiting the red dwarf Proxima Centauri, our nearest stellar neighbor. Airapetian and his team applied their model to the roughly Earth-sized planet, dubbed Proxima b, which orbits Proxima Centauri 20 times closer than Earth is to the sun.

Considering the host star’s age and the planet’s proximity to its host star, the scientists expect that Proxima b is subjected to torrents of X-ray and extreme ultraviolet radiation from superflares occurring roughly every two hours. They estimate oxygen would escape Proxima b’s atmosphere in 10 million years. Additionally, intense magnetic activity and stellar wind – the continuous flow of charged particles from a star – exacerbate already harsh space weather conditions. The scientists concluded that it’s quite unlikely Proxima b is habitable.   

“We have pessimistic results for planets around young red dwarfs in this study, but we also have a better understanding of which stars have good prospects for habitability,” Airapetian said. “As we learn more about what we need from a host star, it seems more and more that our sun is just one of those perfect parent stars, to have supported life on Earth.”


Related:


Editor: Rob Garner


Tuesday, February 07, 2017

XJ1500+0154: Black Hole Meal Sets Record for Length and Size

XJ1500+0154
Credit: X-ray: NASA/CXC/UNH/D.Lin et al, Optical: CFHT,
 Illustration: NASA/CXC/M.Weiss


A Quick Look at XJ1500+0154

A trio of X-ray observatories has captured a remarkable event in their data: a decade-long binge by a black hole almost two billion light years away. This discovery was made using data from NASA's Chandra X-ray Observatory, Swift Observatory, and ESA's XMM-Newton, as reported in our press release

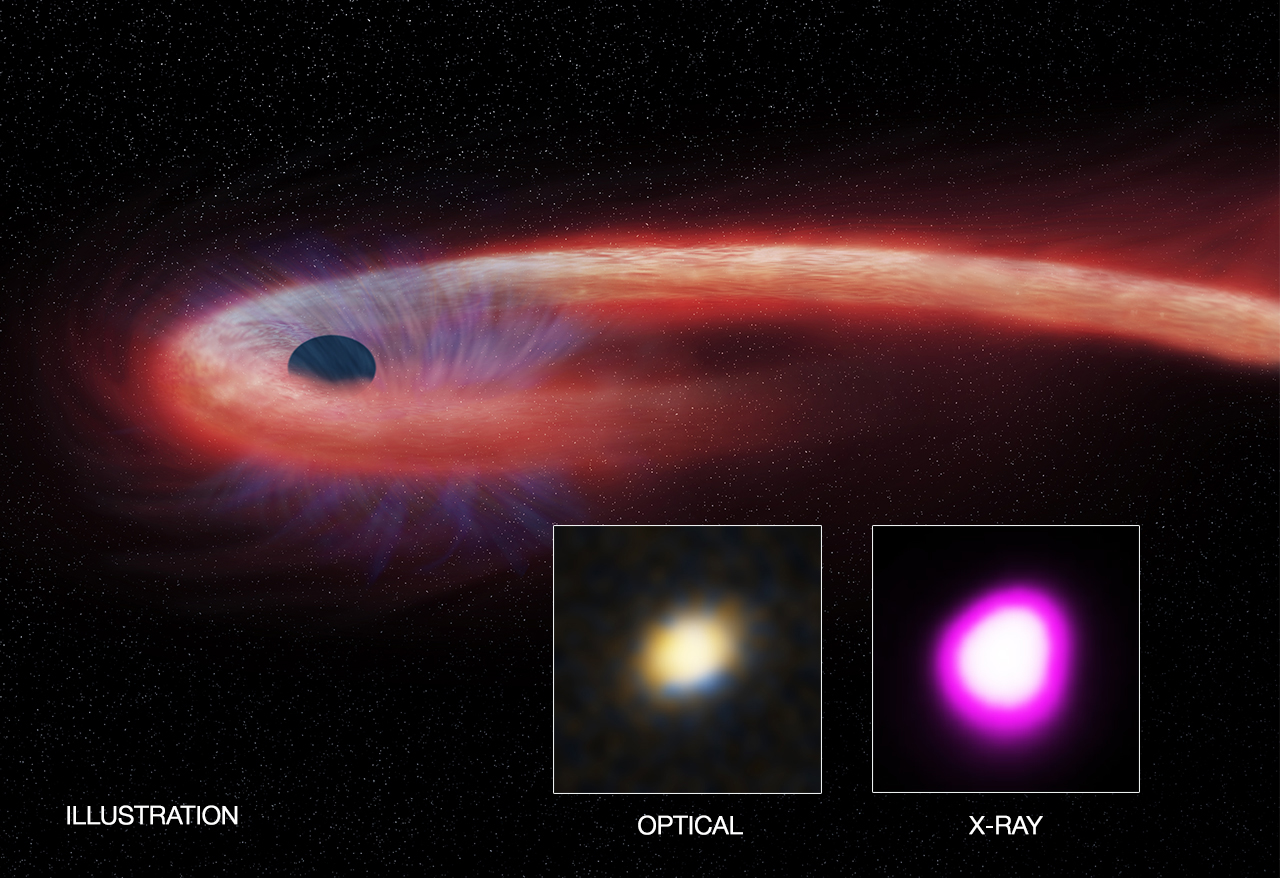
This artist's illustration depicts what astronomers call a "tidal disruption event," or TDE. This is when an object, such as a star, wanders too close to a black hole and is destroyed by tidal forces generated from the black hole's intense gravitational forces. During a TDE, some of the stellar debris is flung outward at high speeds, while the rest (shown as the red material in the illustration) becomes hotter as it falls toward the black hole, generating a distinct X-ray flare. A wind blowing away from this infalling material is shown in blue. 

Among observed TDEs, this event involved either the most massive star to be completely ripped apart and devoured by a black hole or the first instance where a smaller star was completely ripped apart. The resulting X-ray source is known as XJ1500+154 and is located in a small galaxy about 1.8 billion light years from Earth. The optical image in the left inset shows this galaxy and a cross to mark the location of XJ1500+0154. This image reveals that XJ1500+0154 is found in the center of the galaxy, implying that the source likely originates from a supermassive black hole that resides there. The image on the right shows XJ1500+0154 in the Chandra image covering the same field. 

The source was not detected in a Chandra observation on April 2, 2005, but was detected in an XMM-Newton observation on July 23, 2005, and reached peak brightness in a Chandra observation on June 5, 2008. These observations show that the source became at least 100 times brighter in X-rays. Since then, Chandra, Swift, and XMM-Newton have observed it multiple times. 

The X-ray data also indicate that radiation from material surrounding this black hole has consistently surpassed the so-called Eddington limit, defined by a balance between the outward pressure of radiation from the hot gas and the inward pull of the gravity of the black hole.

This TDE may help answer the question as to how supermassive black holes in the early universe grow. If supermassive black holes can grow, from TDEs or other means, at rates above those corresponding to the Eddington limit, this could explain how supermassive black holes were able to reach masses about a billion times higher than the sun when the universe was only about a billion years old. 

A paper describing these results appears in the February 6th issue of Nature Astronomy. The authors are Dacheng Lin (University of New Hampshire), James Guillochon (Harvard-Smithsonian Center for Astrophysics), Stefanie Komossa (QianNan Normal University for Nationalities), Enrico Ramirez-Ruiz (University of California, Santa Cruz), Jimmy Irwin (University of Alabama), Peter Maksym (Harvard-Smithsonian), Dirk Grupe (Morehead State University), Olivier Godet (CNRS), Natalie Webb (CNRS), Didier Barret (CNRS), Ashley Zauderer (New York University), Pierre-Alain Duc (CEA-Saclay), Eleazar Carrasco (Gemini Observatory), and Stephen Gwyn (Herzberg Institute of Astrophysics). 

NASA's Marshall Space Flight Center in Huntsville, Alabama, manages the Chandra program for NASA's Science Mission Directorate in Washington. The Smithsonian Astrophysical Observatory in Cambridge, Massachusetts, controls Chandra's science and flight operations.


Fast Facts for XJ1500+0154:

Scale: Inset images are 11 arcsec across (about about 92,000 light years)
Category: Quasars & Active Galaxies
Coordinates (J2000): RA 15h 00m 52.10s | Dec Dec: +01 54 53.00
Constellation: Virgo
Observation Date: 23 Feb 2015
Observation Time: 10 hours
Obs. ID: 6601
Instrument: ACIS
References: Lin, D. et al, 2017, Nature Astronomy (accepted)
Color Code: X-ray (Pink); Optical (Red, Green, Blue)  
Distance Estimate: About 1.8 billion light years


Monday, February 06, 2017

An Intrinsically Very Luminous Lensed High-Redshift Galaxy

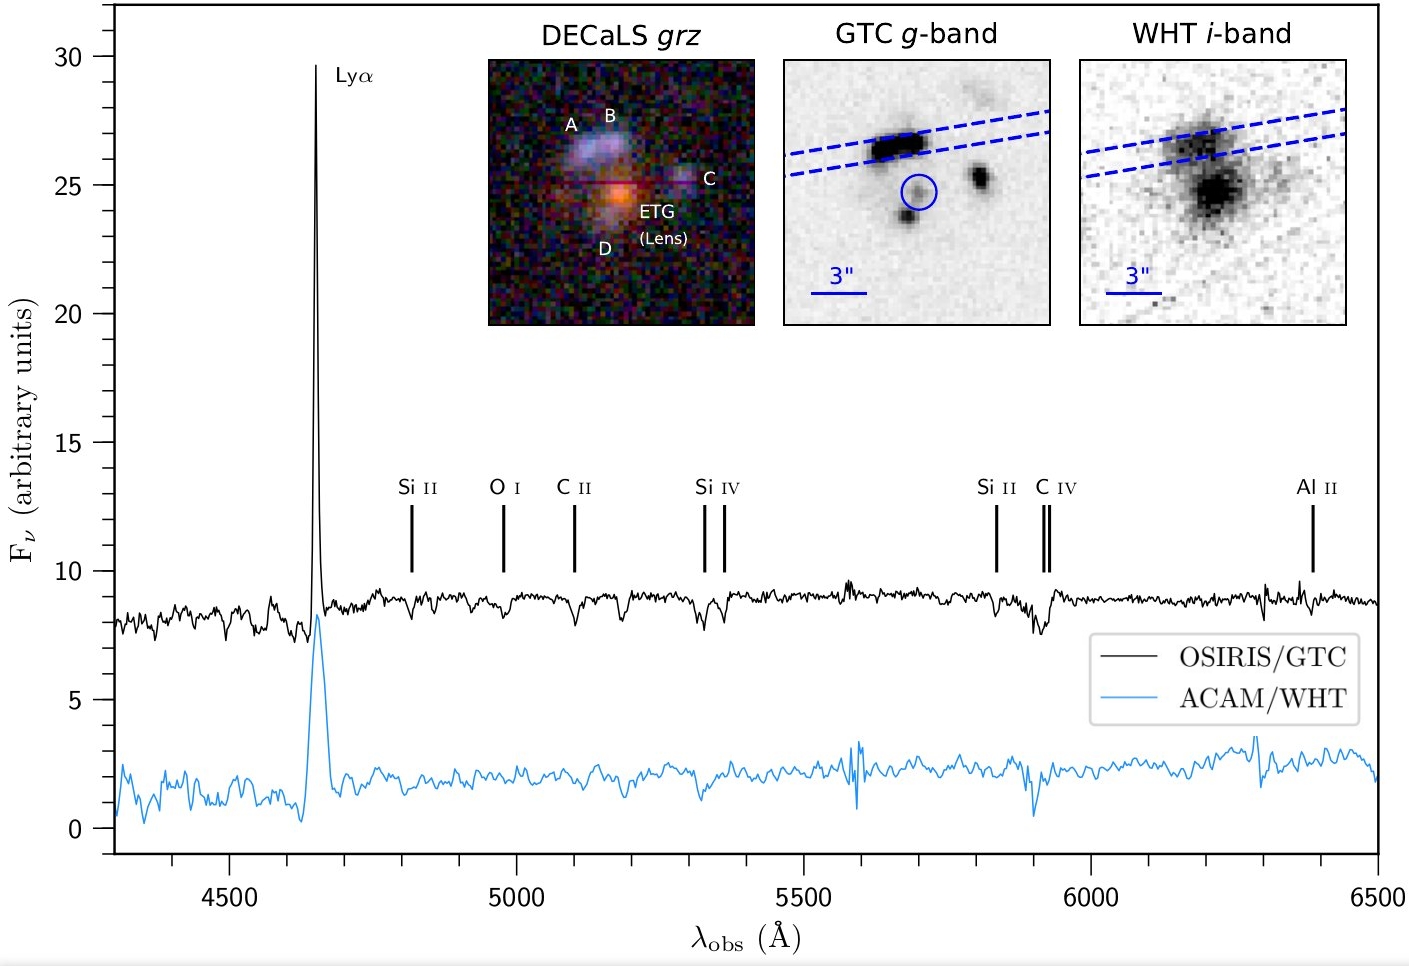
WHT and GTC imaging and spectra of BG1429+1202 as well as colour image from the Dark Energy Camera Legacy Survey (DECaLS). The locations of the long-slits of the spectroscopic observations with WHT/ACAM and GTC/OSIRIS as well as the BOSS fibre are shown. Large format: JPG


An international team led by researchers from the Instituto de Astrofísica de Canarias (IAC) and the University of La Laguna (ULL) has discovered one of the brightest non-active galaxies in the early universe. 

This galaxy, called BG1429+1202, is located at a redshift of 2.82 and it is a gravitationally lensed Lyman-Alpha Emitter (LAE) from the Bells Gallery project. Although, in general, LAEs are faint, BG1429+1202 is intrinsically very luminous. Additionally, its flux is boosted by a factor of about nine by gravitational lensing by a massive elliptical galaxy in the line of sight at redshift 0.55. 

BG1429+1202 was selected for observations using ACAM at the William Herschel Telescope (WHT) from a large sample of lensed LAE candidates discovered using the Sloan Digital Sky Survey BOSS spectroscopic database. "This is one of the few known cases of galaxies with a very high apparent brightness and also an intrinsically high luminosity", says Rui Marques-Chaves, a doctoral student at the IAC-ULL. 

To study this system, astronomers applied for a few hours of Director's Discretionary Time (DDT) at the WHT. They expected to detect a very bright continuum and Lyman-alpha emission from the blue features around the foreground galaxy visible on the Sloan Digital Sky Survey images, and that's actually what they already saw in the first 15-minute ACAM spectrum. BG1429+1202 is so bright that it can even be detected on the photographic images of the Digital Sky Survey. 

Motivated by the promising results of the WHT observations, the team applied for DDT time at the Gran Telescopio Canarias (GTC). Observations were carried out just one month after the WHT data were obtained, and provided higher signal-to-noise imaging and low-resolution spectroscopy of the brightest lensed features. 

Lens modeling of this system revealed the main properties of the high-redshift LAE. Ismael Pérez-Fournon, from the IAC and ULL and coordinator of this project says, "Its luminosity and the star formation rate are much higher in the rest-frame UV continuum and in the Lyman-alpha line than in typical LAEs at high redshift. With telescopes such as the GTC or the WHT we can observe these high-redshift galaxies because they are gravitationally lensed. If they weren't, then we would need a future telescope, such as the Extremely Large European Telescope (E-ELT) or the Thirty Meter Telescope (TMT), to study them in detail." 

To select lensed-LAEs like BG1429+1202, astronomers analysed around a million and a half spectra of galaxies obtained using the Sloan Telescope. Lyman-alpha emission was detected from galaxies much further away than their lenses in 187 cases, of which 21 have been observed with the Hubble Space Telescope. Those observations confirm that the majority of these objects are indeed gravitationally lensed. 

"Via these same techniques, future data sets from projects such as WHT/WEAVE and the Dark Energy Spectroscopic Instrument (DESI) will lead to the discovery of many more types of lensed systems at all redshifts", concludes Adam Bolton, Associate Director of the NOAO and an author on this research.

More information:

Rui Marques-Chaves, Ismael Pérez-Fournon, Yiping Shu, Paloma I. Martínez-Navajas, Adam S. Bolton, Christopher S. Kochanek, Masamune Oguri, Zheng Zheng, Shude Mao, Antonio D. Montero-Dorta, Matthew A. Cornachione, and Joel R. Brownstein, 2017, "Discovery of a very bright and intrinsically very luminous, strongly lensed Ly-alpha emitting galaxy at z = 2.82 in the BOSS Emission-Line Lens Survey", ApJL, 834, L18 [ ADS ].

"Discovered one of the brightest distant galaxies so far known", IAC Press Release, 17 Jan 2017.

"17 New Strong Gravitational Lenses Discovered by NAOC Researchers Using HST Data", NAOC Press Release.

Contact:  

Javier Méndez
(Public Relations Officer)


Constraining theories of gravity using the large-scale distribution of galaxies

Figure 1: Schematic representation of the DGP brane model. Matter and radiation are confined to the four-dimensional brane, but the gravitational interaction is free to propagate out into the additional fifth dimension. Credit: © MPA


The origin of the current accelerated expansion of the Universe remains one of the major unsolved mysteries in physics today. While this could be a sign of the mysterious “Dark Energy”, this puzzling observation might also be evidence for the inadequacy of Einstein’s theory of General Relativity (GR) to describe the law of gravity on very large cosmological scales. These considerations would have strong implications on our understanding of fundamental physics, warranting dedicated studies such as the one undertaken recently by researchers at MPA and MPE. In this work, the authors created mock universes with non-GR theories of gravity to test the validity of current observational methods to determine the rate at which structures grow in the Universe. This allowed them to place bounds on how much the current data allows the Universe to depart from Einstein’s prediction. Reassuringly, current observational methods do not show evidence for a biased performance when tested on mock universes with modified gravity.

Dark energy and modified gravity

Almost twenty years ago, astronomers observed that the light emitted by distant Type Ia supernovae explosions is even fainter than was expected. This extra dimming provided the first evidence for the accelerated expansion of the Universe. Soon after these observational data were presented to the astronomical community, it became clear that an explanation would require new physics. One way out of the problem consists in adding a new term to Einstein’s field equations: some exotic forms of ”dark energy” or a cosmological constant, which act as sources that drive the accelerated expansion. Another explanation consists in noting that General Relativity is not nearly as well tested on cosmological scales as it is in our Solar System, and that the acceleration could be simply due to the different nature of gravity on very large scales. This has motivated several recent studies on modified gravity models (as non-GR theories are collectively known) and their cosmological predictions; making this one of the most active areas in cosmology today.

Braneworld gravity models

One of the most popular modified gravity scenarios is that of "braneworlds". In these theories, the four-dimensional spacetime we live in (3 space + 1 time dimension) is just a slice, or "brane", of a higher dimensional spacetime. One concrete example is the Dvali-Gabadadze-Porrati (DGP) model, where we live in a four-dimensional brane of a five-dimensional "bulk" spacetime.

Figure 1 shows a cartoon that summarizes the idea behind these models: matter and radiation are confined to the brane, but the gravitational interaction can "leak" out of the brane into the higher dimension(s). This leakage modifies how gravity operates in the brane, thereby permitting deviations from General Relativity to occur. A crucial point to bear in mind is that the modifications to General Relativity should only occur on distance scales much larger than the Solar System, otherwise these models would be immediately ruled out by the very precise tests performed in our solar neighbourhood, which confirm the validity of General Relativity extremely well.

Measuring the growth rate of structure

Cosmologists have defined the growth rate of structure as a quantity that measures how fast large lumps of matter merge with one another in the Universe causing structure to gradually grow over cosmic time. The stronger the gravitational interaction, the faster the growth rate will be. Precise and accurate determinations of the growth rate therefore are a very good probe to test gravity.

The growth rate however cannot be directly measured by pointing a telescope at the sky. Instead, it can only be determined through complex and advanced modelling of the observed clustering pattern of galaxies on large scales. A worry then emerges: if the processing of the galaxy clustering data is faulty, the resulting growth rate measurements are shifted away from the true value. Consequently, we would be drawing wrong conclusions about the various theories of gravity. Therefore, to guard against this worry, the modelling techniques for real data are validated against mock observations based on N-body simulations of structure formation in the Universe. In this way, we can test the validity of the observational pipelines in a controlled setup, in which we know the real answer.

A major shortcoming of previous validation tests was that they were only applied to simulations based on General Relativity. The validity of the same techniques with respect to other theories of gravity remained uncertain. Researchers at MPA and MPE have now, for the first time, undertaken a thorough validation of these observational analysis pipelines by testing them on mock observations constructed from N-body simulations of DGP brane models with varying degrees of departure from General Relativity. The mock galaxy catalogues were designed to be fair descriptions of the galaxy samples from the BOSS survey, the largest galaxy survey to date in terms of the number of galaxies and the volume of the Universe covered.

Tight constraints on DGP gravity

First, the scientists ensured that the modelling steps for determining the growth rate from the data remain valid even in the case of DGP gravity. Then, the authors used the latest data from the BOSS survey to constrain the model. In doing so, it has become standard to focus on a subset of the DGP gravity model to place benchmark constraints on departures from General Relativity. This standard toy model is known as nDGP ("n" for normal) and automatically passes Solar System tests of gravity as well as constraints from geometrical probes sensitive to the expansion rate of the Universe.

Figure 2: Growth rate as a function of cosmic time. The purple squares show the measurements from the final Data Release 12 of the BOSS galaxy survey. The thin lines are colour coded by the crossover scale, please note that the scale is logarithmic. The thick black line shows the result for crossover scale ≈ 1, which marks the so-called 95% confidence limit: given the data, the "true" curve is below the thick black one with 95% probability. This represents the tightest observational constraint on this model to date. The thick red line shows the result from General Relativity. Credit: © MPA
 

The main source of constraining power therefore is the data which probes structure formation on large scales. Figure 2 illustrates how the growth rate data can constrain the nDGP model. The growth rate is shown as a function of cosmic time for several values of the so-called "crossover scale", a parameter that basically determines the distance above which gravity starts to leak out of the brane. Smaller values of the crossover scale lead to stronger gravity, pushing the prediction away from the data, while larger values bring the nDGP model closer to General Relativity – and to a better agreement with the measurements from BOSS.

One of the main conclusions of this work is that, reassuringly, current observational methods do not show evidence for a biased performance when tested on mock universes with nDGP gravity. This constitutes a very much needed test of the validity of current observational analyses, which ensures that current data on the growth rate can be used to test the nDGP model (as well as a plethora of other theories with similar phenomenology).


Original Publication

1. Alexandre Barreira, Ariel G. Sánchez, Fabian Schmidt

Validating estimates of the growth rate of structure with modified gravity simulations

Barreira, Alexandre
Postdoc
Phone: 2241
Email: barreira@mpa-garching.mpg.de 


Saturday, February 04, 2017

NuSTAR Helps Solve 'Rapid Burster' Mystery

These four images show an artist's impression of gas accreting onto the neutron star in the binary system MXB 1730-335, also known as the "Rapid Burster." Image credit: ESA/ATG medialab  › Full image and caption


Scientists observing a neutron star in the "Rapid Burster" system may have solved a 40-year-old mystery surrounding its puzzling X-ray bursts.

Discovered in the 1970s, the Rapid Burster is a binary system comprising a low-mass star in its prime and a neutron star -- the compact remnant of a massive star's demise. The gravitational pull of the neutron star strips its companion of some of its gas, which then forms an accretion disk and spirals toward the neutron star.

Most neutron star binary systems continuously release large amounts of X-rays, punctuated by additional X-ray flashes every few hours or days. But scientists have wondered for decades about what accounts for the Rapid Burster's sudden, erratic and extremely intense X-ray emissions -- a phenomenon seen only in one other binary system.

In the new study, researchers discovered that the neutron star's magnetic field creates a gap between the star and the disk around it, largely preventing it from feeding on matter from its stellar companion. Gas builds up until, under certain conditions, it hits the neutron star all at once, producing intense flashes of X-rays.

The new results provide the first evidence for what causes these so-called "type-II" bursts. The discovery was made with the European Space Agency's XMM-Newton mission and NASA's NuSTAR (Nuclear Spectroscopic Telescope Array) and Swift missions.

Full ESA story


News Media Contact

Elizabeth Landau
Jet Propulsion Laboratory, Pasadena, Calif.
818-354-6425
elizabeth.landau@jpl.nasa.gov

Jakob van den Eijnden
Anton Pannekoek Institute for Astronomy, University of Amsterdam, The Netherlands
a.j.vandeneijnden@uva.nl
+31-6-4816-3504

Additional contacts:

Nathalie Degenaar/Anton Pannekoek Institute for Astronomy, University of Amsterdam, The Netherlands--degenaar@uva.nl
+31-20-525-3994

Norbert Schartel/European Space Agency, Villanueva de la Cañada (Madrid)
Norbert.Schartel@esa.int
 +34-91-8131-184

Written by C. Mignone/ESA 

Source: JPL-Caltech

Friday, February 03, 2017

The Calabash clash

Calabash Nebula, OH 231.84 +4.22
Credit: ESA/Hubble & NASA
Acknowledgement: Judy Schmidt
 Hi-res image Tif/JPG


The Calabash Nebula, pictured here — which has the technical name OH 231.8+04.2 — is a spectacular example of the death of a low-mass star like the Sun. This image taken by the NASA/ESA Hubble Space Telescope shows the star going through a rapid transformation from a red giant to a planetary nebula, during which it blows its outer layers of gas and dust out into the surrounding space. The recently ejected material is spat out in opposite directions with immense speed — the gas shown in yellow is moving close to a million kilometres an hour.

Astronomers rarely capture a star in this phase of its evolution because it occurs within the blink of an eye — in astronomical terms. Over the next thousand years the nebula is expected to evolve into a fully fledged planetary nebula.

The nebula is also known as the Rotten Egg Nebula because it contains a lot of sulphur, an element that, when combined with other elements, smells like a rotten egg — but luckily, it resides over 5000 light-years away in the constellation of Puppis (The Poop deck).

Source:

Thursday, February 02, 2017

Celestial Cat Meets Cosmic Lobster

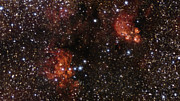
The Cat’s Paw and Lobster Nebulae

PR Image eso1705b
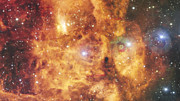
Highlights from VST image of Cat’s Paw and Lobster Nebulae

PR Image eso1705c
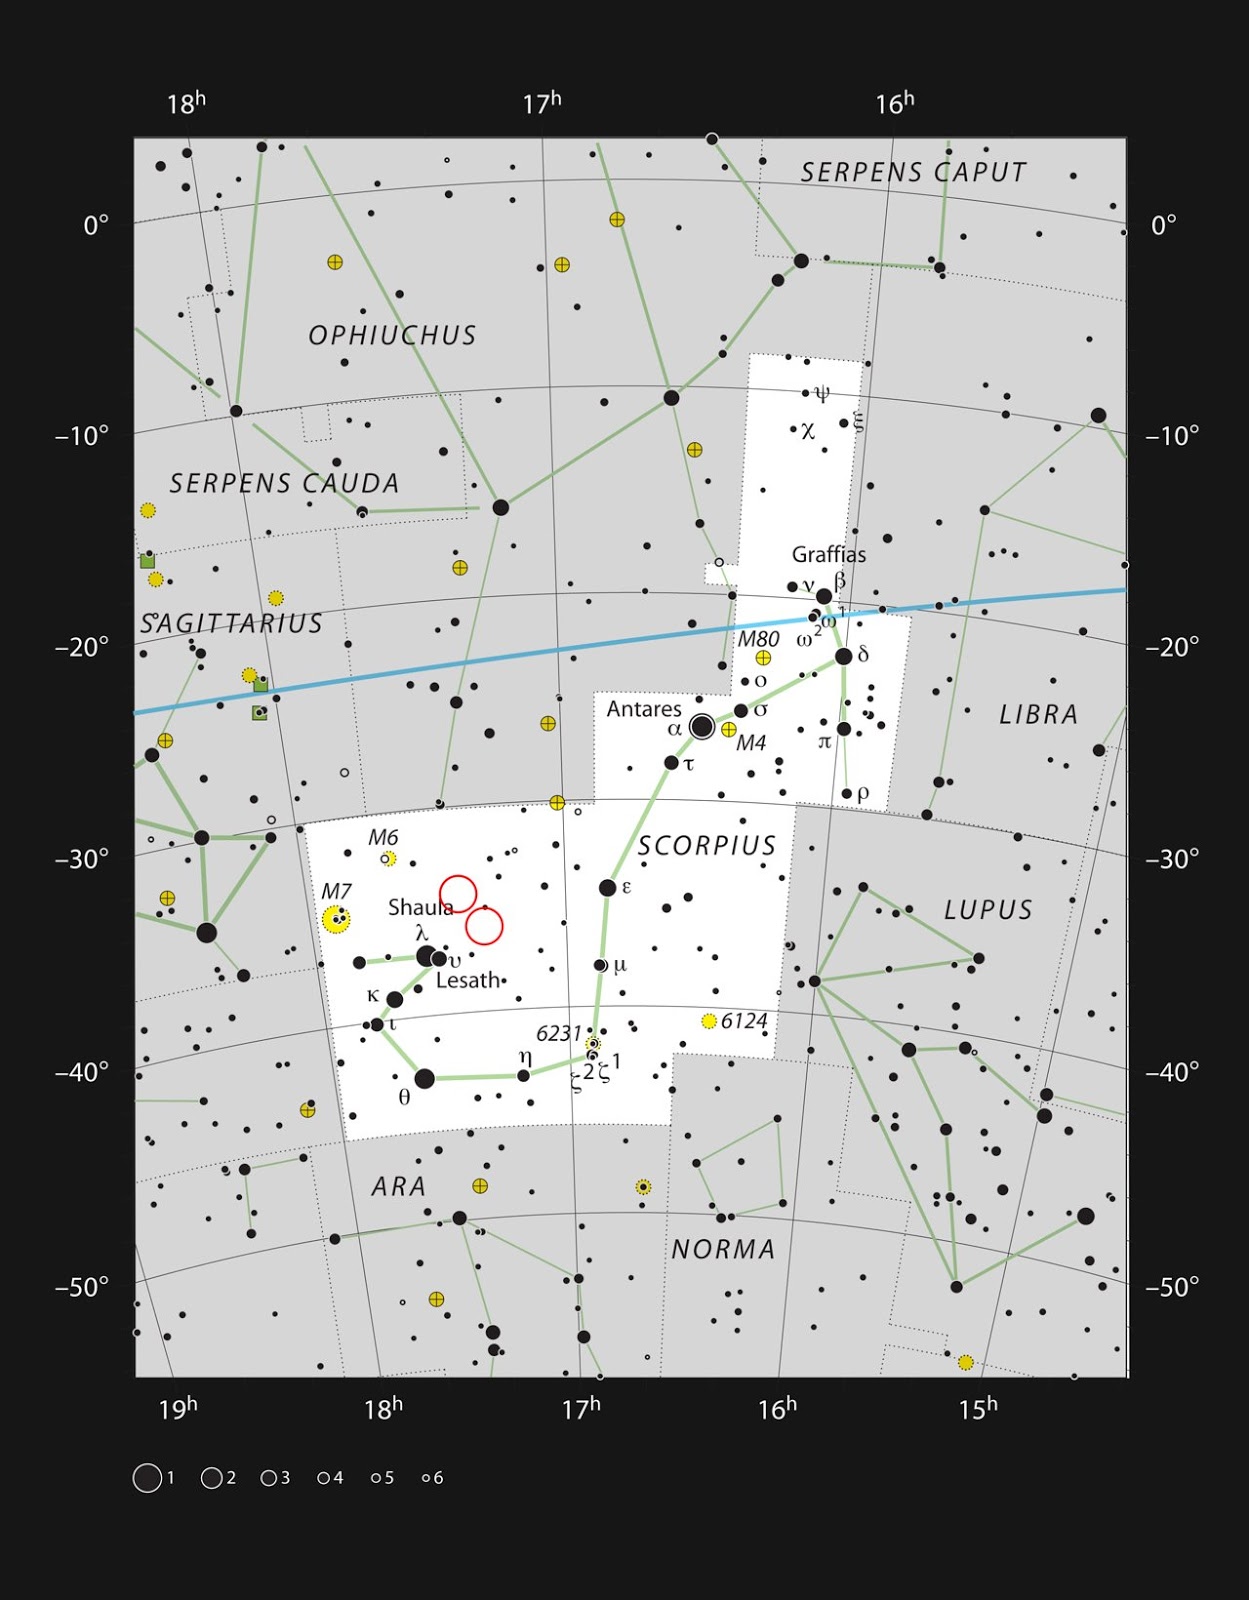
The star formation regions NGC 6334 and NGC 6357 in the constellation of Scorpius


Videos
 
ESOcast 94 Light: Celestial Cat Meets Cosmic Lobster 4K UHD

Zooming in on the Cat’s Paw and Lobster Nebulae

Panning across the Cat’s Paw and Lobster Nebulae


Astronomers have for a long time studied the glowing, cosmic clouds of gas and dust catalogued as NGC 6334 and NGC 6357, this gigantic new image from ESO’s Very Large Telescope Survey Telescope being only the most recent one. With around two billion pixels this is one of the largest images ever released by ESO. The evocative shapes of the clouds have led to their memorable names: the Cat’s Paw Nebula and the Lobster Nebula, respectively. 

NGC 6334 is located about 5500 light-years away from Earth, while NGC 6357 is more remote, at a distance of 8000 light-years. Both are in the constellation of Scorpius (The Scorpion), near the tip of its stinging tail.

The British scientist John Herschel first saw traces of the two objects, on consecutive nights in June 1837, during his three-year expedition to the Cape of Good Hope in South Africa. At the time, the limited telescopic power available to Herschel, who was observing visually, only allowed him to document the brightest “toepad” of the Cat’s Paw Nebula. It was to be many decades before the true shapes of the nebulae became apparent in photographs — and their popular names coined.

The three toepads visible to modern telescopes, as well as the claw-like regions in the nearby Lobster Nebula, are actually regions of gas — predominantly hydrogen — energised by the light of brilliant newborn stars. With masses around 10 times that of the Sun, these hot stars radiate intense ultraviolet light. When this light encounters hydrogen atoms still lingering in the stellar nursery that produced the stars, the atoms become ionised. Accordingly, the vast, cloud-like objects that glow with this light from hydrogen (and other) atoms are known as emission nebulae.

Thanks to the power of the 256-megapixel OmegaCAM camera, this new Very Large Telescope Survey Telescope (VST) image reveals tendrils of light-obscuring dust rippling throughout the two nebulae. At 49511 x 39136 pixels this is one of the largest images ever released by ESO.

OmegaCAM is a successor to ESO’s celebrated Wide Field Imager (WFI), currently installed at the MPG/ESO 2.2-metre telescope on La Silla. The WFI was used to photograph the Cat’s Paw Nebula in 2010, also in visible light but with a filter that allowed the glow of hydrogen to shine through more clearly (eso1003). Meanwhile, ESO’s Very Large Telescope has taken a deep look into the Lobster Nebula, capturing the many hot, bright stars that influence the object’s colour and shape (eso1226).

Despite the cutting-edge instruments used to observe these phenomena, the dust in these nebulae is so thick that much of their content remains hidden to us. The Cat’s Paw Nebula is one of the most active stellar nurseries in the night sky, nurturing thousands of young, hot stars whose visible light is unable to reach us. However, by observing at infrared wavelengths, telescopes such as ESO’s VISTA can peer through the dust and reveal the star formation activity within.

Viewing nebulae in different wavelengths (colours) of light gives rise to different visual comparisons on the part of human observers. When seen in longer wavelength infrared light, for example, one portion of NGC 6357 resembles a dove, and the other a skull; it has therefore acquired the additional name of the War and Peace Nebula.


More Information

ESO is the foremost intergovernmental astronomy organisation in Europe and the world’s most productive ground-based astronomical observatory by far. It is supported by 16 countries: Austria, Belgium, Brazil, the Czech Republic, Denmark, France, Finland, Germany, Italy, the Netherlands, Poland, Portugal, Spain, Sweden, Switzerland and the United Kingdom, along with the host state of Chile. ESO carries out an ambitious programme focused on the design, construction and operation of powerful ground-based observing facilities enabling astronomers to make important scientific discoveries. ESO also plays a leading role in promoting and organising cooperation in astronomical research. ESO operates three unique world-class observing sites in Chile: La Silla, Paranal and Chajnantor. At Paranal, ESO operates the Very Large Telescope, the world’s most advanced visible-light astronomical observatory and two survey telescopes. VISTA works in the infrared and is the world’s largest survey telescope and the VLT Survey Telescope is the largest telescope designed to exclusively survey the skies in visible light. ESO is a major partner in ALMA, the largest astronomical project in existence. And on Cerro Armazones, close to Paranal, ESO is building the 39-metre European Extremely Large Telescope, the E-ELT, which will become “the world’s biggest eye on the sky”.


Links


Contacts

Richard Hook
ESO Public Information Officer
Garching bei München, Germany
Tel: +49 89 3200 6655
Cell: +49 151 1537 3591
Email: rhook@eso.org


Source: ESO

Wednesday, February 01, 2017

Tracing the Cosmic Web with Star-forming Galaxies in the Distant Universe

A research group led by Hiroshima University has revealed a picture of the increasing fraction of massive star-forming galaxies in the distant universe. Massive star-forming galaxies in the distant universe, about 5 billion years ago, trace large-scale structure in the universe. In the nearby universe, about 3 billion years ago, massive star-forming galaxies are not apparent. This change in the way star-forming galaxies trace the matter distribution is consistent with the picture of galaxy evolution established by other independent studies.

Figure 1: A close-up view of the cluster of galaxies observed. The image is a compotie of the i-band data (in red) from the Hyper Suprime-Cam at the Subaru Telescope and R-band (in green) and V-band (in blue) images from the Mayall 4-m telescope at the Kitt Peak National Observatory of National Optical Astronomy Observatory. Contour lines show the mass distribution. Red and blue circles show galaxies that stopped star formation and galaxies with star formation, respectively. The research team was able to study the evolution of the large scale structure in the Universe by comparing the mass distribution in the Universe and the distribution of the galaxies. (Credit: Hiroshima University/NAOJ). Hi-res image


Galaxies in the universe trace patterns on very large scales; there are large empty regions (called "voids") and dense regions where the galaxies exist. This distribution is called the cosmic web. The most massive concentrations of galaxies are clusters. The formation of the cosmic web is governed by the action of gravity on the invisible mysterious "dark matter" that exists throughout the universe. The normal baryonic material one can see falls into the dark matter halos and forms galaxies. The action of gravity over about 14-billion-year history of the universe makes the halos cluster together. The location of galaxies or clusters in this enormous cosmic web tests our understanding of the way structure forms in the universe.

Increasingly, deeper and more extensive observations with telescopes like Subaru Telescope provide a clearer picture of the way galaxies evolve within the cosmic web. Of course, one cannot see the dark matter directly. However, one can use the galaxies that are seen to trace the dark matter. It is also possible to use the way the gravity of clusters of galaxies distort more distant background galaxies, weak gravitational lensing, as another tracer.

The Hiroshima group combined these two tracers: galaxies and their weak lensing signal to map the changing role of massive star-forming galaxies as the universe evolves.

Weak lensing is a phenomenon that provides a powerful technique for mapping the changing contribution of star-forming galaxies as tracers of the cosmic web. The cluster of galaxies and surrounding dark matter halo act as a gravitational lens. The lens bends the light passing through from more distant galaxies and distorts the images of them. The distortions of the appearance of the background galaxies provide a two-dimensional image of the foreground dark matter distribution that acts as a huge lens. The excellent imaging of the Subaru Telescope covering large regions of the sky provides exactly the data needed to construct maps of this weak lensing.

Dr. Yousuke Utsumi, a member of Hyper Suprime-Cam building team and a project assistant professor at Hiroshima University, conducted a 1-hour observation of a 4-deg2 patch of sky in the direction of the constellation Cancer. Figure 1 shows a close-up view of a cluster of galaxies with the weak lensing map tracing the matter distribution. The highest peaks in the maps correspond the foreground massive clusters of galaxies that lie 5 billion light-years away.

To map the three-dimensional distribution of the foreground galaxies, spectrographs on large telescopes like the 6.5-meter MMT disperse the light with a grating. The expansion of the universe shifts the light to the red and by measuring this shift one measures the distances to the galaxies. Using spectroscopy places the galaxies in the cosmic web. The observations locate star-forming galaxies and those that are no longer forming stars.

Collaborators led by Dr. Margaret Geller (Harvard-Smithsonian Center for Astrophysics) conducted spectroscopic measurements for galaxies. The Hectospec instrument on the MMT enables measurements of redshifts for 250 galaxies at a time. The survey contains measurements for 12,000 galaxies.

The MMT redshift survey provides the map for the way all types of galaxies might contribute to the weak lensing map. Because the MMT survey provides distances to the galaxies, slices of the map at different distances corresponding to different epochs in the history of the universe can also be made and compared with the lensing map.

The MMT survey provides a predicted map of the cosmic web based on the positions of galaxies in three-dimensional space. Research team compared this map with the weak lensing map to discover the similarities. Figure 2 shows that both the highest peak and the largest empty regions are similar in the two maps. In other words, the matter distribution traced by the foreground galaxies and the distribution traced by the Subaru weak lensing map are similar. There are two complementary views of the cosmic web in this patch of the universe.

Figure 2: Distribution of mass (left) and galaxies (right) in the corresponding area. The conspicuous feature in the galaxy distribution also is visible in the left side, mass distribution, while the areas with no structure in the right also has no feature in the left. (Credit: Hiroshima University/NAOJ). Hi-res image


If they slice up the three-dimensional map in different redshift or time slices, they can examine the way the correspondence between these maps and the weak lensing map changes for different slices (Figure 3). Remarkably, the distribution of star-forming galaxies around a cluster of galaxies in the more distant universe (5 billion years ago) corresponds much more closely with the weak lensing map than a slice of the more nearby universe (3 billion years ago). In other words, the contribution of star-forming galaxies to the cosmic web is more prominent in the distant universe. These maps are the first demonstration of this effect in the weak lensing signal (Figure 4).

Figure 3: The distribution of galaxies with respect to the distance. The panels show the three-dimensional distribution of the galaxies, viewed from the observer on Earth. Red points represent quiescent galaxies and blue points are star-forming galaxies. Boxes in the cone are 3 and 5 billion light-years from the observer. The maps next to the enclosed areas show the corresponding distribution of galaxies. (Credit: Hiroshima University/NAOJ). Hi-res image

Figure 4: Close-ups of the cluster of galaxies at 3 billion light years (top) and 5 billion light years (bottom). These panels show the distribution of mass (left), quiescent galaxies (middle), and star forming galaxies (right), respectively. Three billion years ago, it is hard to see any similarity between the star-forming galaxies and the mass distribution, but there is much greater similarity in the maps of 5 billion years ago. (Credit: Hiroshima University/NAOJ). Hi-res image


The research team provides a new window on galaxy evolution by comparing the three-dimensional galaxy distribution mapped with a redshift survey including star-forming galaxies to a weak lensing map based on Subaru imaging.

"It turns out that the contribution of star-forming galaxies as tracers of the mass distribution in the distant universe is not negligible," said Dr. Utsumi. "The HSC weak lensing map should contain signals from more distant galaxies in the 8 billion-year-old universe. Deeper redshift surveys combined with similar weak lensing maps should reveal an even greater contribution of star-forming galaxies as tracers of the matter distribution in this higher redshift range. Using the next generation spectrograph for the Subaru Telescope, Prime Focus Spectrograph (PFS), we hope to extend our maps to the interesting era."

This research is published in the Astrophysical Journal in its December 14, 2016 on-line version and December 20, 2016 in the printed version, Volume 833, Number 2. The title of the paper is "A weak lensing view of the downsizing of star-forming galaxies" by Y. Utsumi et al., which is also available in preprint from arXiv:1606.07439v2. This work is supported by a JSPS Grant-in-Aid for Young Scientists (B) (JP26800103) and a MEXT Grant-in-Aid for Scientific Research on Innovative Areas (JP24103003).

Authors:

  • Yousuke Utsumi: Hiroshima Astrophysical Science Center, Hiroshima University, Japan
  • Margaret J. Geller: Smithsonian Astrophysical Observatory, USA
  • Ian P. Dell'Antonio: Department of Physics, Brown University, USA
  • Yukiko Kamata: National Astronomical Observatory of Japan (NAOJ), Japan
  • Satoshi Kawanomoto: NAOJ, Japan
  • Michitaro Koike: NAOJ, Japan
  • Yutaka Komiyama: NAOJ, Japan; Department of Astronomical Science, The Graduate University for Advanced Studies (SOKENDAI), Japan
  • Shintaro Koshida: Subaru Telescope, NAOJ, USA
  • Sogo Mineo: NAOJ, Japan
  • Satoshi Miyazaki: NAOJ, Japan; Department of Astronomical Science, SOKENDAI, Japan
  • Junya Sakurai: NAOJ, Japan; Department of Astronomical Science, SOKENDAI, Japan
  • Philip J. Tait: Subaru Telescope, NAOJ, USA
  • Tsuyoshi Terai: Subaru Telescope, NAOJ, USA
  • Daigo Tomono: Subaru Telescope, NAOJ, USA
  • Tomonori Usuda: NAOJ, Japan; Department of Astronomical Science, SOKENDAI, Japan
  • Yoshihiko Yamada: NAOJ, Japan
  • Harus J. Zahid: Smithsonian Astrophysical Observatory, USA

Links: