Showing posts with label NASA’s Chandra X-ray Observatory. Show all posts

Wednesday, September 16, 2026

NASA's Chandra Unveils Mysterious X-ray Objects

Fast Facts for M101 The Pinwheel Galaxy)
Credit: X-ray: NASA/CXC/Univ. of Alabama/M. Muhibullah et al.; Optical: NASA/ESA/STScI;
Image Processing: NASA/CXC/SAO/N. Wolk


  • Astronomers found a new class of objects using NASA’s Chandra X-ray Observatory.

  • They dubbed these “hypersoft X-ray sources” (HSS) because they give off very low-energy X-rays that are difficult to detect.

  • Despite their stealth output, HSS may be emitting large amounts of ultraviolet radiation.

  • This discovery may help scientists unravel mysteries around Type Ia supernovas and the intergalactic medium.


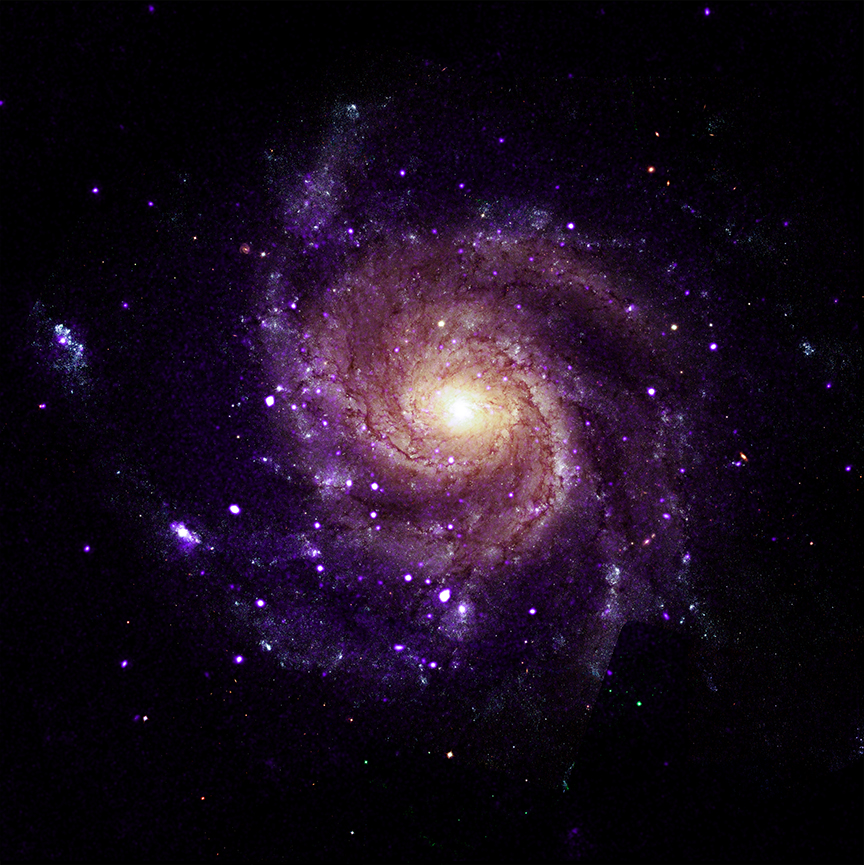
Astronomers have discovered a new class of objects in multiple galaxies. This result, made possible by NASA’s Chandra X-ray Observatory and outlined in our latest press release, may help scientists solve two outstanding mysteries in astrophysics.

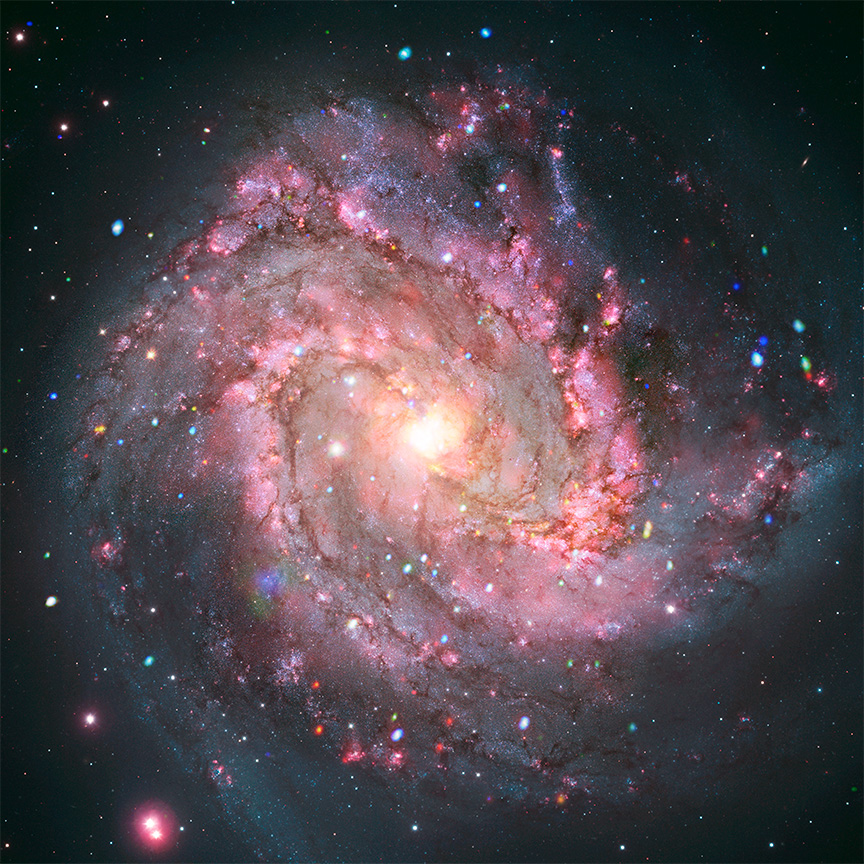
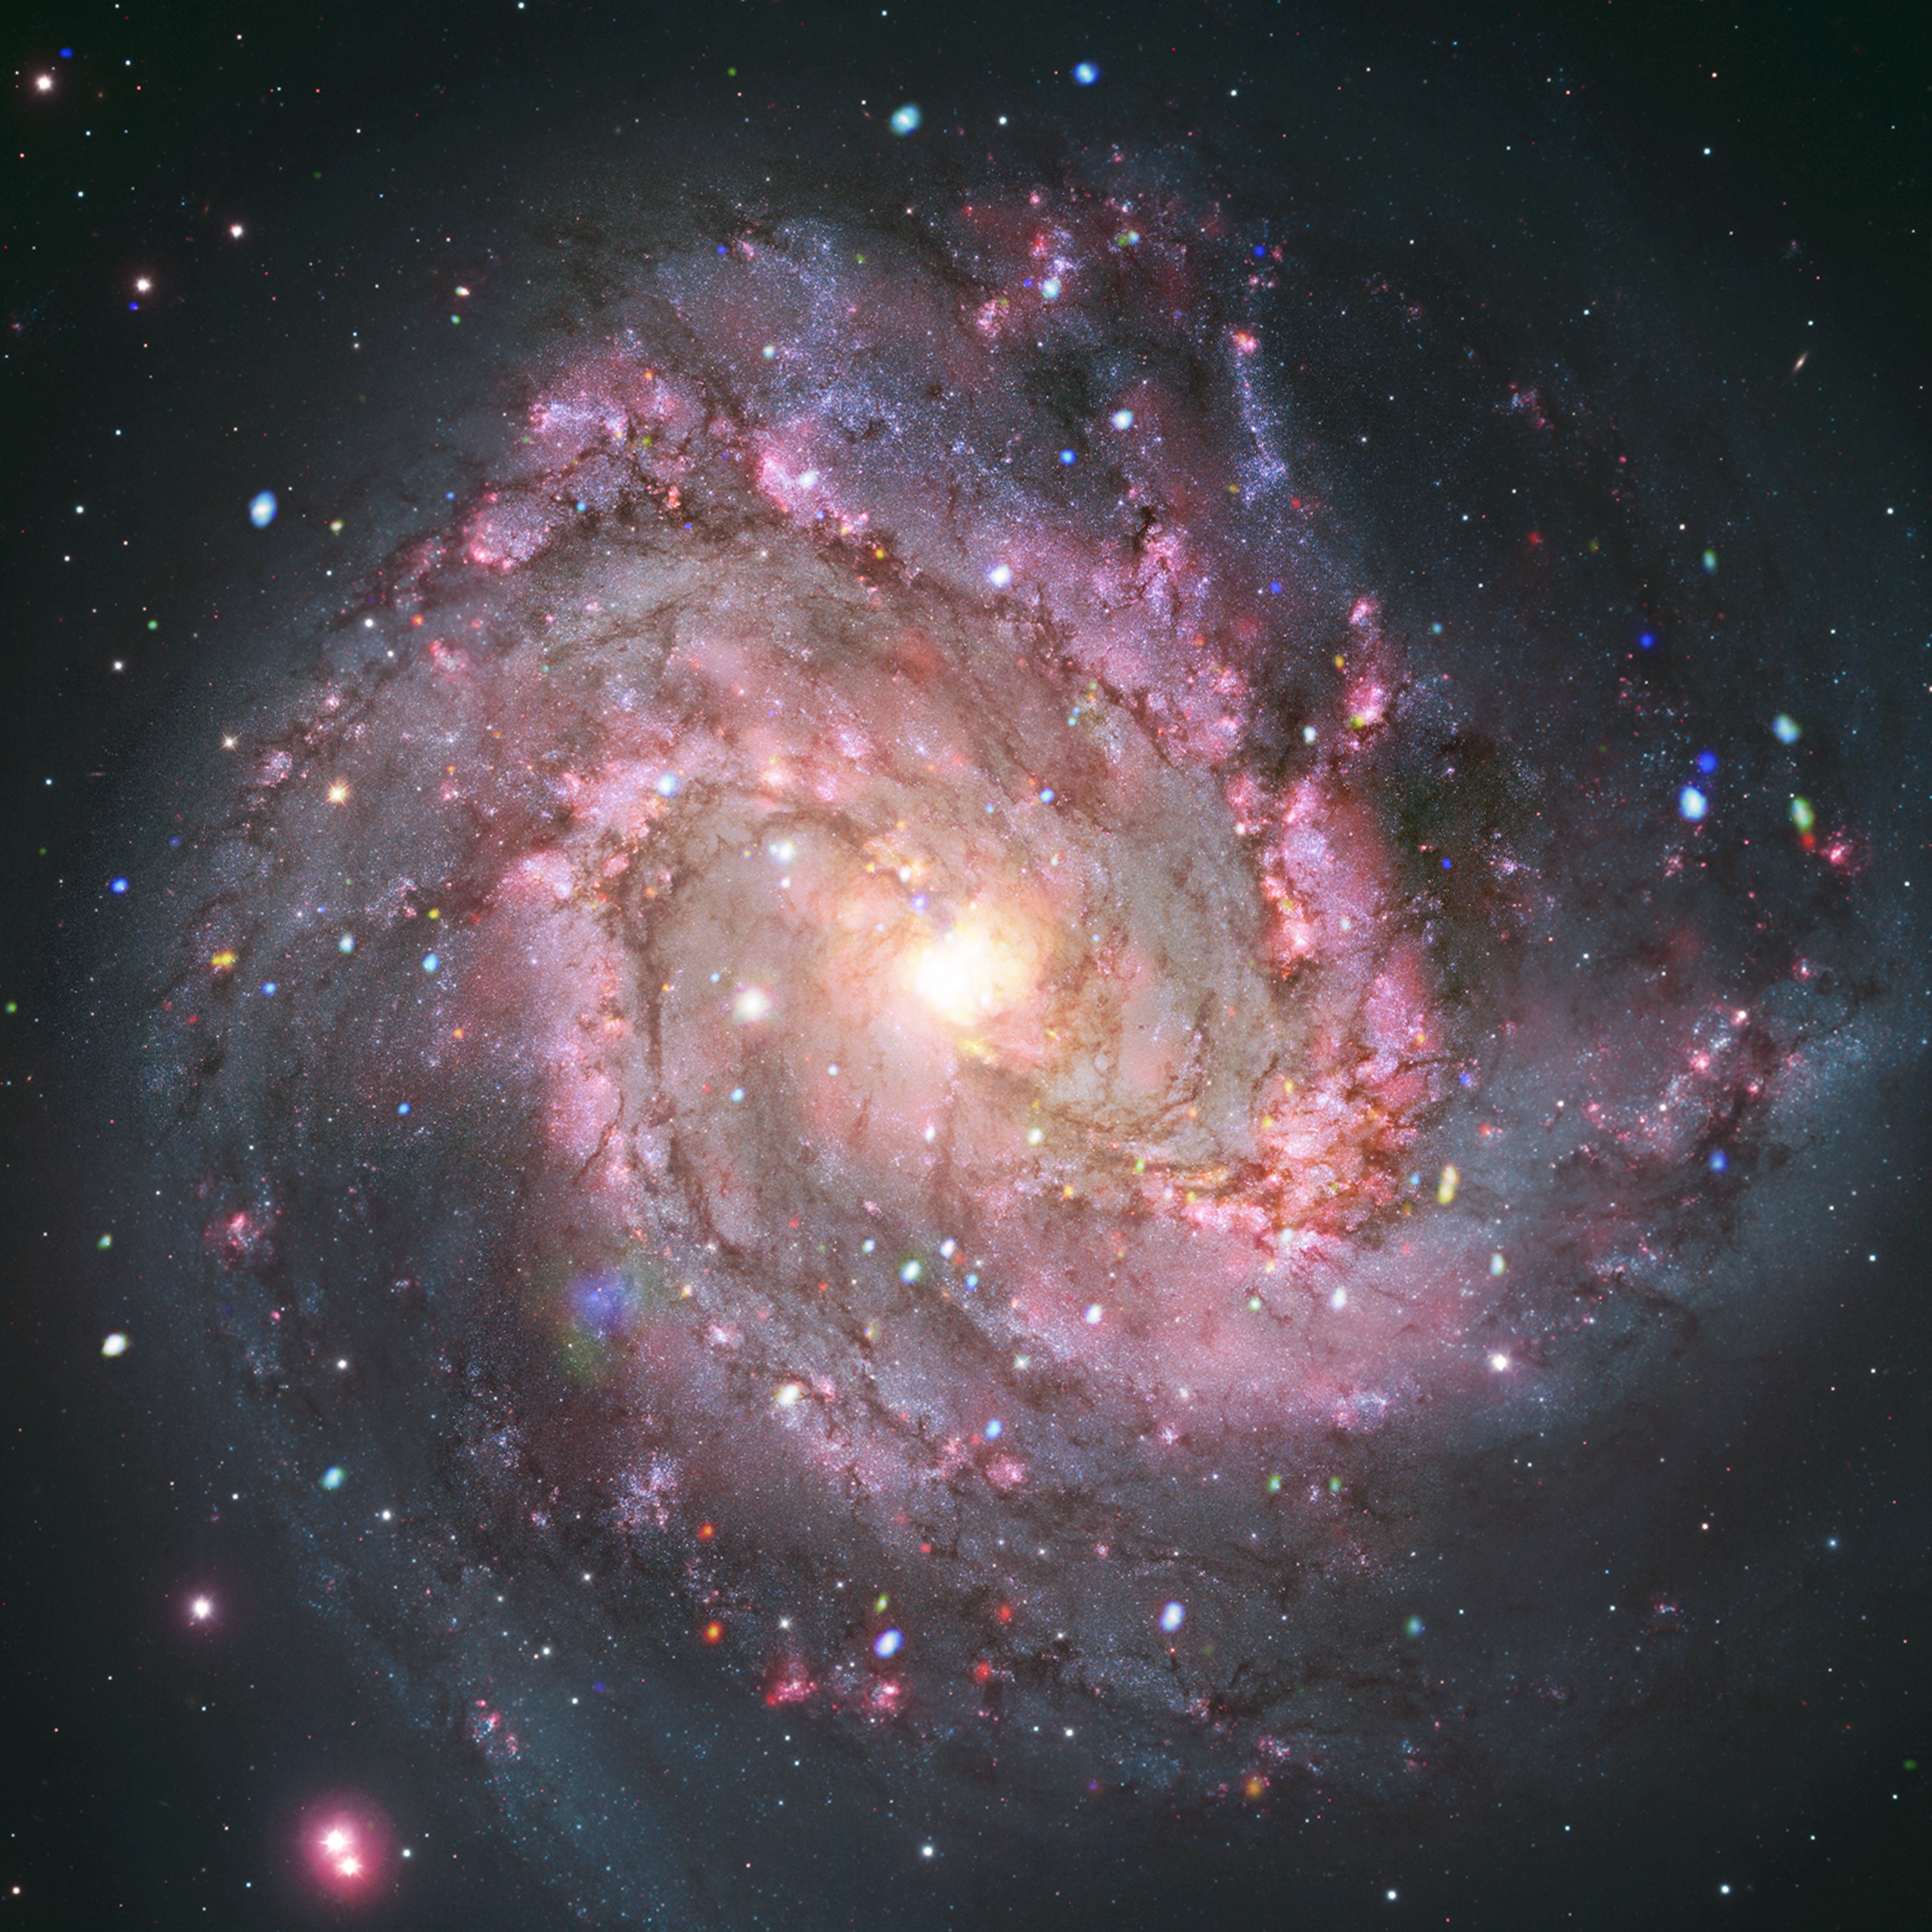
The face-on spiral galaxy M101, also known as the Pinwheel, is one of the galaxies where the new type of object was found. This new M101 composite image contains X-ray data from Chandra (purple) that have been combined with an optical image from the Hubble Space Telescope (red, green, and blue). Circles in an annotated version of the image show the location of the seven newly-discovered objects in M101.

M101 with illustrated circles calling out seven of the newly-discovered objects. (Labeked)
Credit: X-ray: NASA/CXC/Univ. of Alabama/M. Muhibullah et al.; Optical: NASA/ESA/STScI;
Image Processing: NASA/CXC/SAO/N. Wolk

Researchers found a total of 84 of these mysterious objects in M101, Messier 31, and four elliptical galaxies. The objects were named “hypersoft X-ray sources” because they give off very low-energy X-rays that Chandra was only able to detect after long exposures. Because low-energy X-rays border energetic ultraviolet radiation on the electromagnetic spectrum, the team determined that these sources are likely producing large amounts of energetic ultraviolet radiation.

Astronomers are trying to determine what type — or types — of objects are responsible for these low-energy X-rays and intense ultraviolet radiation outputs. The most likely explanation, according to the team, is that these systems involve a black hole, neutron star or white dwarf pulling material from a companion star. The material pulled from the companion star is heated up to produce X-rays before falling onto the white dwarf or neutron star, or into the black hole. While scientists have discovered many binary systems over the years, astronomers have never seen any behaving like this before.

The discovery of this new class of sources suggests that astronomers have missed large populations of binary systems with energetic ultraviolet radiation until now. One idea is that these binary systems are the precursors to Type Ia supernova explosions, which astronomers used to discover the acceleration of the universe’s expansion.

Another open question that these hypersoft X-ray sources could help answer involves the stripping of electrons from gas in between galaxies. Scientists know this phenomenon plays an important role in the lifecycle of the stars, but they still need to accurately account for all of the energy sources that contribute to this process. This newly-discovered class of objects may play a significant role in this stripping.

These hypersoft X-ray sources were not found until now because in addition to the low-energy X-ray output that requires large amounts of observing time from a telescope like Chandra, the high-energy ultraviolet radiation is readily absorbed by helium and hydrogen gas that fills the space in between the stars. This creates a “nearly impenetrable barrier” to look through.

A paper describing this result appears in the most recent issue of Nature Astronomy and is available here. The authors of this paper are Mustafa Muhibullah (University of Alabama), Jimmy Irwin (University of Alabama), and Rosanne DiStefano (Center for Astrophysics | Harvard & Smithsonian).

NASA's Marshall Space Flight Center manages the Chandra program. The Smithsonian Astrophysical Observatory's Chandra X-ray Center controls science operations from Cambridge, Massachusetts, and flight operations from Burlington, Massachusetts.


Fast Facts for M101, The Pinwheel Galaxy

Credit: X-ray: NASA/CXC/Univ. of Alabama/M. Muhibullah et al.; Optical: NASA/ESA/STScI; Image Processing: NASA/CXC/SAO/N. Wolk
Release Date: September 9, 2026
Scale: Image is about 14 arcmin (86,000 light-years) across.
Category:
Normal Galaxies & Starburst Galaxies
Coordinates (J2000): RA 14h 03m 12.5s | Dec +54° 20´ 56.2"
Constellation:
Ursa Major
Observation Dates: 25 observations from March 2000 to January 2005
Observation Time: 274 hours (11 days 10 hours)
Obs. ID: 934, 3095, 4731-4737, 5296, 5297, 5300, 5309, 5322, 5323, 5337-5340, 6114, 6115, 6118, 6152, 6169, 6170, 6175
Instrument:
ACIS
Also Known As: NGC 5457, The Pinwheel Galaxy
References: Muhibullah, M., Irwin, J.A., and Di Stefano, R., 2026, Nature Astronomy (
available here)
Color Code: X-ray: purple; Optical: red, green, and blue
Distance Estimate: About 21 million light-years from Earth


Friday, August 14, 2026

NASA Telescopes Create Colorful 'Craft' From Nearby Nebula

3 Doradus
Credit: X-ray: NASA/CXC/Ohio State Univ./J. Rodriguez et al; Infrared: NASA/ESA/CSA/STScI; Optical: NASA/ESA/STScI; Image Processing: NASA/CXC/SAO/P. Edmonds


  • A new study of the Tarantula Nebula is answering questions about why this star formation region in the Large Magellanic Cloud is losing energy from its center.

  • By combining data from Chandra, Hubble and Webb, and Spitzer, researchers identified what has tamed the Tarantula and where the energy has gone.

  • This new composite image has layers from three of these telescopes: Chandra (blue), Hubble (green), and Webb (red).

  • Scientists have concluded that energy has been lost through leakage of gas, the mixing of hot and cold gas and by conduction of heat.


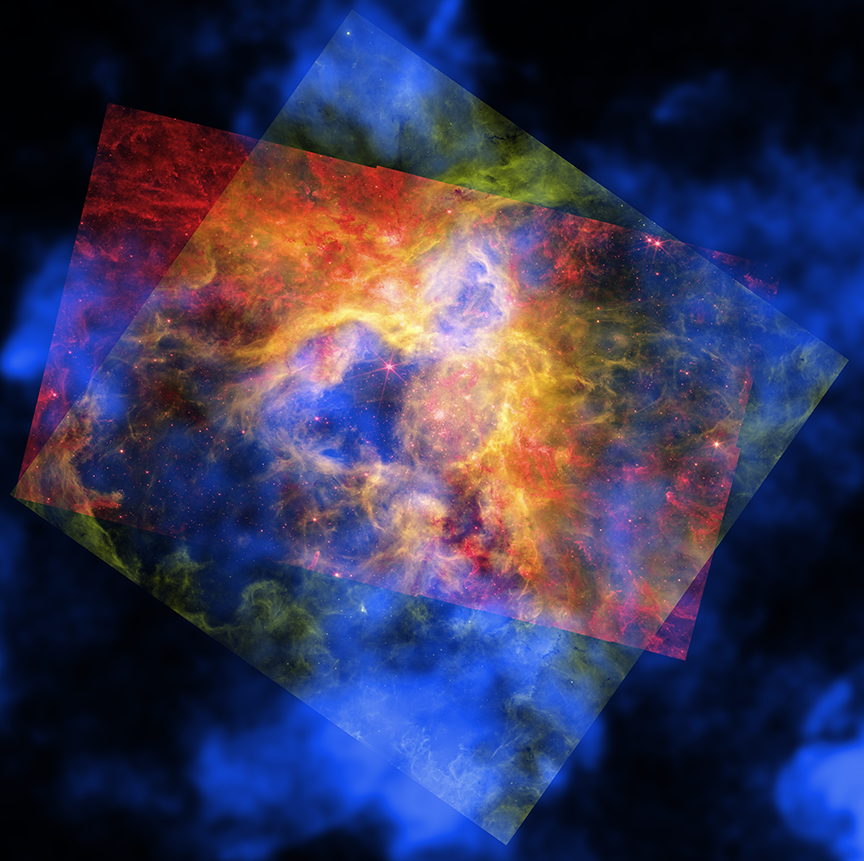

Like a collage made of layered sheets of colored cellophane, a vibrant new image layers observations of a famous star-forming nebula from NASA space telescopes. The resulting cosmic “craft” reveals new details about the star formation region known as 30 Doradus, or the Tarantula Nebula.

Located in the Large Magellanic Cloud, a small neighbor galaxy to the Milky Way about 160,000 light-years from Earth, the Tarantula has thousands of young stars embedded in a vibrant honeycomb-like structure of gas and dust.

The new composite image contains X-rays from NASA’s Chandra X-ray Observatory, which has repeatedly observed the Tarantula Nebula over the course of its mission, in the layer that appears in blue. The X-ray data reveals gas blown away by winds from the surfaces of young, massive stars and heated to millions of degrees by shock waves, like sonic booms from supersonic jets.

The red represents infrared data from NASA’s James Webb Space Telescope showing thousands of young stars, plus swaths of cool dust that will provide the ingredients to form new stars and planets. Optical data in the green layer from NASA’s Hubble Space Telescope uncovers hydrogen gas that is warmer than seen with Webb, as well as some individual stars through the nebula.

The composite image shows the full Hubble and Webb images of this region, as well as a large section of the Chandra image, all recently published in a research paper in the Astrophysical Journal. In some regions the blue Chandra layer stands alone, and in others it combines with either the red Webb data or the green Hubble data. In the middle region all three images overlap to provide a holistic view in red, orange, yellow, green, and blue.

Tarantula Nebula (30 Doradus)
Optical + Infrared + X-ray

Previously, astronomers had studied the amount and the impact of energy produced by winds from young, massive stars in the Tarantula Nebula. Scientists expect that much of this energy should heat gas so that it produces X-rays. However, the research paper shows that there is much less X-ray-emitting gas in the nebula than expected. This led researchers to ask: Where has this energy gone and what tamed the Tarantula Nebula?

By studying the data from Chandra, Hubble, and Webb, combined with data from NASA’s retired Spitzer Space Telescope, the team concluded the Tarantula may be losing energy from several sources.

First, up to half of the hot gas is leaking through the shell walls of the gas and dust structures and escaping the nebula. Next, there is stirring and mixing between the cold gas near the shell walls and some of the hot gas, lowering the overall temperature of the gas. Finally, comparisons with computer simulations suggest the Tarantula may be losing energy through conduction. This involves direct physical contact between hot and cooler material, like with a frying pan on a burner, causing the hot and cooler material to equalize in temperature. In the case of the Tarantula Nebula, the hot gas would be conducting heat by being in direct contact with the cooler gas in the shells, especially in the densest regions. This scenario does not necessarily involve mixing the hot and cooler gas.

The combination of these three channels for losing large amounts of energy leads to this colorful and complex display revealed by NASA's telescopes working together.

Tarantula Nebula / 30 Doradus, cropped version. Credit: X-ray: NASA/CXC/Ohio State Univ./J. Rodriguez et al; Infrared: NASA/ESA/CSA/STScI; Optical: NASA/ESA/STScI; Image Processing: NASA/CXC/SAO/P. Edmonds

The paper describing these results was led by Jennifer Rodriguez of The Ohio State University in Columbus. Additional authors on the paper include Laura Lopez, Ohio State; Lachlan Lancaster, Columbia University in New York City; Anna Rosen, San Diego State University; Omnaraynai Nayak, Space Telescope Science Institute in Baltimore; Sebastian Lopez, Ohio State; Tyler Holland-Ashford, NASA’s Goddard Space Flight Center in Greenbelt, Maryland; and Trinity Webb, Ohio State.

NASA's Marshall Space Flight Center in Huntsville, Alabama, manages the Chandra program. The Smithsonian Astrophysical Observatory's Chandra X-ray Center controls science operations from Cambridge, Massachusetts, and flight operations from Burlington, Massachusetts.


Visual Description:

This release features three images of the Tarantula Nebula, or 30 Doradus, a star-forming region of the Large Magellanic Cloud. Each image represents a different wavelength of light, presented in a different color. When layered atop one another, like sheets of colored cellophane, they combine to produce a vibrant and informative singular image.

The base layer of the nearly square, combined image, features a blanket of wispy blue clouds against a black backdrop. These clouds represent hot gas observed by NASA's Chandra X-ray Observatory. This layer reveals that gas has been blown from the surfaces of young, massive stars, and heated to millions of degrees by shock waves.

The second layer is a rectangular image cutting diagonally across the cloudy blue square, tilted from our upper left down toward our lower right. This layer features roiling red clouds and tiny, gleaming, red specks. These are swaths of cool, ingredient-rich dust, and scores of young stars. This red layer represents infrared data collected by NASA's James Webb Space Telescope.

The third layer is a tilted square, or diamond-shaped image, with its points touching the edges of the big blue base layer. Here, curling, sweeping tendrils of warm hydrogen gas swirl around the frame in shades of green. This layer represents data captured by NASA's Hubble Space Telescope.

In the center of the combined image, the three translucent layers overlap, resulting in a technicolor marvel; an image of intermingled blue, red, and green clouds that blend to include lively shades of fiery orange, golden yellow, and deep purple.


Fast Facts for Tarantula Nebula (30 Doradus)

Credit: X-ray: NASA/CXC/Ohio State Univ./J. Rodriguez et al; Infrared: NASA/ESA/CSA/STScI; Optical: NASA/ESA/STScI; Image Processing: NASA/CXC/SAO/P. Edmonds
Release Date: August 11, 2026
Scale: Image is about 10 arcmin (470 light-years) across.
Category:
Normal Stars & Star Clusters
Coordinates (J2000): RA 5h 38m 38s | Dec -69° 05´ 42"
Constellation:
Dorado
Observation Dates: 54 observations from January 2006 to January 2016
Observation Time: 571 hours (23 days 19 hours 56 minutes)
Obs. ID: 05906, 07263, 07264, 16192-16203, 16442-16449, 16612, 16615-16617, 16621, 16640, 17312-17414, 17486, 17544, 17545, 17555, 17561, 17562, 17602, 17603, 17640-17642, 17660, 18670-18672, 18706, 18720, 18721, 18722, 18729, 18749, 18750
Instrument: ACIS
Also Known As: 30 Doradus
References: Rodriguez, J.A., et al, 2026,
ApJ, 998, 318.
Color Code: X-ray: blue; Infrared: red; Optical (H-alpha): green
Distance Estimate: About 160,000 light-years from Earth


Monday, August 03, 2026

Chandra Sees Black Hole Stirring "Pot" Containing Galactic Potato

Red Potato Galaxy (MQN01 J004131.9-493704)
Credit: X-ray: NASA/CXC/Univ. Milano-Bicocca/W. Wang et al.; Infrared: NASA/ESA/CSA/STScI;
Radio: ESO/NRAO/NAOJ/ALMA; Image processing: NASA/CXC/SAO/N. Wolk & P. Edmonds


JPEG (128.9 kb) - Large JPEG (939.4 kb) - Tiff (77.2 MB) - More Images

A Tour of the Red Potato Galaxy - More Videos


  • A jet from a black hole in the early universe is churning the gas around a neighboring galaxy, tamping down star formation.

  • NASA’s Chandra provided evidence that this jet is striking the gas cloud pumping particles and energy into it.

  • This galaxy was nicknamed the "red potato" galaxy because of its appearance in images from NASA’s James Webb.

  • This result informs how and when stars & galaxies formed in the early universe — and the effects black holes may have on them.


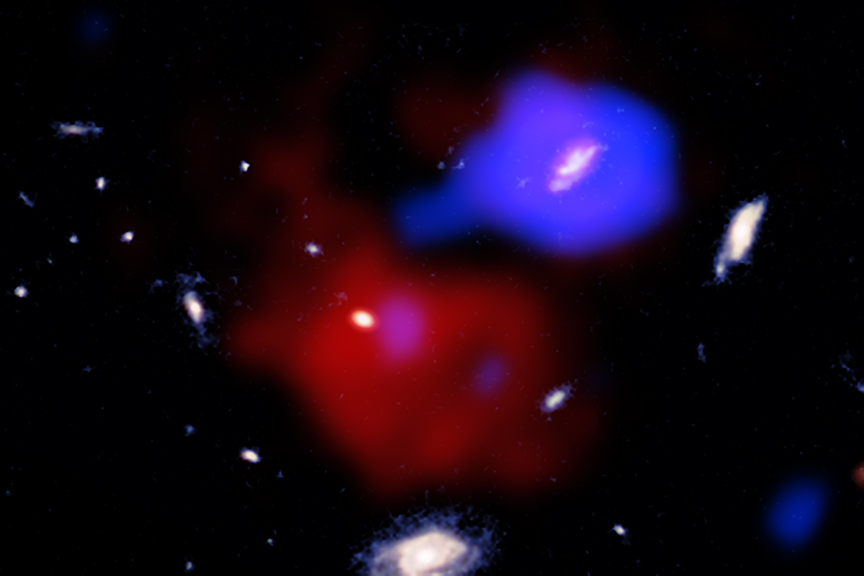
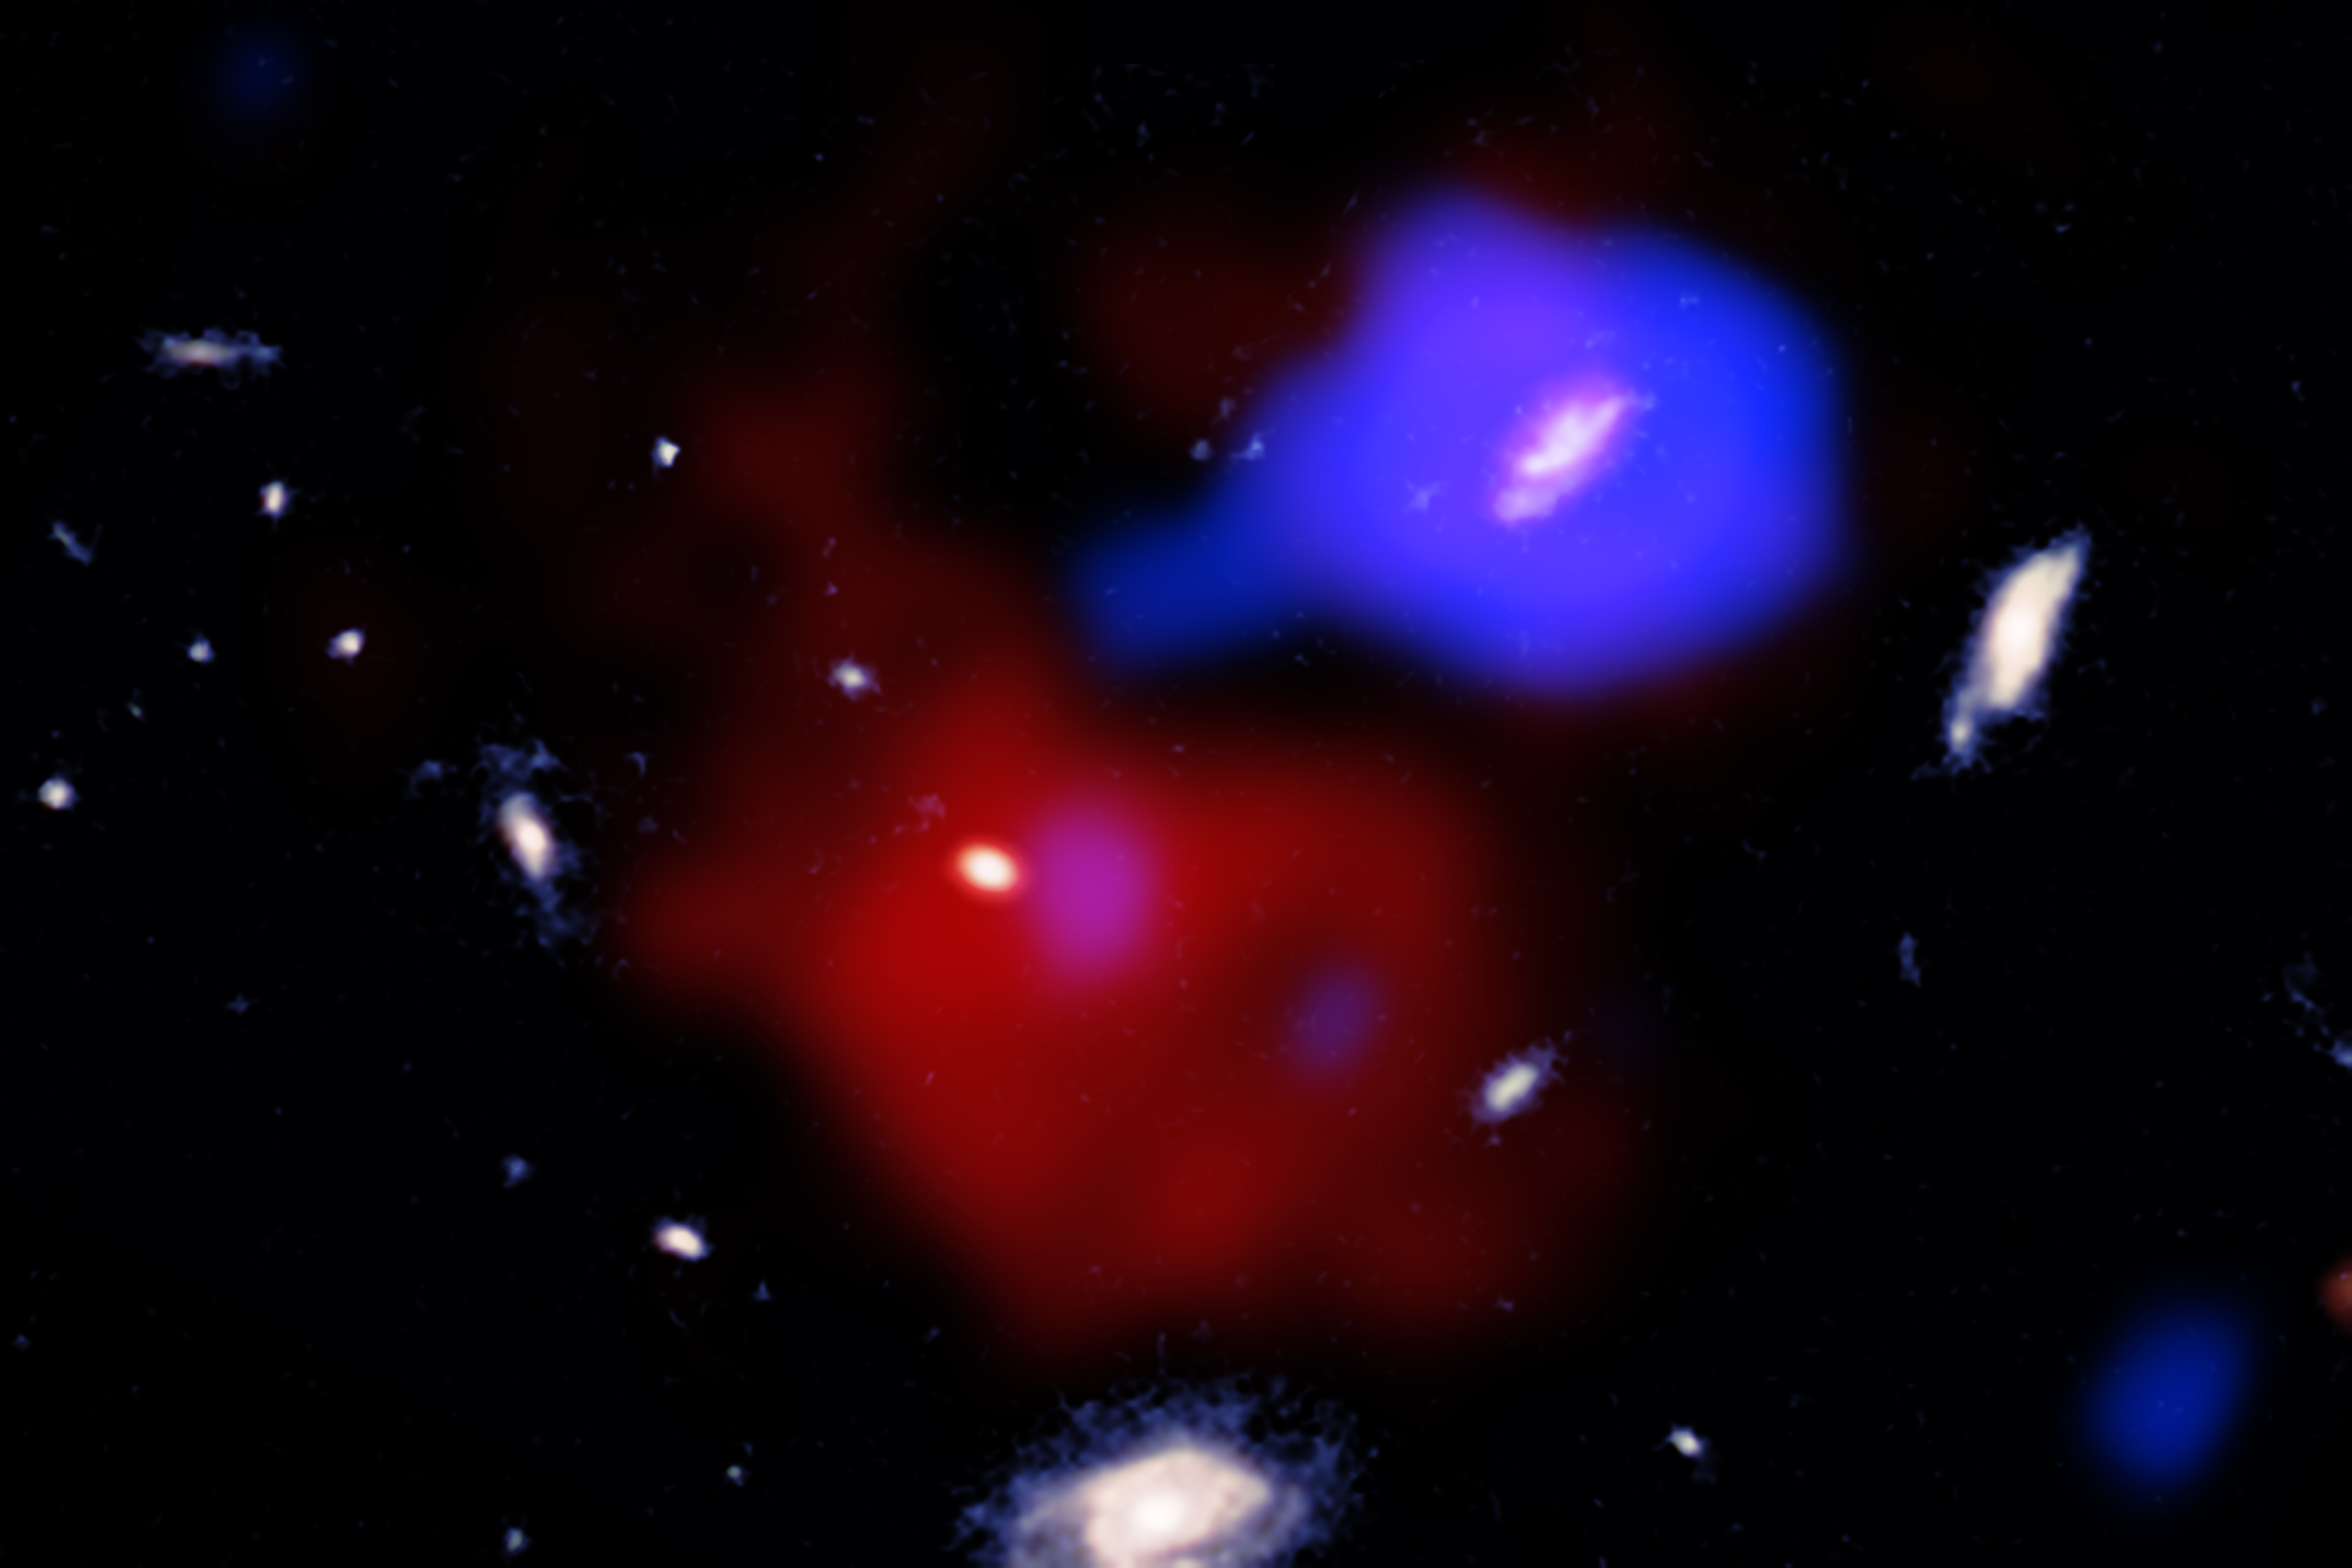
A black hole may be stirring a "pot" of gas containing a neighboring galaxy in the early universe, according to a new study using NASA's Chandra X-ray Observatory, as described in our latest press release. This galaxy, officially named MQN01 J004131.9-493704, has been nicknamed the "red potato" by astronomers because of its appearance in images from NASA's James Webb Space Telescope.

The red potato galaxy is located about 11.7 billion light-years from Earth at an intersection where gigantic web-like structures of galaxies and gas meet. Astronomers targeted this area with Webb because they knew it contains one of the heaviest concentrations of galaxies and growing supermassive black holes yet identified in the early universe.

A composite image shows this galaxy in X-rays from Chandra (blue) and radio light data from ALMA, the Atacama Large Millimeter/submillimeter Array (red). The X-rays reveal a growing supermassive black hole and the jet it has produced, while the radio light shows relatively cool gas in the region. Infrared data from Webb (red, green, and blue) completes the view.

Astronomers expected that the red potato galaxy, which is surrounded by the ingredients to form new stars in the form of the cool gas, would be producing many young stars. However, the amount of star formation was relatively low, which led the researchers to look for a reason why.

One important clue is that the cloud of gas surrounding the red potato galaxy is unusually turbulent compared to large gas clouds surrounding other galaxies. Such turbulence could be preventing most of the gas from falling onto the red potato galaxy to form large numbers of new stars.

Using Chandra, the team discovered that a jet of particles from a growing black hole in a neighboring galaxy is pointed toward and may be striking the gas cloud around the red potato galaxy, possibly causing the turbulence.

The Red Potato galaxy, MQN01 J004131.9-493704, and the surrounding region in X-ray, infrared, and radio light. Credit: X-ray: NASA/CXC/Univ. Milano-Bicocca/W. Wang et al.; Infrared: NASA/ESA/CSA/STScI; Radio: ESO/NRAO/NAOJ/ALMA; Image processing: NASA/CXC/SAO/N. Wolk & P. Edmonds

A labeled version of the image highlights the red potato galaxy, the neighboring galaxy hosting the growing supermassive black hole, the jet from this black hole and the cloud of cool gas the jet may be striking. Apart from the jet, the blue Chandra emission from the neighboring galaxy is a point source of X-rays, rather than including diffuse X-rays. The large, diffuse appearance of the X-ray source is caused by the difference in resolving power of JWST and Chandra, and the processing required to show the faint jet.

While the red potato galaxy mostly has older, cooler stars and therefore appears red in infrared data, the galaxy hosting the black hole with the jet does not. Instead, this galaxy, which is located about 200,000 light-years from the red potato, is very actively forming stars, including massive, hot stars, as are most of the other nearby galaxies.

Astronomers want to learn how galaxies and black holes interact with each other – especially at this critical epoch in the universe’s history – and how that impacts when and how stars form.

A paper describing these results, led by Weichen Wang of the University of Milan-Bicocca in Italy, has been recently published in the Astronomy & Astrophysics journal. NASA's Marshall Space Flight Center manages the Chandra program. The Smithsonian Astrophysical Observatory's Chandra X-ray Center controls science operations from Cambridge, Massachusetts, and flight operations from Burlington, Massachusetts.


Visual Description:

This release includes a composite image featuring two galaxies in the early universe, some 11.7 billion light-years from Earth.

Near the center of the image is a small, irregular, pale yellow oval with a red outer ring, in the heart of a bright, hazy red cloud. This is a galaxy nicknamed the “red potato” by astronomers studying this region of the early universe. Those astronomers expected the red potato to be producing scores of new stars. When they instead discovered relatively low star growth, they looked to a neighboring galaxy for reasons why.

To our upper right of the red potato and its hazy red cloud of gas, is a neighboring galaxy in a pool of blue haze. This galaxy is also pale yellow in color, but has a less defined, less tuber-like shape than its counterpart. The blue pool represents X-rays from a growing supermassive black hole in the heart of the galaxy. The pool has a stubby tail, or X-ray jet, pointed toward the red cloud, and faint pockets of red and blue overlap within the composite image.

Astronomers now believe that the X-ray jet from the neighboring supermassive black hole may have struck the red gas cloud around the red potato. This may be causing turbulence within the gas cloud, preventing the gas from falling onto the red potato. Without the ingredients from that gas, new stars struggle to grow.


Fast Facts for Red Potato Galaxy (MQN01 J004131.9-493704):

Credit: X-ray: NASA/CXC/Univ. Milano-Bicocca/W. Wang et al.; Infrared: NASA/ESA/CSA/STScI; Radio: ESO/NRAO/NAOJ/ALMA; Image processing: NASA/CXC/SAO/N. Wolk & P. Edmonds
Release Date: July 21, 2026
Scale: Image is about 20 arcsec (500,000 light-years) across.
Category:
Groups & Clusters of Galaxies, Quasars & Active Galaxies
Coordinates (J2000): RA 00h 41m 31.9s | Dec -49° 37´ 3.7"
Constellation: Phoenix
Observation Dates: 22 observations from July 2022 to Sept. 2023
Observation Time: 176 hours (7 days 8 hours)
Obs. ID: 25375, 25711-25730, 27667
Instrument:
ACIS
References: Wang W., et al., 2026, A&A, In press. DOI: 10.1051/0004-6361/202659351
Color Code: X-ray: blue; Infrared: red, green, and blue; Radio: red
Distance Estimate: About 11.7 billion light-years from Earth (z=3.25)


Tuesday, July 21, 2026

The Cosmic Wake of the Lighthouse Pulsar

Lighthouse Pulsar (PSR J1101-6101)
Credit: X-ray: Chandra: NASA/CXC/Stanford Univ./J. Dinsmore et al.; IXPE: NASA/MSFC/J. Dinsmore et al., Radio: CSIRO/ATNF/ATCA; Optical: 2MASS/UMass/IPAC-Caltech/NASA/NSF; Image processing: NASA/CXC/SAO/L. Frattare


Scientists using NASA’s IXPE (Imaging X-ray Polarimetry Explorer) directly measured the magnetic fields of PSR J1101−6101, a pulsar located within what is often referred to as the “Lighthouse” Nebula, for the first time.

A pulsar is a type of neutron star — the dense core leftover when a massive star collapses — with a strong magnetic field that spins incredibly fast. The pulsar at the center of the Lighthouse nebula is rotating at 16 times per second.

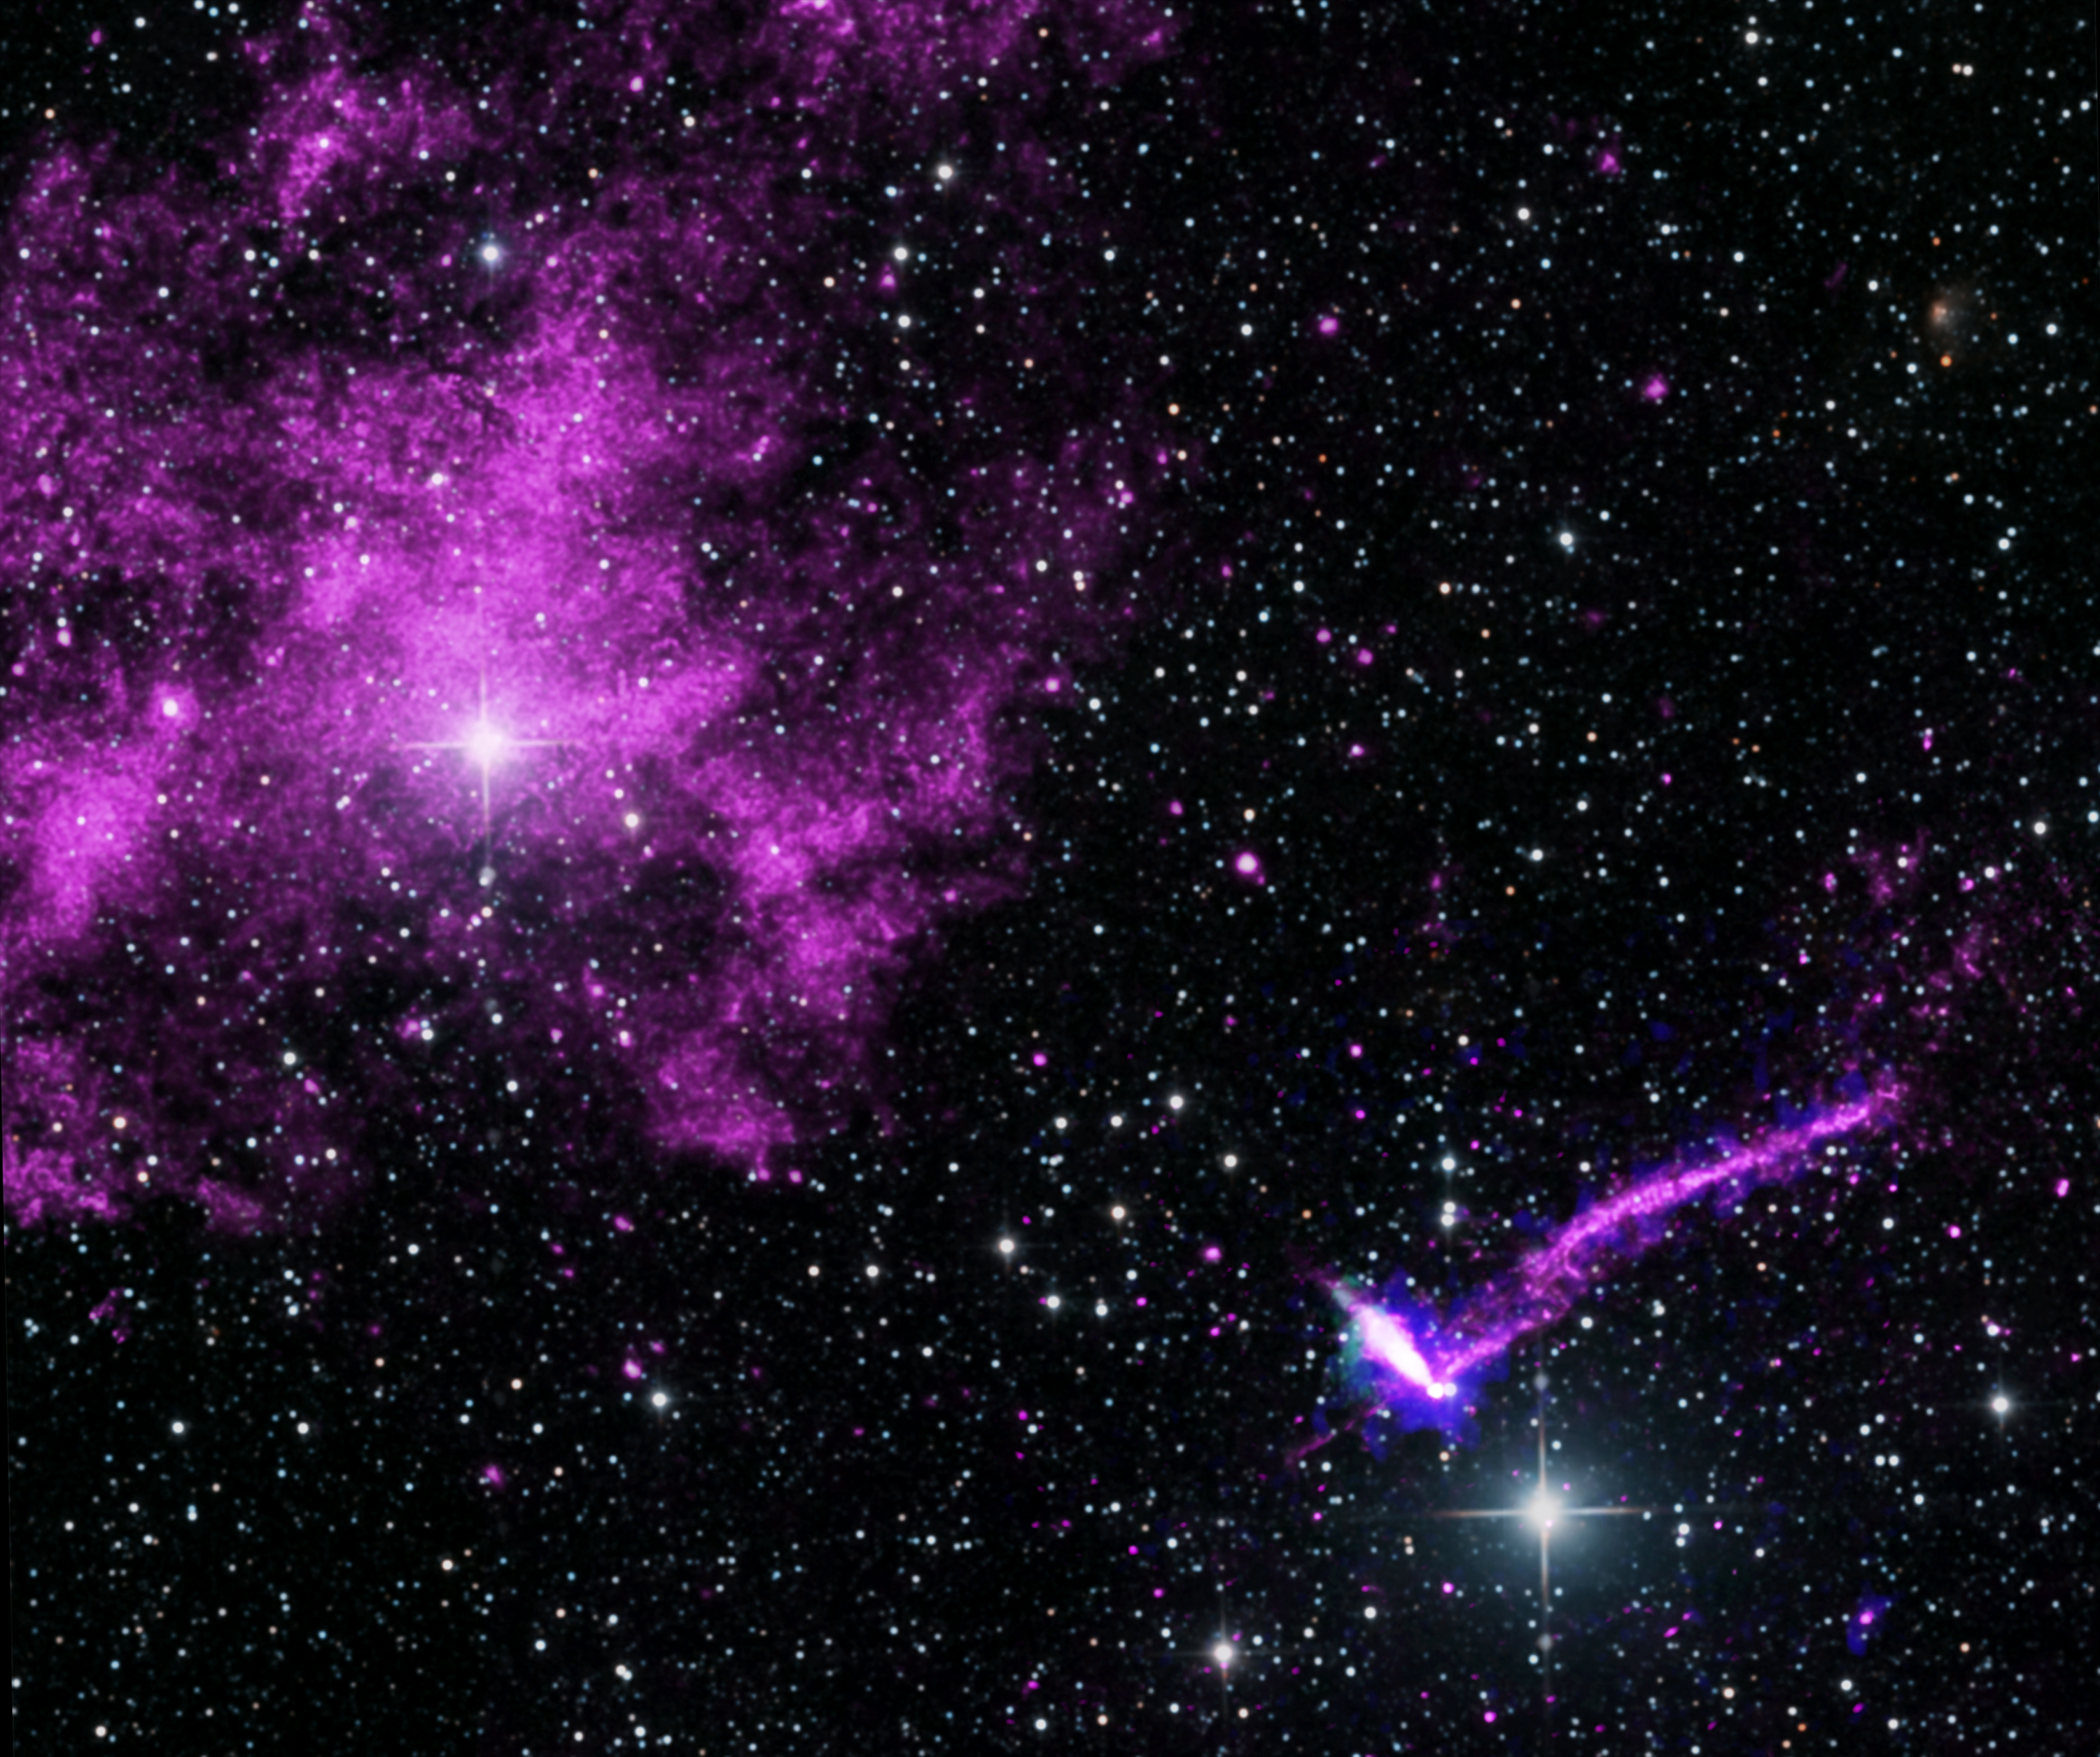
Astronomers studied two narrow offshoots extending from the Lighthouse pulsar to better understand how electrons at nearly the speed of light interact with the surrounding environment. When high-energy particles from the pulsar collide with the gas of interstellar space, they form a bow shock similar to the bow wave formed at the front of a speeding boat. Most particles become trapped behind this bow shock, forming the turbulent tail behind the pulsar. Previously, NASA’s Chandra X-ray Observatory captured this tail that extends for over 37 light-years, the longest jet from an object seen in the Milky Way at the time.

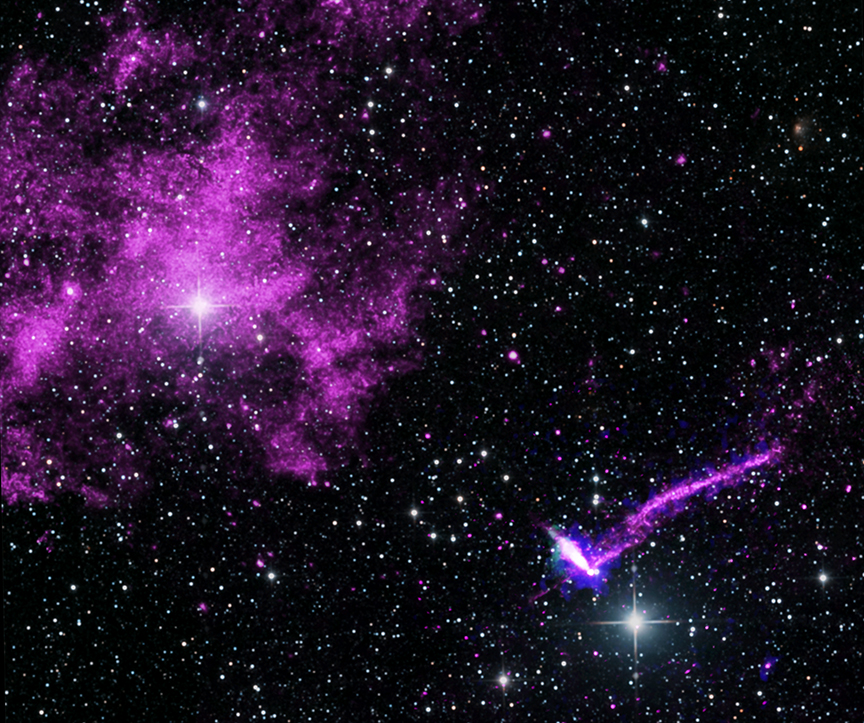
This graphic contains data from different telescopes that shows the region around the Lighthouse pulsar and its wake. In this composite image, X-ray data from NASA’s Chandra X-ray Observatory are purple, X-rays from NASA's IXPE are in blue, with radio emission captured by the Australia Compact Telescope Array in green. Optical light data from the 2MASS telescope shows the stars visible in this field of view.

A paper about the results recently published in the Astrophysical Journal. The IXPE mission, which continues to provide unprecedented data enabling groundbreaking discoveries about celestial objects across the universe, is a joint NASA and Italian Space Agency mission with partners and science collaborators in 12 countries. It is led by NASA’s Marshall Space Flight Center in Huntsville, Alabama. BAE Systems, Inc., headquartered in Falls Church, Virginia, manages spacecraft operations together with the University of Colorado’s Laboratory for Atmospheric and Space Physics in Boulder.

NASA's Marshall Space Flight Center manages the Chandra program. The Smithsonian Astrophysical Observatory's Chandra X-ray Center controls science operations from Cambridge, Massachusetts, and flight operations from Burlington, Massachusetts.


Visual Description:

This composite multiwavelength image captures the turbulent environment surrounding the Lighthouse pulsar, set against a vast, black background speckled with twinkling white and faint green stars. In the upper-left quadrant, a massive, cloud-like nebula glows in a textured, vibrant purple hue, anchored by a prominent four-pointed star shining brightly near its center. Moving toward the lower-right quadrant, the pulsar itself is located at the lower tip of a concentrated, brilliant whitish-blue elongated point of light. Extending outward from its core is a long, narrow, and slightly curved jet of purple and blue emission that streaks upward and to the right. This jet represents a massive 37-light-year tail of high-energy particles trailing behind the rapidly spinning star as it plow through interstellar space. This composite image contains X-ray data from NASA's Chandra X-ray Observatory in purple, additional X-ray from NASA's IXPE in blue, and radio data from CSIRO in green. The starfield is optical data from the 2MASS survey.


Fast Facts for Lighthouse Pulsar (PSR J1101-6101)

Credit: X-ray: Chandra: NASA/CXC/Stanford Univ./J. Dinsmore et al.; IXPE: NASA/MSFC/J. Dinsmore et al., Radio: CSIRO/ATNF/ATCA; Optical: 2MASS/UMass/IPAC-Caltech/NASA/NSF; Image processing: NASA/CXC/SAO/L. Frattare
Release Date: July 9, 2026
Scale: Image is about 22 arcmin (130 light-years) across.
Category:
Neutron Stars/X-ray Binaries
Coordinates (J2000): RA 11h 01m 44.9s | Dec -61° 01´ 39.6"
Constellation:
Carina
Observation Dates: 14 observations from Sept 2011 to Oct 2024
Observation Time: 126 hours 51 minutes (5 days 6 hours 51 minutes)
Obs. ID: 12420, 13787, 16007, 16517, 16518, 17421, 17422, 28352, 28519, 28520, 30570-30573
Instrument:
ACIS
References: Dinsmore, J. et al., 2026, accepted. DOI:10.48550/arXiv.2604.22914
Color Code: X-ray: Chandra: magenta; IXPE: blue; Radio: green; Optical: red, green, blue
Distance Estimate: About 21,000 light-years from Earth


Friday, July 10, 2026

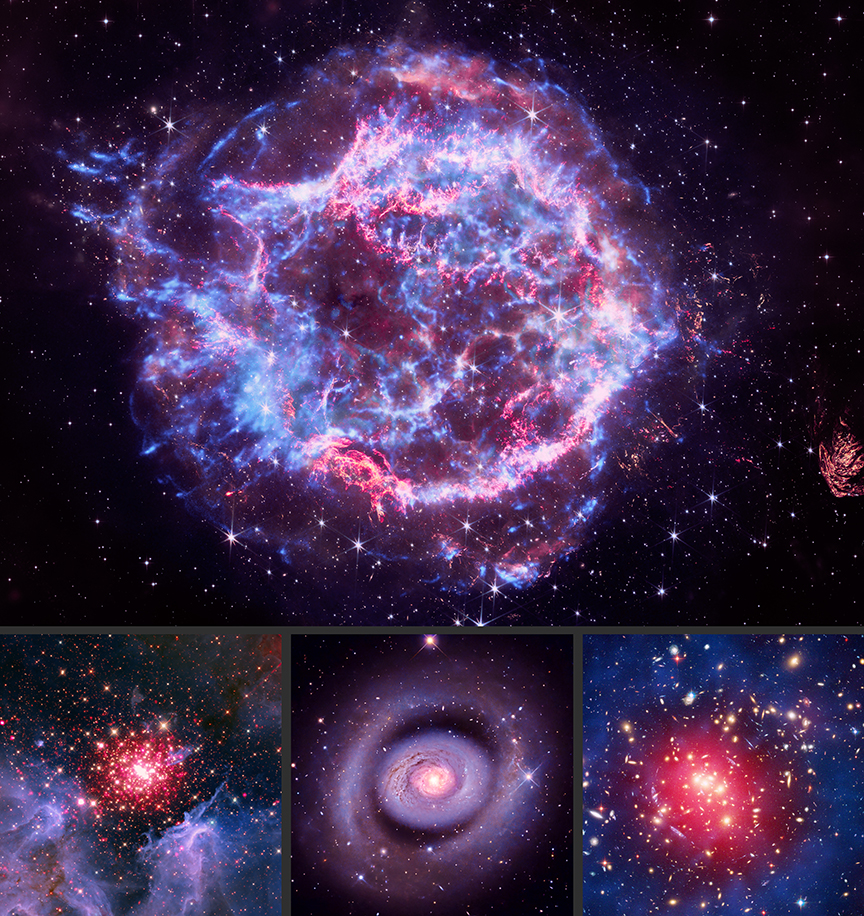
NASA's Chandra Releases 'Red, White, and Blue' Universe for US 250th

Cassiopeia A - NGC 3603 - NGC 4736 (M94) - ZwCl 0024+1652
Credit: NASA/CXC/SAO


In celebration of the 250th birthday of the United States, NASA has unveiled four cosmic images from its Chandra X-ray Observatory rendered in red, white, and blue that represent the wonders of the universe the agency explores. The images are accompanied by a trio of new sonifications — a technique that translates astronomical data into sounds.

The image set begins with Cassiopeia A in the top panel, where X-rays from Chandra (represented in blue and purple) have been combined with an infrared image from NASA’s James Webb Space Telescope (red and white). Chandra’s X-ray vision reveals the blast wave that tore through the star, as well as elements in the debris field like iron, calcium, and oxygen. Webb’s infrared data also shows the expanding shell of material from the explosion and cosmic dust throughout the remnant.

In the bottom row, the first image on the left is the nebula NGC 3603, which contains a massive cluster of stars and is located in the Milky Way galaxy. This new composite image contains Chandra’s X-ray data (red and white) and shows diffuse emission near the galaxy’s center along with point-like X-ray sources throughout the middle of the image. Optical, infrared, and ultraviolet light from NASA’s Hubble Space Telescope (red-orange, green, blue, and yellow) reveal stars in the center of the image and dust and gas toward the bottom. The combined layering of the colors makes this nebula and the stars forming within it appear primarily red, white, and blue, with X-rays showing the sparkling lights of young stars.

The middle panel of the bottom row is a new look at the galaxy NGC 4736, also known as Messier 94. In this image, X-rays of different wavelengths from Chandra (red, orange, and blue) are layered with a visible light image from astrophotographers using their telescopes on the ground (red, green, and blue). Messier 94 is a spiral galaxy with a bright inner ring around it, called a starburst ring, where new stars are forming, perhaps fueled by gas driven in the unique oval-shaped structure seen here.

The final image in this red, white, and blue quartet features ZwCl 0024+1652. This is a distant galaxy cluster in which astronomers have found evidence for dark matter by using specially processed data from Hubble (blue). Another image from Hubble reveals the individual galaxies in the cluster (appearing as yellow and white). X-ray data from Chandra shows the enormous reservoir of superheated gas that pervades this galaxy cluster (red) with much more mass than all the galaxies taken together.

New sonifications of the three images along the bottom row of this mosaic are also available, allowing listeners to experience data through sound.

The translation of NGC 3603 into sound begins with a left to right scan, where the brightnesses of the sources once again dictate volume. Chandra’s observations of compact sources sprinkled throughout the galaxy are heard as piano notes, while the diffuse X-ray emission is mapped to a range of audio frequencies. The Hubble optical data is played as sustained tones and acoustic guitar harmonics.


In the sonification of NGC 4736, the radar-like scan moves clockwise, and the brightness of the sources dictates the volume of the sounds. X-rays from Chandra have been turned into wind-like sounds that follow the shape of the X-ray emission. Neutron stars and stellar-mass black holes (known as “compact sources”) detected by Chandra are mapped to pitched tones on a glass marimba. Optical data from ground-based observations is mapped to musically pitched tones, creating a low drone, while stars and background galaxies are heard as a soft piano.


For ZwCl 0024+1652, the sonification begins as a circle on the outside of the image and moves inward. The volume is linked to the brightness of the data, reaching one peak as the circle passes over the dark matter detected by inference from Hubble optical observations and another as it reaches the core. The background stars are heard as a swelling glockenspiel-like sound, and the galaxies are played on a piano. Chandra’s X-rays, which dominate the center of the galaxy cluster and reveal superheated gas, are represented by airy synthesizer notes.


The sonification program is led by the Chandra X-ray Center (CXC) and included as part of NASA's Universe of Learning program. The collaboration was driven by visualization scientist Kimberly Arcand (CXC), Matt Russo, astrophysicist; and Andrew Santaguida, musician, SYSTEM Sounds project; along with Christine Malec, consultant. Previously released sonifications of data from from Cassiopeia A can be found at chandra.si.edu/sound.

NASA's Marshall Space Flight Center in Huntsville, Alabama, manages the Chandra program. The Smithsonian Astrophysical Observatory's Chandra X-ray Center controls science operations from Cambridge, Massachusetts, and flight operations from Burlington, Massachusetts.


Visual Description:

In celebration of the 250th birthday of the United States, this release includes a series of images featuring four wonders of the universe, rendered in red, white, and blue. The images contain X-ray data from the Chandra X-ray Observatory, optical and infrared data from the Hubble Space Telescope and the James Webb Space Telescope, as well as ground-based telescopes.

The main image set features composite images of the four individual objects; Cassiopeia A, NGC 3603, M94/NGC 4736, and ZwCl 0024+1652.

Cassiopeia A occupies the top panel of the frame, significantly larger than the other images in the set. The cloudy blast-wave of the supernova remnant is ring-like in shape, streaked with veins of iron, calcium, and oxygen. Here, presented in red, white, and blue, the remnant resembles an electrified donut, crackling with marbled veins of strawberry and blueberry icing.

At our lower left of the image set is the nebula NCG 3603, which contains a massive cluster of stars on the other side of the Milky Way galaxy. Here, a tight cluster of neon red and white stars packs the center of the image, dissipating as it reaches the outer edges of the panel. Sweeping in at the lower corners of the image are hazy blue clouds resembling sheets of gauze.

Centered at the bottom of the image set is the galaxy NGC 4736, also known as Messier 94 (M94). Here, the spiral galaxy is seen face on, with concentric pale violet cloud rings flecked with scores of stars in white, pale blue, soft red, and golden yellow. The inner ring of the galaxy is bright, and rosy yellow in color. This is a starburst ring, where new stars are forming.

At our bottom right of the image set is the distant galaxy cluster ZwCl 0024+1652. The image is packed with streaks and specks in golden yellow and brilliant white. Upon close inspection, each streak and speck is revealed to be an individual galaxy, some with discernible spiral shapes. At the center of the image is a round pool of bright red light, surrounded by royal blue haze. The red light represents X-ray observations by Chandra, which reveal an enormous reservoir of superheated gas pervading the cluster. The blue haze represents specially-processed data from Hubble, suggesting evidence of dark matter.

This release also includes new sonifications of the three images presented in the bottom row of this data set, allowing listeners to experience the data through sound.


Fast Facts for Cassiopeia A:

Credit: X-ray: NASA/CXC/SAO; IR: NASA/ESA/CSA/STScI; Image Processing: NASA/CXC/SAO/L. Frattare and K. Arcand
Release Date: June 30, 2026
Scale: Image is about 8 arcmin (25.5 light-years) across.
Category:
  Supernovas & Supernova Remnants
Coordinates (J2000): RA: 23h 23m 26.7s | Dec: +58° 49' 03.00"
Constellation:
Cassiopeia
Observation Date(s): Nine observations in 2004: Feb 8, Apr 14, 18, 20, 22, 25 28, May 1, 5
Observation Time: 277 hours and 58 minutes (11 days 13 hours 58 minutes)
Obs. IDs: 4634-4639, 5196, 5319-5320
Instrument:
ACIS
Color Code: X-ray: blue and red; Infrared: red and white
Distance Estimate: About 11,000 light-years from Earth


Fast Facts for NGC 3603:

Credit: X-ray: NASA/CXC/SAO; Optical/IR/UV (Hubble): NASA/ESA/CSA/STScI/AURA; Image Processing: NASA/CXC/SAO/L. Frattare and K. Arcand
Release Date: June 30, 2026
Scale: Image is about 3 arcmin (17 light-years) across.
Category:
Normal Stars & Star Clusters
Coordinates (J2000): RA: 11h 15m 9.09s | Dec: -61° 16' 17.0"
Constellation:
Carina
Observation Date(s): Five observations from May 2000 to October 2011
Observation Time: 138 hours 8 minutes (5 days 18 hours 8 minutes)
Obs. IDs: 633, 12328-12330, 13162
Instrument:
ACIS
Color Code: X-ray: red and white ; Infrared: red and yellow; Ultraviolet: green, blue, and white
Distance Estimate: About 20,000 light-years from Earth


Fast Facts for NGC 4736 (M94):

Credit: X-ray: NASA/CXC/SAO; Optical:Brian Brennan and Remi Lacasse; Image Processing: NASA/CXC/SAO/L. Frattare and K. Arcand
Release Date: June 30, 2026
Scale: Image is about 17 arcmin (94,000 light-years) across.
Category:
Normal Galaxies & Starburst Galaxies
Coordinates (J2000): RA: 12h 50m 53.1s | Dec: +41° 07' 13.7"
Constellation: Canes Venatici
Observation Date(s): May 13, 2000
Observation Time: 13 hours 50 minutes
Obs. IDs: 808
Instrument:
ACIS
Color Code: X-ray: red, green, and blue; Optical: red, green, and blue
Distance Estimate: About 19 million light-years from Earth


Fast Facts for ZwCl 0024+1652:

Credit: X-ray: NASA/CXC/SAO; Optical and Dark Matter: NASA/ESA/M.J. Jee; Image Processing: NASA/CXC/SAO/L. Frattare
Release Date: June 30, 2026
Scale: Image is about 3.3 arcmin (9,100 light-years) across.
Category:
Groups & Clusters of Galaxies
Coordinates (J2000): RA: 00h 26m 34.5s | Dec: +17° 09′ 44.0"
Constellation:
Pisces
Observation Date(s): 3 Observations from Sep, 2000 to Aug, 2016
Observation Time: 29 hours 30 minutes (1 day 5 hours 30 minutes)
Obs. IDs: 929, 7717, 18458
Instrument:
ACIS
Color Code: X-ray: red; Optical: red, green, and blue; Dark Matter: blue
Distance Estimate: About 9.5 million light-years from Earth


Monday, July 06, 2026

NASA's Chandra Examines Milky Way at Arms' Length


  • The outer spiral arms of the Milky Way galaxy may be farther away than scientists previously thought.

  • This discovery was made by measuring light echoes from distant gamma-ray bursts using NASA’s Chandra and ESA’s XMM-Newton.

  • Even a small change in the distance to these arms has a significant impact on our understanding of the Milky Way’s structure.

  • While this technique is powerful, gamma-ray bursts are rare so it may be difficult to use them to measure distances to other spiral arms.


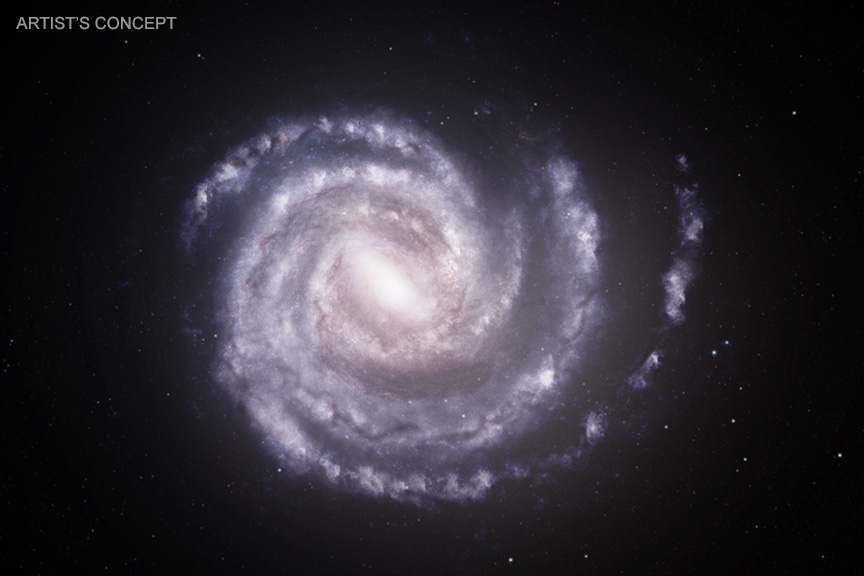
The graphic illustrates a new result that indicates the outer spiral arms in the Milky Way galaxy may reach wider than previously thought, according to data from NASA’s Chandra X-ray Observatory and ESA’s XMM-Newton. This finding could lead astronomers to adjust their understanding of our home galaxy’s structure and is described in our latest press release.

The sequence begins with an artist’s concept showing the Milky Way galaxy as seen from above with the estimated positions of spiral arms based on previously-obtained data from various telescopes. The second artist’s concept shows new positions of the two spiral arms most distant from the center of the galaxy, that have been adjusted based on X-ray data from Chandra and XMM-Newton.

Illustration Showing Updated Spiral Arm Positions
An artist’s concept showing the Milky Way galaxy as seen from above, with the estimated positions of spiral arms based on previous data, in blue. Overlaid on this is an updated view of the Milky Way showing different positions for the two outermost spiral arms, shown in red and bordered by dashed lines. Both arms may be more distant than previously thought, based on newly processed X-ray data from Chandra and XMM. Credit: NASA/CXC/SAO/M.Weiss

A team of researchers determined the distances to these spiral arms by studying rings around gamma-ray bursts (GRBs), some of the brightest bursts of light in the universe. GRBs happen when massive stars collapse or neutron stars merge, and they are located at enormous distances — well beyond the confines of our galaxy. The distance measurement technique capitalized on the phenomenon of light echoes, where the light from the GRB bounced off intervening dust clouds in the spiral arms. The diameters of the rings in X-rays give the distances to Earth, with larger rings being generated by dust clouds closer to us.

A composite image shows one set of light echoes used in the new study to determine the distance to the Milky Way’s spiral arms. This image combines X-ray data from Chandra (blue) and optical data from Pan-STARRS (red, green and blue) showing X-ray rings generated by the GRB. The GRB is located at the center of the circles defining the rings, to the left of the X-ray data outlined by the white square.

X-ray & Optical Image Showing Rings from Dust Clouds.Credit: X-ray: NASA/CXC/INAF/B. Vaia et al.; Optical: Pan-STARRS; Image processing: NASA/CXC/SAO: N. Wolk, P. Edmonds


The researchers used three different GRBs to determine the distances to three spiral arms in the Milky Way. In order of increasing distances from the Galactic Center, they are the Perseus, the Outer, and the Outer Scutum-Centaurus arms. Along the direction to one of the GRBs they found that both the Outer and Outer Scutum-Centaurus arms are about 10% more distant than astronomers previously thought. The differences in the positions of these spiral arms based on the new study are depicted in another artist’s illustration where the updated positions of outermost spiral arms are shown in red and bordered by dashed lines.

Although this technique is a major improvement, it may be difficult to use it for further measurements because bright GRBs that are visible through the plane of the galaxy are rare.

A paper describing these results, led by Beatrice Vaia of Scuola Universitaria Superiore IUSS Pavia and University of Trento in Italy, has been recently published by the Astronomy & Astrophysics journal and is available here. NASA's Marshall Space Flight Center manages the Chandra program. The Smithsonian Astrophysical Observatory's Chandra X-ray Center controls science operations from Cambridge, Massachusetts, and flight operations from Burlington, Massachusetts.


Fast Facts for Milky Way Spiral Arms:

Credit: X-ray: NASA/CXC/INAF/B. Vaia et al.; Optical: Pan-STARRS; Image processing: NASA/CXC/SAO/N.Wolk & P.Edmonds; Illustration: NASA/CXC/SAO/M.Weiss
Release Date: July 1, 2026
Scale: Image is about 22 arcmin (400 light-years) across.
Category: Milky Way Galaxy
Coordinates (J2000): RA 19h 12m 24s | Dec +19° 43´ 46"
Constellation:
Sagitta
Observation Dates: October 22, 2022
Observation Time: 6 hours 2
Obs. ID: 27517
Instrument:
ACIS
References: B. Vaia et al. 2026, A&A, in press
Color Code: X-ray: blue; Optical: red, green, and blue
Distance Estimate: About 62,000 light-years from Earth


Wednesday, June 24, 2026

NASA's Chandra Finds Unexpected Fireworks in Aftermath of Stellar Explosions


  • Astronomers have uncovered a population of supernova remnants in a nearby galaxy that are unexpectedly changing in X-ray brightness.

  • Using Chandra data spanning 14 years, researchers found 22 supernova remnants that brighten and dim dramatically in X-rays.

  • Typically, supernova remnants over a hundred years old just steadily decrease their X-ray output over time.

  • The researchers think this unusual behavior comes from stellar companions to the supernovas that survived the explosions.


This graphic shows two of the X-ray sources in a nearby galaxy that are changing their brightness in surprising ways as described in our latest press release. By analyzing data from NASA’s Chandra X-ray Observatory that span over 14 years, researchers found over 20 previously identified supernova remnants — remains from stars that exploded — that vary unexpectedly in X-ray brightness in Messier 83 (M83). These represent roughly half of the X-ray sources associated with supernova remnants in their sample in M83.

The panel on the left contains a composite image of M83 with X-rays from Chandra (red, green, and blue) and optical light data from NASA’s Hubble Space Telescope (red, green, and blue). The two varying Chandra sources are circled in the composite image and close-up timelapse images of these sources are shown in the panels on the right.

This collection of varying sources is surprising because astronomers expect that about a hundred years after the explosion that created them, supernova remnants do not change their brightness dramatically. Rather, they typically fade in X-rays slowly over time. It would be unusual for M83 to have so many explode less than a century ago.

The most likely explanation given by the research team is that they uncovered a population of stellar survivors — stars that lived through their partner's destruction in a supernova explosion. In this scenario, each variable X-ray source began as a pair of massive stars orbiting each other. The more massive star collapsed and exploded as a supernova, leaving behind a black hole or ultra-dense neutron star. Its companion survived.

Galaxy M83 in X-ray and Optical Light. Credit: X-ray: NASA/CXC/SAO; Optical: NASA/ESA/AURA/STScI, Hubble Heritage Team, W. Blair (STScI/Johns Hopkins University) and R. O'Connell (University of Virginia); Image Processing: NASA/CXC/SAO/A. Jubett, L. Frattare and P. Edmonds

Chandra detects X-rays produced by infalling material that becomes superheated by the intense gravitational pull of the compact object. Such systems — known as high-mass X-ray binaries (HMXBs) — are among the most variable X-ray sources in the universe and may be the cause of the variations seen in M83’s supernova remnants. At the distance of M83, the supernova remnants appear as point sources even though they are much larger than the HMXBs they contain, implying that the two sources of X-rays cannot be separated in images.

Astronomers have known about HMXBs for decades, but the difference with this group in M83 is their connection to supernova remnants. Previously only a handful of supernova remnants associated with HMXBs were known across observations of all galaxies and so it is unprecedented to find more than twenty strong candidates in just one galaxy.

Galaxy M51 in X-ray and Optical Light. This is a composite image of the galaxy M51 combining data from NASA's Chandra X-ray Observatory (purple) with optical data (red, green and blue) taken with ground-based telescopes by a team of astrophotographers. A surprisingly high number of X-ray sources associated with supernova remnants in M51 show large changes in brightness, similar to the behavior seen in M83. Credit: Chandra X-ray Data: NASA/CXC/SAO; Astrobin/Optical Groundbased: C.Björk, T.Bähnck, S.Donoso, J.Gentillon, A. and D.Grelin, S.Guberski, R. Hall, T.Heuberger, J.Jacks, P.Kent, Br.Meyers, W.Ostling, N.Puig, T.Schaeffer, F.Schöfbänker, M.Vasilev

There is another possible explanation for the variability seen in the Chandra sources in M83. Rather than feeding off a companion star, the black hole or neutron star may be recapturing some of the material blasted outward in the original explosion. In a possible example of cosmic recycling, debris from the explosion falls back onto the very object the supernova created. The researchers suggest that both explanations could be happening in M83 with different sources in our sample having different origins.

These results were presented at the 248th meeting of the American Astronomical Society meeting in Pasadena, CA. In addition, a paper describing these results, led by Andrea Prestwich (Catholic University, Washington, DC), has been published in The Astrophysical Journal.

NASA's Marshall Space Flight Center in Huntsville, Alabama, manages the Chandra program. The Smithsonian Astrophysical Observatory's Chandra X-ray Center controls science operations from Cambridge, Massachusetts, and flight operations from Burlington, Massachusetts.

Quick Look: NASA's Chandra Finds Unexpected Fireworks in Aftermath of Stellar Explosions


Visual Description:

This release features a composite image of the nearby galaxy Messier 83, and short timelapse videos of two curious supernova remnants hidden inside.

In the composite image, Messier 83, or M83, is shown to have a spiral structure, viewed straight on. At the center is a brilliant white and yellow pool of light. From that light, spiral arms of hot pink cloud corkscrew out in wide, sweeping arches. The galaxy is covered in a faint grey haze, and flecked with red, green, blue, white, and yellow dots.

In an annotated version of the composite image, two tiny dots to our lower right of center are highlighted by white circles. These are two of the supernova remnants being considered by researchers. Each is examined further in a separate timelapse video.

Over a 14-year period from 2000 to 2014, astronomers pointed NASA’s X-ray observatory at the M83 galaxy. They discovered that about half of the X-ray sources believed to be supernova remnants, the aftermath of stellar explosions, were exhibiting dramatic changes in brightness. This result was entirely unexpected.

Those changes in brightness are highlighted in the timelapse videos. In each video, a series of static images flashes by, focused on one of the two X-ray sources once believed to be supernova remnants. In the videos, the X-ray sources appear as bright blue blobs with glowing cores. But in each image, taken months or years apart, the shapes change, as does the intensity of the blue color, and the brightness of the core. By presenting the substantively different images of the same objects one after another in quick succession, short timelapse videos are created.

The most likely explanation for the changes in brightness is that the team has uncovered a population of stellar survivors, stars that lived through an orbiting partner’s destruction in a supernova explosion. Material is being pulled from the surviving star onto the black hole or neutron star that formed in the supernova, a process known to cause rapid changes in X-ray brightness.


Fast Facts for M83:

Credit: X-ray: NASA/CXC/SAO; Optical: NASA/ESA/AURA/STScI, Hubble Heritage Team, W. Blair (STScI/Johns Hopkins University) and R. O'Connell (University of Virginia); Image Processing: NASA/CXC/SAO/A. Jubett, L. Frattare and P. Edmonds
Release Date: June 15, 2026
Scale: Image is about 9.5 arcmin (41,000 light-years) across.
Category:
Normal Galaxies & Starburst Galaxies, Supernovas & Supernova Remnants
Coordinates (J2000): RA 13h 37m 00.80s | Dec -29° 51´ 58.60"
Constellation:
Hydra
Observation Dates: 13 pointings between April 2000 and June 2014
Observation Time: 228 hours 2 minutes (9 days 12 hours 2 minutes)
Obs. ID: 793, 2064, 12992-12996, 13202, 13241, 13248, 14332, 14342, 16024
Instrument:
ACIS
Also Known As: NGC 5236
References: Prestwich, A. et al., 2026,
ApJ, 1004, 154.
Color Code: X-ray: red, green, blue; Optical: red, green, blue


Monday, May 18, 2026

Galaxy Cluster Relaxed Now, but was Wild in the Past

Abell 2029
Credit: X-ray: NASA/CXC/CfA/C. Watson et al.; Optical: PanSTARRS;
Image Processing: NASA/CXC/SAO/N. Wolk and P. Edmonds

JPEG (172.4 kb) - Large JPEG (2 MB) - Tiff (54.5 MB) - More Images

A Tour of Abell 2029 - More Videos


  • New data from NASA’s Chandra X-ray Observatory suggests an event-filled past for the galaxy cluster Abell 2029.

  • The X-rays reveal evidence for a collision with a smaller cluster about four billion years ago.

  • A sloshing spiral structure was formed when the smaller cluster made its first pass through Abell 2029, pulling its gas sideways.

  • Galaxy clusters are the largest structures in the Universe held together by gravity and are bellwethers for cosmic growth.


The galaxy cluster Abell 2029 is sometimes described as “the most relaxed cluster in the Universe.” This moniker does not arise from some sort of mellow vibe, but rather because of how calm and undisturbed the superheated gas that pervades the cluster appears to be.

New observations from NASA’s Chandra X-ray Observatory clearly show that Abell 2029 had a much more colorful history than its current disposition suggests. The latest study finds that Abell 2029 is still settling down after a raucous collision with another smaller cluster about four billion years ago.

Galaxy clusters are the largest structures in the Universe held together by gravity. They are made up of hundreds or even thousands of galaxies, unseen dark matter, and a huge amount of gas that fills in the space between the galaxies. This gas is typically heated to millions of degrees, which makes it glow in X-ray light.

A team led by astronomers from Boston University (BU) and the Center for Astrophysics | Harvard & Smithsonian (CfA) obtained the deepest X-ray observation ever made of this cluster using Chandra. The results are described in an Astrophysical Journal paper led by Courtney Watson from BU and CfA.

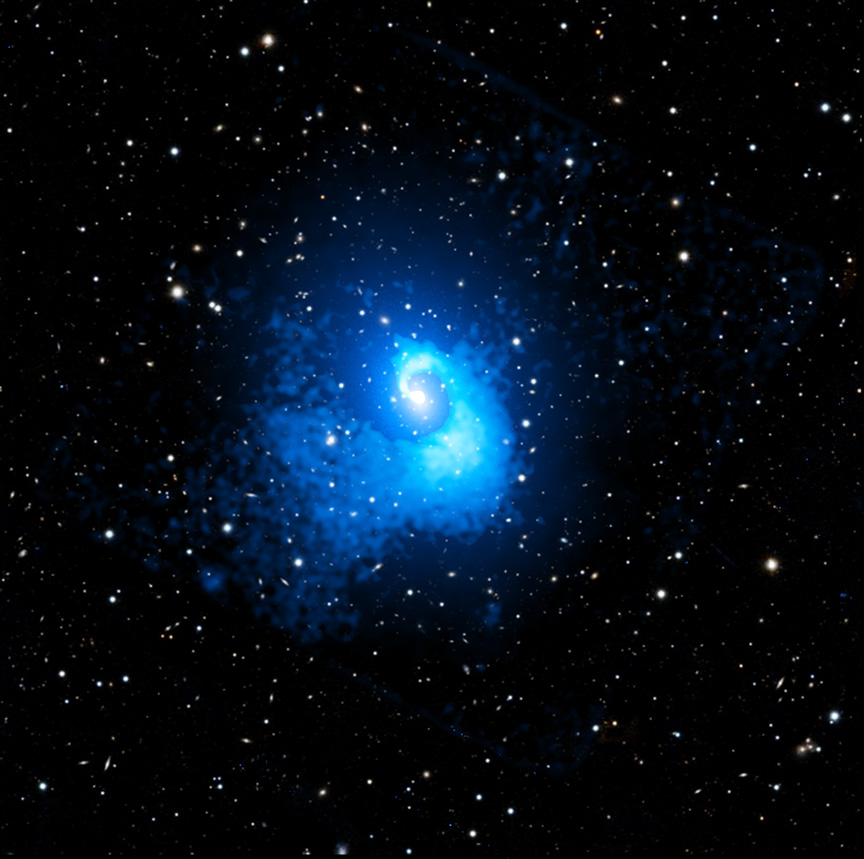
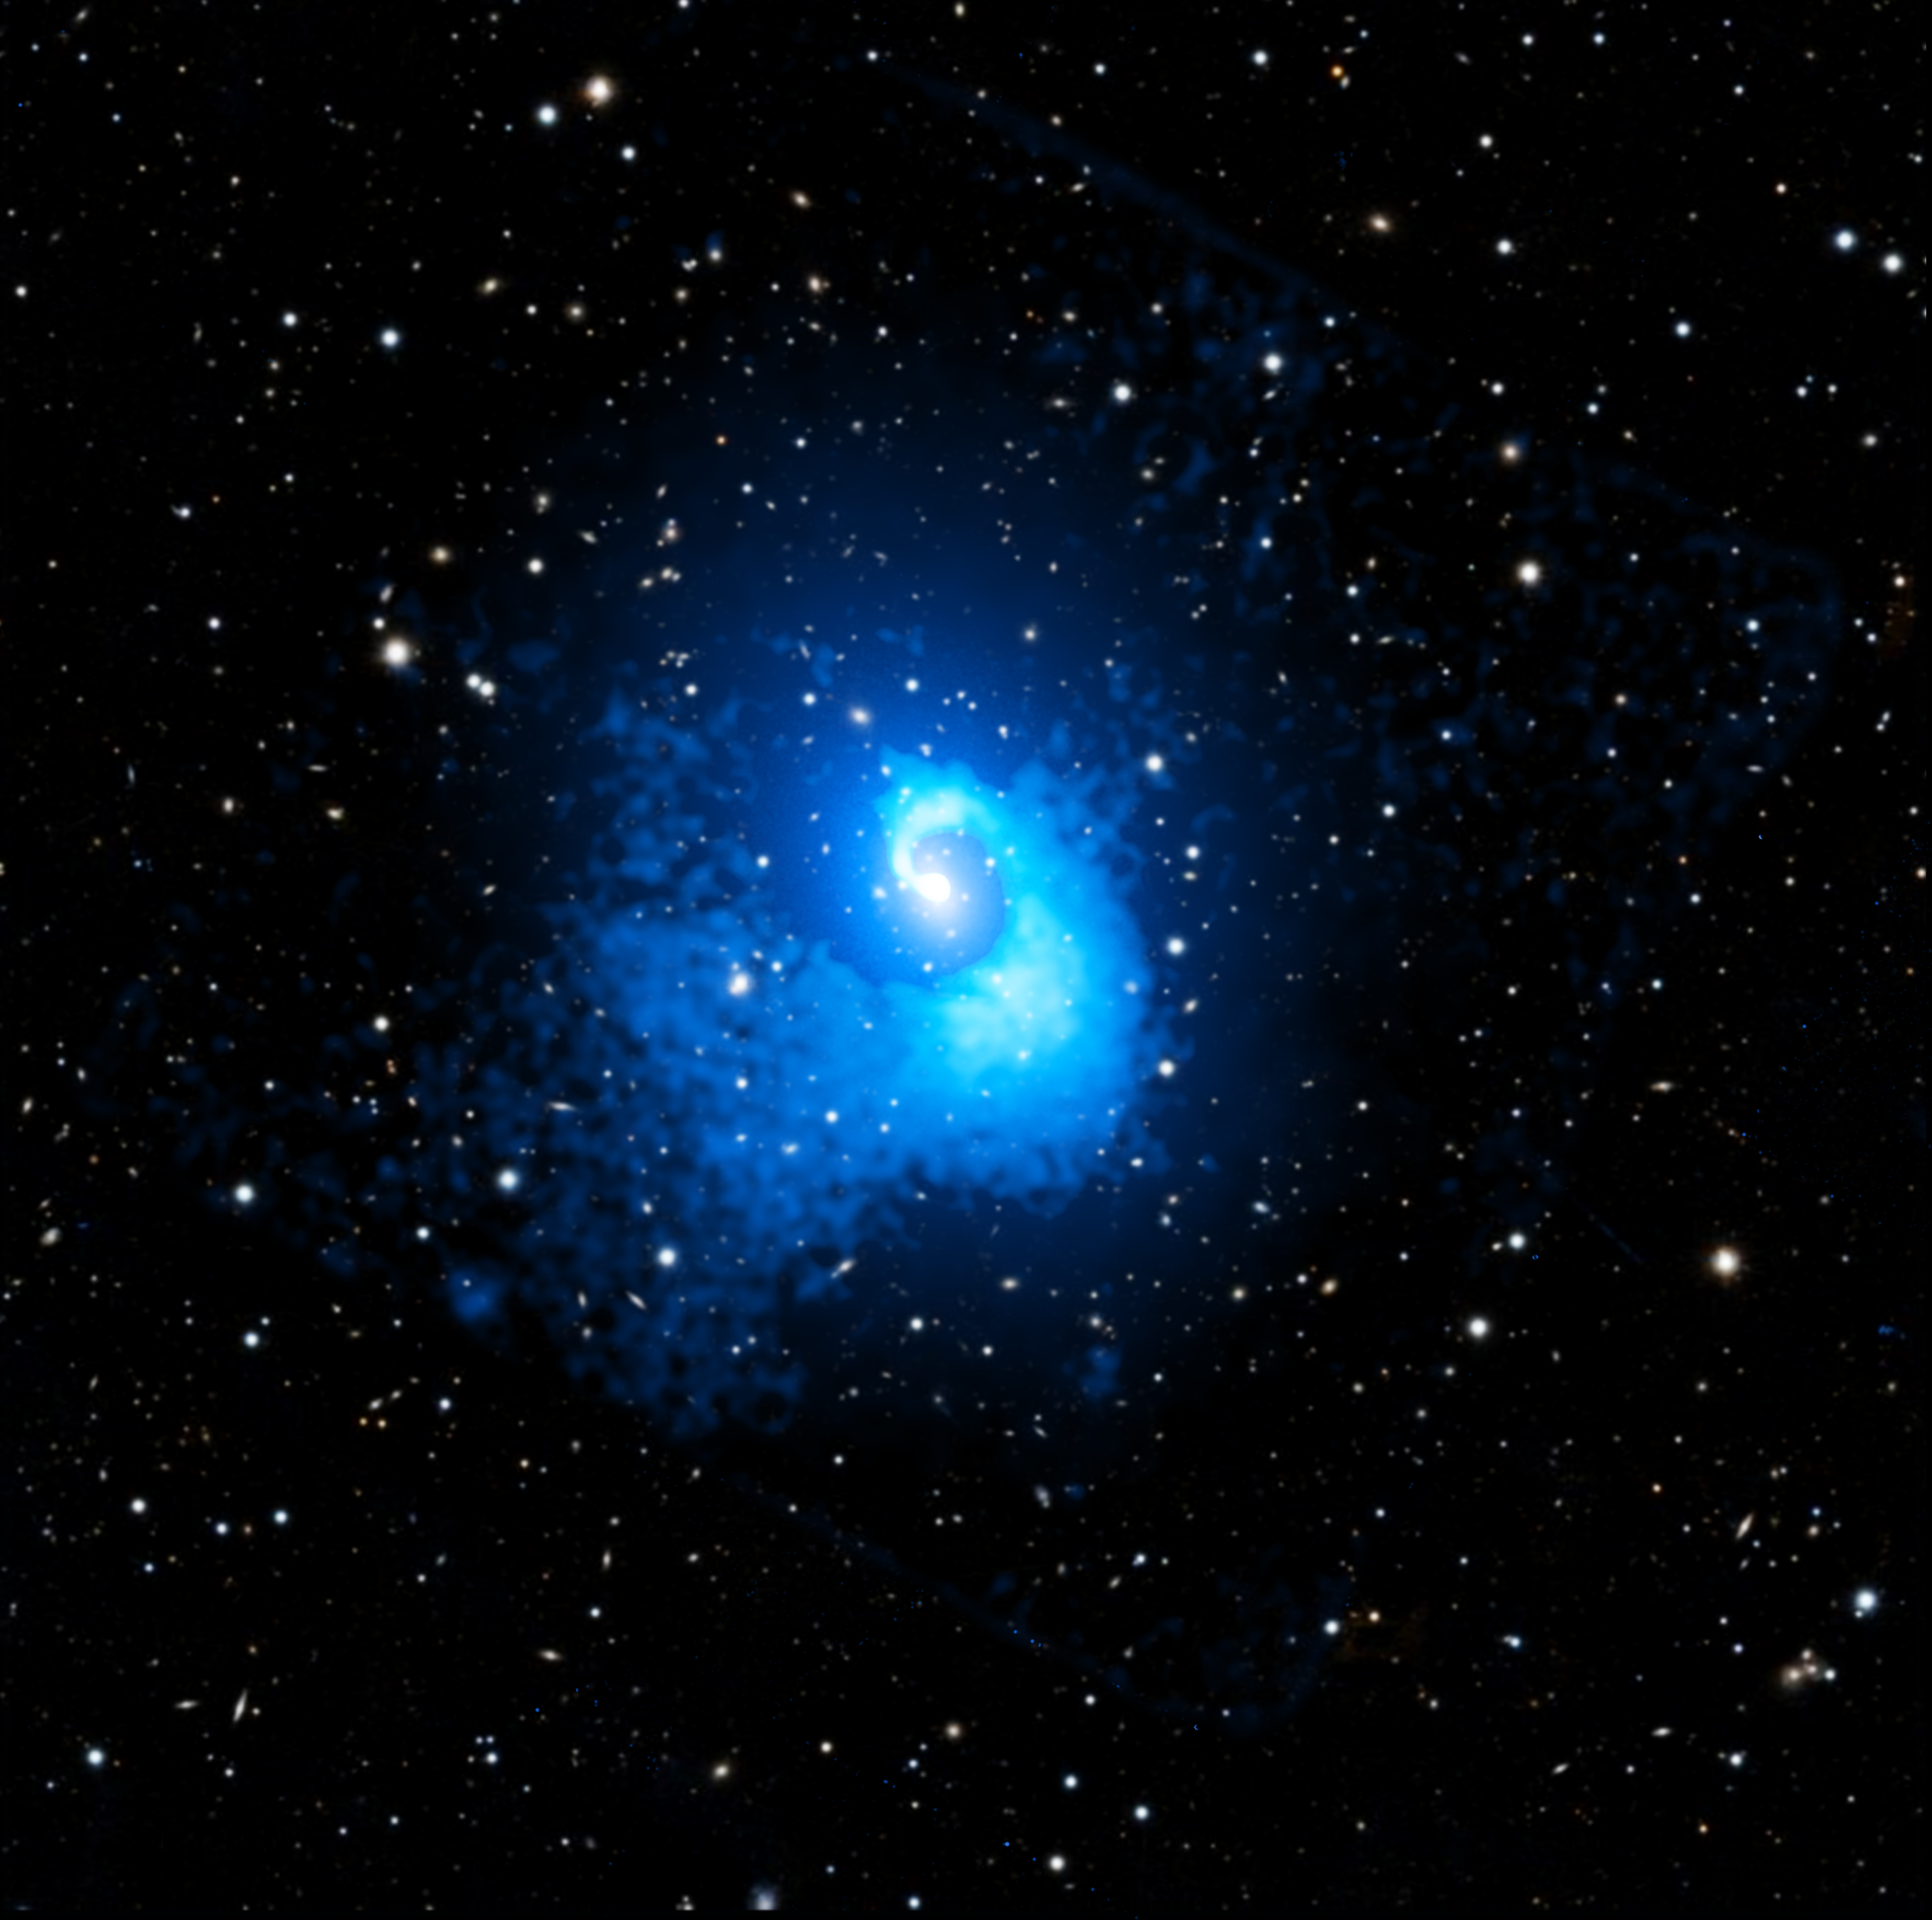
The Chandra data reveal clear signs that this cluster did not have a mundane history. This new composite image shows evidence for the cluster’s previous shenanigans in the nautilus-like shape in the Chandra data (blue). Optical light from stars and galaxies in the same field of view appears mainly white in an image from Pan-STARRS, a telescope in Hawaii.

The team think the spiral shape in the hot gas formed when gas in the cluster sloshed to the side because of the gravitational effects of the cluster collision — similar to how wine moves in a wine glass. The sloshing spiral in Abell 2029 is one of the longest ever seen, extending about two million light-years from the center of the cluster.

Abell 2029, "splash" and "bay" features labeled. Credit: X-ray: NASA/CXC/CfA/C. Watson et al.; Optical: PanSTARRS; Image Processing: NASA/CXC/SAO/N. Wolk and P. Edmonds


Computer simulations of the collision suggest that the smaller cluster was about ten times less massive than the larger cluster. The sloshing spiral formed when the smaller cluster made its first pass through the larger cluster, pulling its gas sideways. The gravity of the larger cluster then caused the other cluster to slow down and get pulled back in for a second collision. This drove a shock front and left behind a wake of material, forming the splash region.

To uncover these various features the authors used a special technique that examined how much the cluster’s hot gas deviates from a symmetrical shape. Most of the hot gas is symmetrical and is approximately shaped like an oval. The authors removed (“subtracted”) this symmetrical oval shape from the original X-ray image. The remaining X-ray emission in the “subtracted image” clearly shows the unusual features of the sloshing spiral, the bay and the splash area. The shock front is too faint to be seen in this image.

The new composite image combines both the original X-ray and the subtracted X-ray images of the deep Chandra observations of Abell 2029. The subtracted X-ray image (light blue) strikingly shows the sloshing spiral. Most of the original X-ray image is a darker blue color, apart from the center of the image, which is light blue. Two other features — the bay and the splash area — are labeled in an annotated version. The brightness of the original image has been reduced in this image to better show the subtracted image.

Courtney Watson conducted this work as a graduate student at BU and a predoctoral fellow at CfA. In addition to Watson, the authors of the paper are Elizabeth Blanton (Boston University), who was the Principal Investigator for the Chandra observations, Scott Randall (CfA), Tracy Clarke (Naval Research Laboratory), and John ZuHone (CfA).

NASA's Marshall Space Flight Center in Huntsville, Alabama, manages the Chandra program. The Smithsonian Astrophysical Observatory's Chandra X-ray Center controls science operations from Cambridge, Massachusetts, and flight operations from Burlington, Massachusetts.

There are several other key pieces of evidence for the past bash, never before seen together in a cluster, allowing the team to trace the collision history of the cluster in unprecedented detail. For example, the team sees hints of a wide “splash” of cooler gas created by the collision. There may also be a shock wave — akin to a sonic boom from a supersonic plane — in the superheated gas left over from the collision. Finally, there is a “bay” feature in the hot gas, which the researchers think might be caused by an overlap between the outer parts of the spiral and gas stripped away from the smaller cluster as it passed through the larger one. Though the authors think it is a relic from the collision, other explanations for this structure are also possible.


Visual Description:

This release features a composite image of a galaxy cluster with a unique spiral shape, giving it the appearance of a giant galactic seashell floating in the star-speckled blackness of space.

In this composite image, the surrounding stars and individual galaxies appear white, captured in optical light from Pan-STARRS, a telescope in Hawaii. But much of the spiraling cluster is rendered in neon blues, representing X-ray gas observed by Chandra. This super-heated gas fills the space between galaxies, giving the cluster its spiral shape when observed by scientists using an X-ray telescope.

Here, the blue spiral begins as a pale blue dot at the center of the cluster. The spiral stream of light and dark neon blue gas then widens as it moves away from the center of the cluster, gently corkscrewing one full rotation as it extends two-million lightyears into the distance.


Fast Facts for Abell 2029

Credit: X-ray: NASA/CXC/CfA/C. Watson et al.; Optical: PanSTARRS; Image Processing: NASA/CXC/SAO/N. Wolk and P. Edmonds
Release Date: May 12, 2026
Scale: Image is about 25 arcmin (7.2 million light-years) across.
Category:
Groups & Clusters of Galaxies
Coordinates (J2000): RA 15h 10m 56.1s | Dec +05° 44´ 40.0"
Constellation:
Virgo
Observation Dates: 24 observations from Apr 12, 2000 to Jun 6, 2023
Observation Time: 143 hours 3 minutes (5 days 23 hours 3 minutes)
Obs. ID: 891, 4977, 6101, 25496, 25814-25826, 26380, 26393, 26420, 26428, 27805, 27853, 27848
Instrument:
ACIS
References: Watson, C.B., et al., 2026, ApJ, 996, 106.
Color Code: X-ray: blue and white; Optical: red, green, and blue
Distance Estimate: About 1.0 billion light-years from Earth (z~0.0767)


Saturday, May 02, 2026

NASA Connects Little Red Dots With Chandra, Webb

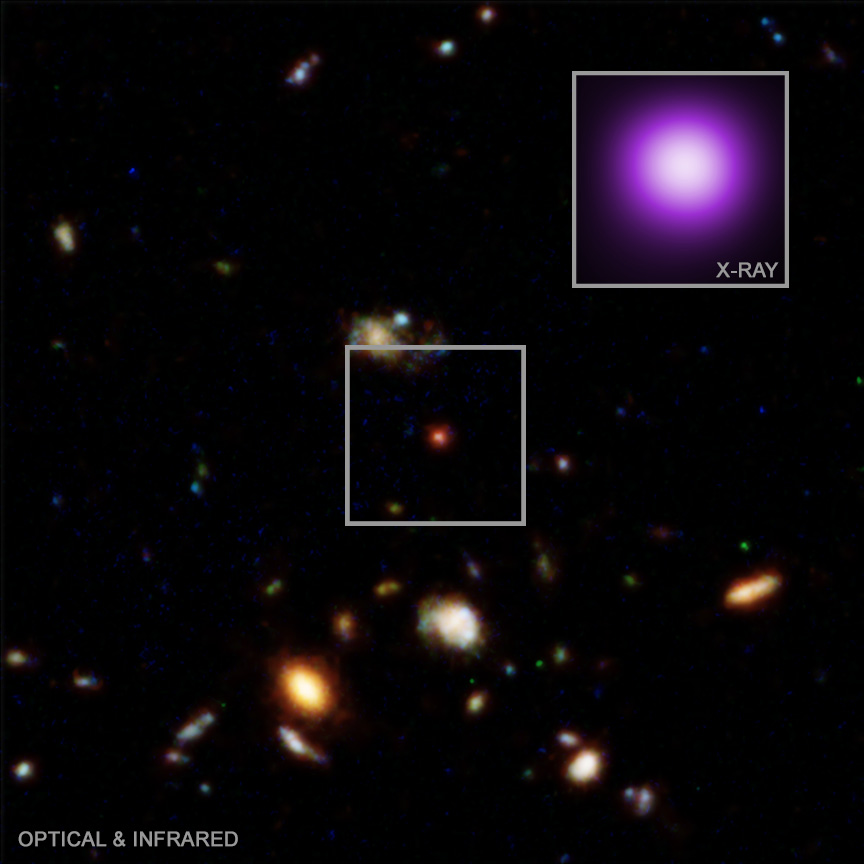
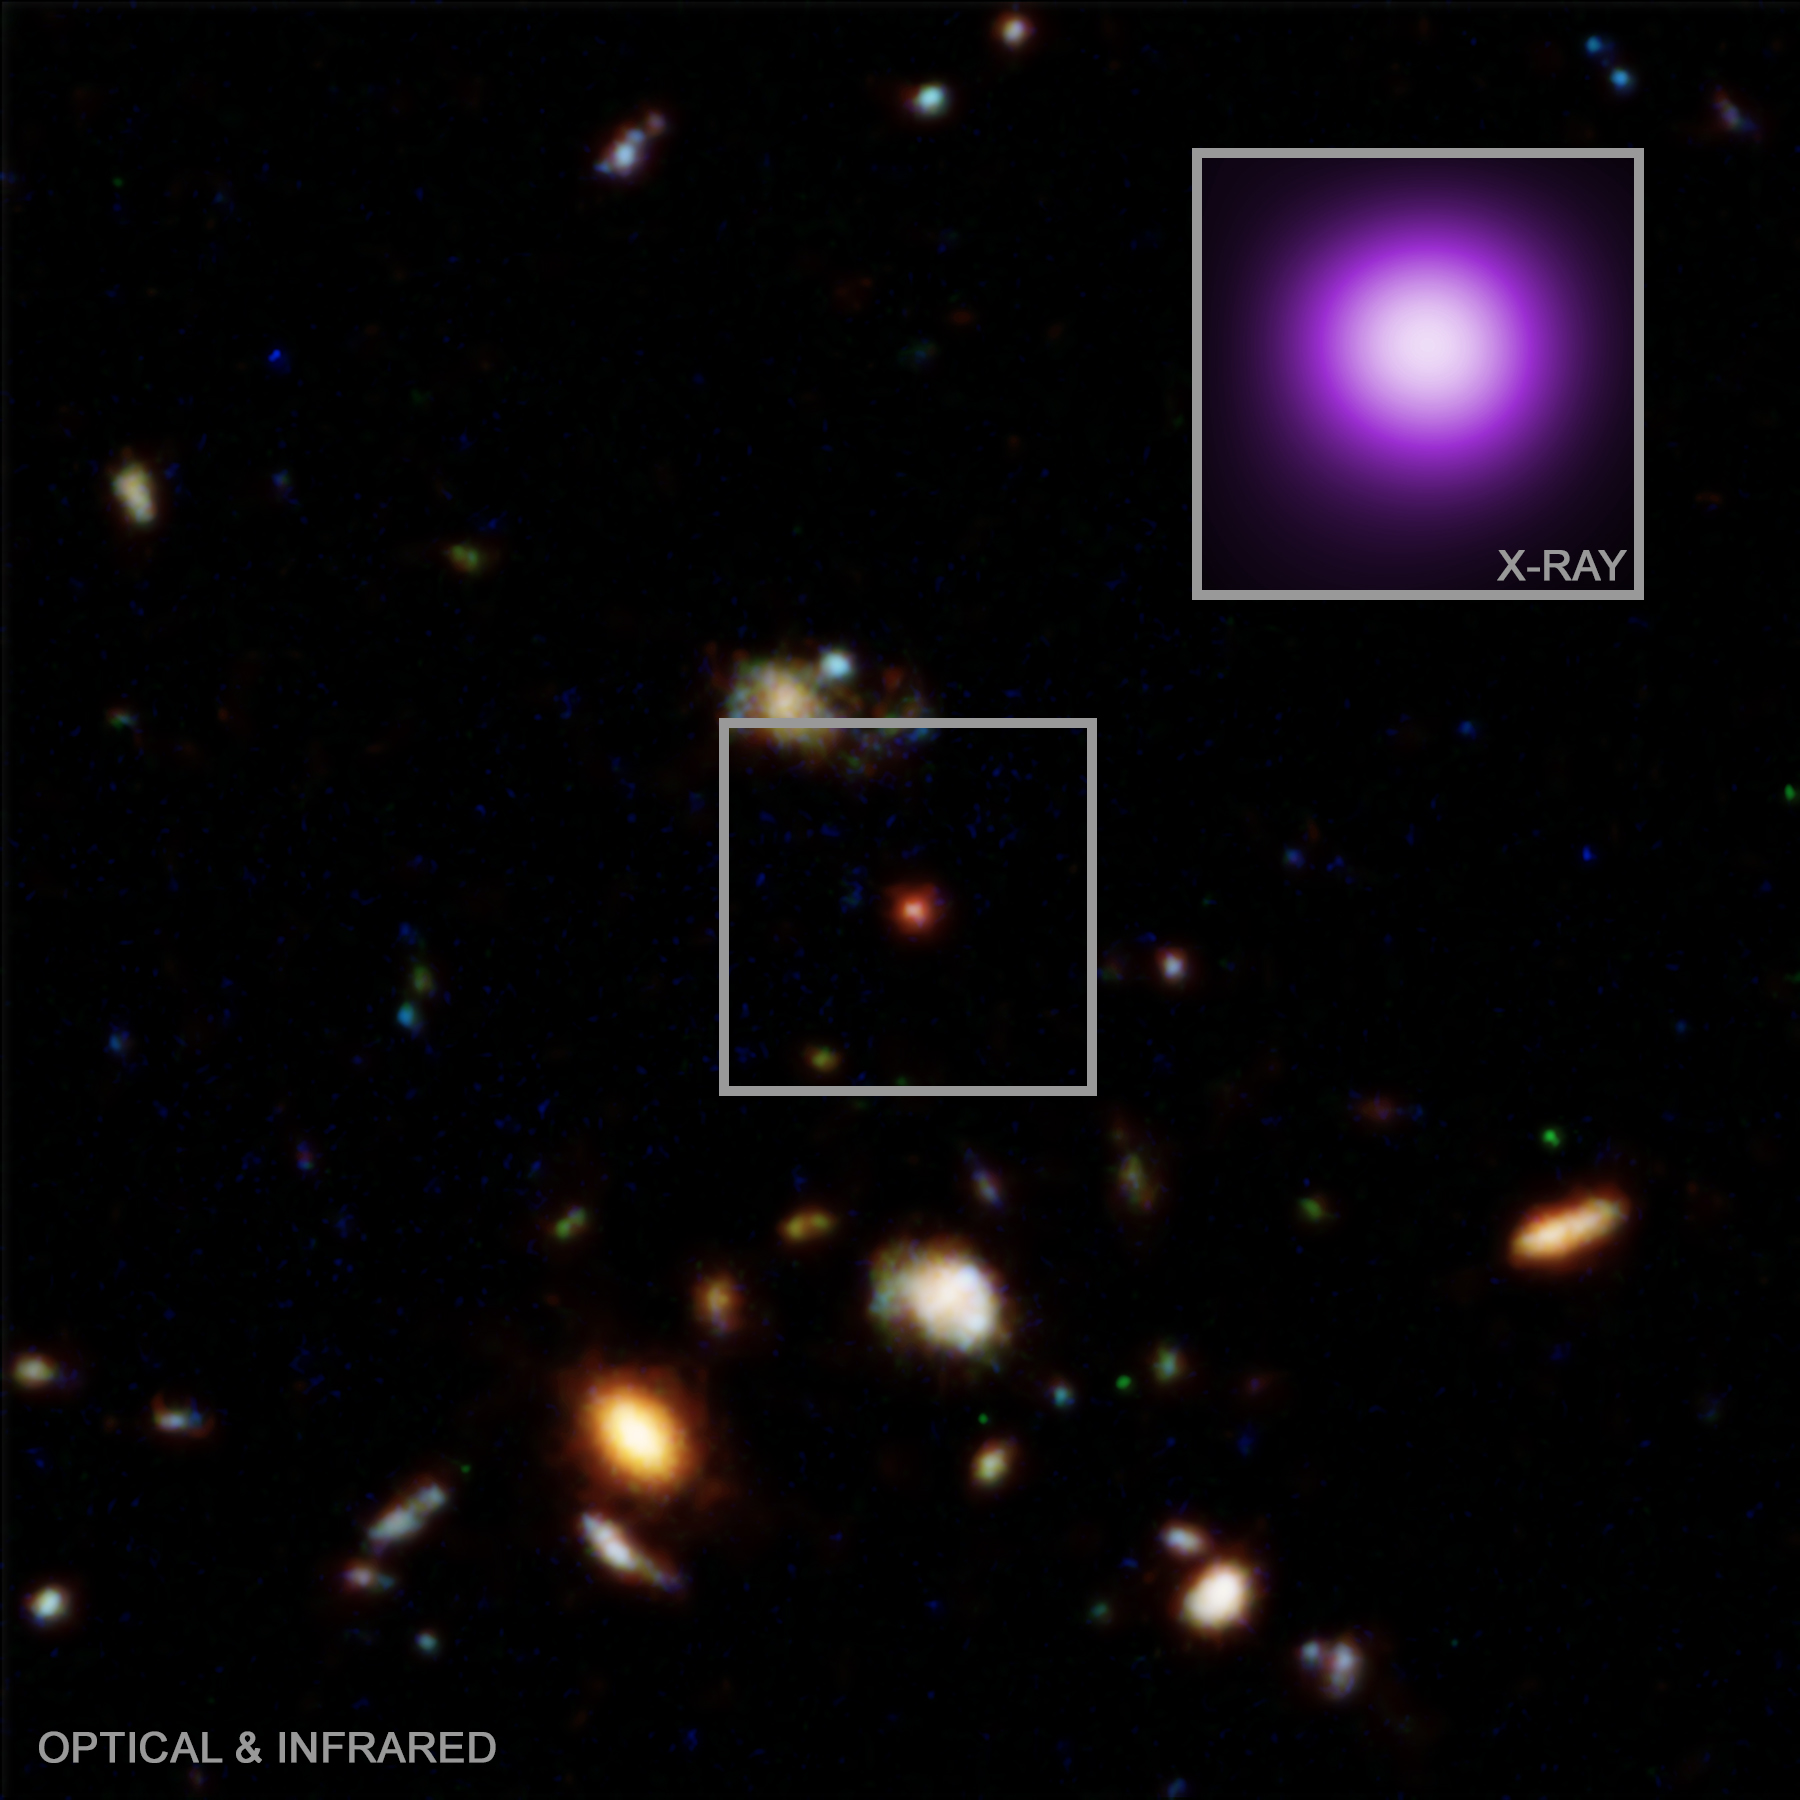
These images of a special object, dubbed the “X-ray dot,” represent a discovery from Chandra that could help explain the nature of a mysterious class of sources in the early Universe. The optical and infrared image from Hubble show the region around the X-ray dot, while the Chandra X-ray image shows the close up. Prior to this discovery, “little red dots” seen by the Webb telescope had not been known to emit X-rays. This one does, which leads researchers to propose that the X-ray dot represents a previously unknown transition phase of growing supermassive black holes. X-ray, Infrared, and Optical images of X-ray Dot 3DHST-AEGIS-12014 Credit: X-ray: NASA/CXC/Max Plank Inst./R. Hviding et al.; Optical/IR; NASA/ESA/STScI/HST; Image Processing: NASA/CXC/SAO/N. Wolk


  • NASA’s Chandra X-ray Observatory has found a “little red dot” (LRD) — a class of red, distant objects — that is giving off X-rays, unlike others observed so far.

  • This suggests that this so-called X-ray dot represents a previously unseen phase of supermassive black holes in the early Universe.

  • In the proposed scenario, gas surrounding the growing black hole becomes patchy as the black hole consumes it.

  • Over time X-rays from material falling onto the black hole are then able to poke through, which Chandra can detect.


This image of a special object, dubbed the “X-ray dot,” represents a discovery from NASA’s Chandra X-ray Observatory that could help explain the nature of a mysterious class of sources in the early Universe as described in our latest press release. Officially known as 3DHST-AEGIS-12014, the X-ray dot is located about 11.8 billion light-years from Earth and may provide a crucial bridge between young black holes embedded in dense gas and typical growing supermassive black holes.

Shortly after NASA’s James Webb Space Telescope started its science observations, scientists reported a new class of unexplained objects. Astronomers found sources that were relatively small and red and located about 12 billion light-years from Earth or farther. (One reason for this redness is their great distances, causing their light to be shifted toward the part of the infrared spectrum with the longest wavelengths, which results in red colors in Webb images.) These became known as “little red dots” (LRDs), and since then astronomers have been trying to determine what exactly these LRDs are.

Recently, a team of researchers found one special object that could help, the X-ray dot depicted in this graphic. An optical and infrared composite image is centered on the position of the X-ray dot and shows its key features as an LRD – small and red. Optical light from NASA’s Hubble Space Telescope is colored blue and green and infrared light from Hubble is colored orange and red. The Chandra X-ray image of the X-ray dot (purple) is in the inset, showing it is bright in X-rays.

The X-ray dot was discovered when comparing new data from Webb with a deep survey previously performed by Chandra. Up until then, all the other LRDs didn’t appear to emit X-rays. This was perplexing because if LRDs were early black holes, as many suspected they were, then they should commonly produce bright X-rays.

Therefore, it was significant to find an LRD that does. The researchers suggest that the X-ray dot could represent a transition phase from an LRD to a typical growing supermassive black hole. As the black hole in an LRD consumes gas surrounding it, patchy holes in the clouds of gas appear. This allows X-rays from material falling onto the black hole to poke through, which are observed by Chandra. Eventually all the gas is consumed, and the “black hole star” ceases to exist. A snapshot of this scenario is depicted in the artist’s illustration below.

The artist’s impression of the X-ray dot shows the research team’s understanding of this new object: a growing supermassive black hole at the center of a patchy sphere of gas.

Artist's Illustration of a Close-Up View of X-ray Dot, 3DHST-AEGIS-12014.
Credit: NASA/CXC/SAO/M. Weiss; adapted by K. Arcand & J. Major

There are also hints in the Chandra data of the X-ray dot that there are variations in X-ray brightness, which supports the idea that the black hole is partly obscured. As the cloud of gas rotates, patches of denser and less dense gas can move across the black hole, causing changes in X-ray brightness.

An alternate idea for the X-ray dot is that it is a more common type of growing supermassive black hole but is veiled in an exotic type of dust that astronomers have not seen before. Future observations are planned that should be able to shed light on the truth.

A paper describing these results has been published in The Astrophysical Journal with the lead author of Raphael Hviding (Max Planck Institute for Astronomy in Germany). A full list of authors can be found in the paper available at https://arxiv.org/abs/2601.09778

NASA's Marshall Space Flight Center in Huntsville, Alabama, manages the Chandra program. The Smithsonian Astrophysical Observatory's Chandra X-ray Center controls science operations from Cambridge, Massachusetts, and flight operations from Burlington, Massachusetts.


Visual Description:

Today's release features a composite image with an X-ray insert, and an artist's illustration of a little dot located 11.8 billion light-years from Earth.

Shortly after NASA's James Webb Space Telescope started its observations, reports of a new class of curious objects emerged. Astronomers discovered small red specks more than about 12 billion light-years from Earth. These mysterious objects were given the accurate and descriptive name "little red dots," or LRDs.

One such dot sits at the heart of the primary image of this release. The composite optical and infrared image features a smattering of distant galaxies and other cosmic objects and phenomena in a variety of colors, set against the blackness of space. At the center of the square image is a small, somewhat pixelated, little red dot, outlined in a white box for clarity.

This curious, but inconspicuous, little dot is enlarged in an X-ray insert at our upper right, because it does something no other LRD has been found to do; it emits X-rays! In the insert, the dot appears as a much larger white sphere in the Chandra image, ringed with a neon purple glow. This exciting discovery has earned this little dot the nickname the "X-ray dot."

The X-ray dot is further enlarged in an artist's illustration. Many scientists think LRDs are supermassive black holes embedded in clouds of dense gas. Here, the dot is a round, patchy cloud of brilliant red gas. At its core is a relatively tiny black sphere, the black hole, floating in a swirling pool of pale purple mist. Research suggests that the X-ray dot represents a transition phase from an LRD to a typical growing supermassive black hole. As the black hole star consumes its surrounding gas, patchy holes appear in the cloud. This allows X-rays to poke through, which are then observed by Chandra.


Fast Facts for 3DHST-AEGIS-12014

Credit: X-ray: NASA/CXC/Max Plank Inst./R. Hviding et al.; Optical/IR; NASA/ESA/STScI/HST;Image Processing: NASA/CXC/SAO/N. Wolk
Release Date: April 28, 2026
Scale: Image is about 20 arcsec (500,000 light-years) across.

Category: Quasars & Active Galaxies, Black Holes
Coordinates (J2000): RA 14h 20m 47.5s | Dec +53° 02´ 32.83"
Constellation: Ursa Major
Observation Dates: 29 Observations from Mar 2005 to Jun 2008
Observation Time: 214 hours 42 minutes (8 days 22 hours 42 minutes)
Obs. ID: 5845,5846, 6214, 6215, 9450-9453, 9720-9726, 9793-9797, 9842-9844, 9863, 9866, 9870, 9873, 9875, 9876
Instrument:
ACIS
References: Hviding, R.E., et al., 2026, ApJL, 1000, L18.
Color Code: X-ray: purple; Optical/IR: red, orange, green, and blue
Distance Estimate: About 11.8 billion light-years from Earth (z~3.28)