Thursday, April 10, 2014

G352.7-0.1: Supernova Cleans Up its Surroundings

Supernova Remnant -  G352.7-0.1 
Credit X-ray: NASA/CXC/Morehead State Univ/T.Pannuti et al.; 
Optical: DSS; Infrared: NASA/JPL-Caltech; 
Radio: NRAO/VLA/Argentinian Institute of Radioastronomy/G.Dubner


animation

Supernovas are the spectacular ends to the lives of many massive stars. These explosions, which occur on average twice a century in the Milky Way, can produce enormous amounts of energy and be as bright as an entire galaxy. These events are also important because the remains of the shattered star are hurled into space. As this debris field - called a supernova remnant - expands, it carries the material it encounters along with it.
Astronomers have identified a supernova remnant that has several unusual properties. First, they found that this supernova remnant - known as G352.7-0.1 (or, G352 for short) - has swept up a remarkable amount of material, equivalent to about 45 times the mass of the Sun.

Another atypical trait of G352 is that it has a very different shape in radio data compared to that in X-rays. Most of the radio emission is shaped like an ellipse, contrasting with the X-ray emission that fills in the center of the radio ellipse. This is seen in a new composite image of G352 that contains X-rays from NASA's

 
Chandra X-ray Observatory in blue and radio data from the National Science Foundation's Karl G. Jansky Very Large Array in pink. These data have also been combined with infrared data from the Spitzer Space Telescope in orange, and optical data from the Digitized Sky Survey in white. (The infrared emission to the upper left and lower right are not directly related to the supernova remnant.)

A recent study suggests that, surprisingly, the X-ray emission in G352 is dominated by the hotter (about 30 million degrees Celsius) debris from the explosion, rather than cooler (about 2 million degrees) emission from surrounding material that has been swept up by the expanding shock wave. This is curious because astronomers estimate that G352 exploded about 2,200 years ago, and supernova remnants of this age usually produce X-rays that are dominated by swept-up material. Scientists are still trying to come up with an explanation for this behavior.

Although it does not produce a lot of X-ray emission, the amount of material - the aforementioned 45 times the Sun's mass - swept up by G352 is remarkably high for a supernova remnant located in our Galaxy. This may indicate that a special type of evolution has occurred, in which the massive star that exploded to create G352 interacted with an extraordinary amount of dense surrounding material.

Astronomers also conducted a search for a neutron star that may have been produced by the supernova explosion. They did not find any hints of a neutron star in G352, another astronomical puzzle involved with this system. One possibility is simply that the neutron star is too faint to be detected or that the supernova created a black hole instead.

G352 is found about 24,000 light years from Earth in the Milky Way galaxy. A paper describing these enigmatic results was published in the February 20th, 2014 issue of The Astrophysical Journal, and is available online. The first author of this paper is Thomas Pannuti from Morehead State University in Morehead, Kentucky, with co-authors Oleg Kargaltsev (George Washington University), Jared Napier (Morehead State), and Derek Brehm (George Washington).

Fast Facts for G352.7-0.1: 

Category: Supernovas & Supernova Remnants
Coordinates (J2000): RA 17h 27m 41.00s | Dec -35° 06' 45.00" 
Constellation: Scorpius
Observation Date: 06 Oct 2004 
Observation Time: 12 hours 23 min 
Obs. ID: 4652 
Instrument: ACIS
References: Pannuti, T. et al. 2014, ApJ 782, 102; arXiv:1401.6603
Color Code: X-ray (Blue); Optical (Grayscale); Infrared (Orange); Radio (Pink) 
Distance Estimate: 24,000 light years


Cosmology and the Spatial Distribution of Galaxies

Sound waves that propagate in the early universe, like spreading ripples in a pond, imprint a characteristic scale on cosmic microwave background fluctuations. These fluctuations have evolved today into the clustering of galaxies. The concept is illustrated here. SDSS III, BOSS 

Perhaps the most astonishing and revolutionary discovery in cosmology was that galaxies are moving away from us. Hubble's 1929 paper provides the underpinning of the big bang picture of creation in which the universe is expanding, and has been for 13.8 billion years. Astronomers since then have been steadily working to refine this general picture, and in 1998, two teams (one led by CfA scientists) further astonished the world with their results showing that the universe would expand forever -- and not only that: it is accelerating outward. They used supernovae to probe the distant cosmos. These discoveries have led to more sophisticated questions, with a primary task today being to understand in detail the expansion history of the universe, that is, how the rate of expansion of the universe evolved from the time of the big bang to the way it is today. The answers to this question directly address the properties of the acceleration mechanism, the nature of dark matter, the evolution of galaxies in early times, and more.

Precision measurements of the cosmic distance scale are crucial for probing this behavior, and one particularly powerful method uses what are called baryon acoustic oscillations (BAO). Baryons refer to ordinary matter, and acoustic oscillations are sound waves. Sound waves caused by density fluctuations were bouncing through the cosmos during its first 400,000 years. Then, once ionized atoms became neutral, radiation no longer interacted strongly with matter and the cosmic microwave background was released. The intensity maps of the background radiation contain a record of these sound waves – the BAO. Astronomers calculate that at the time the cosmic background was produced, sound waves (traveling at the speed of sound) could have spread across a distance of about 500 million light-years, leaving in their wake a coherent record in the matter distribution that eventually condensed into galaxies and clusters of galaxies. Because the scale of this acoustic distortion is so large, many times the size of galaxy clusters, the BAO signature was only modestly altered subsequently as the universe evolved; simulations and theory suggest deviations are below 1%. The robustness of the scale of this distinctive clustering signature allows it to be used as a standard ruler to measure the cosmic distance scale, and indeed the imprint of the BAOs has been detected in a variety of observations of the structure of the nearby universe.

CfA astronomers Daniel Eisenstein and Cameron McBride were among a large team of scientists probing BAOs by using the clustering of galaxies as seen at a time when the universe was about 8.2 billion years old. They examined 264,283 galaxies of this general epoch observed by the Sloan Digital Sky Survey, and measured from their spatial distribution the signature of the acoustic waves left behind to a precision of better than 10%. Their conclusions about the big bang are consistent overall with the picture of cosmic evolution that has emerged from many other lines of evidence (but add some tantalizing hints of mystery: their measurement of the current rate of expansion as 67.5 +- 1.7 km/second/megaparsec is actually a tad smaller than the currently favored value). The amazing power of the technique is that it gives a snapshot of the universe at this era, and that it relies on completely different data from those used by other studies that rely on supernova or cosmic background radiation.

Reference(s): 
"The Clustering of Galaxies in the SDSS-III Baryon Oscillation Spectroscopic Survey: Measuring DA and H at z = 0.57 from the Baryon Acoustic Peak in the Data Release 9 Spectroscopic Galaxy Sample," Lauren Anderson et al., MNRAS 439, 83, 2014.


Wednesday, April 09, 2014

Chance Meeting Creates Celestial Diamond Ring

The planetary nebula Abell 33 captured using ESO's Very Large Telescope
 
The planetary nebula Abell 33 in the constellation of Hydra
 
Wide-field view of the sky around Abell 33
 

**********************

Videos

Zooming in on the planetary nebula Abell 33

Panning across the planetary nebula Abell 33


Astronomers using ESO’s Very Large Telescope in Chile have captured this eye-catching image of planetary nebula PN A66 33 — usually known as Abell 33. Created when an aging star blew off its outer layers, this beautiful blue bubble is, by chance, aligned with a foreground star, and bears an uncanny resemblance to a diamond engagement ring. This cosmic gem is unusually symmetric, appearing to be almost circular on the sky.

Most stars with masses similar to that of our Sun will end their lives as white dwarfs — small, very dense, and hot bodies that slowly cool down over billions of years. On the way to this final phase of their lives the stars throw their atmospheres out into the space and create planetary nebulae, colourful glowing clouds of gas surrounding the small, bright stellar relics.

This image, captured by ESO’s Very Large Telescope (VLT), shows the remarkably round planetary nebula Abell 33, located roughly 2500 light-years from Earth. Being perfectly round is uncommon for these objects — usually something disturbs the symmetry and causes the planetary nebula to display irregular shapes [1].

The strikingly bright star located along the rim of the nebula creates a beautiful illusion in this VLT image. This is just a chance alignment — the star, named HD 83535, lies in the foreground of the nebula, between Earth and Abell 33, in just the right place to make this view even more beautiful. Together, HD 83535 and Abell 33 create a sparkling diamond ring.

The remnant of Abell 33’s progenitor star, on its way to becoming a white dwarf, can be seen just slightly off-centre inside the nebula, visible as a tiny white pearl. It is still bright — more luminous than our own Sun — and emits enough ultraviolet radiation to make the bubble of expelled atmosphere glow [2].

Abell 33 is just one of the 86 objects included in astronomer George Abell's 1966 Abell Catalogue of Planetary Nebulae. Abell also scoured the skies for galaxy clusters, compiling the Abell Catalogue of over 4000 of these clusters in both the northern and southern hemispheres of the sky.

This image uses data from the FOcal Reducer and low dispersion Spectrograph (FORS) instrument attached to the VLT, which were acquired as part of the ESO Cosmic Gems programme [3].

Notes

[1] For example, the way the star spins, or if the central star is one component of a double or multiple star system.

[2] In this very sharp image the central star appears to be double. Whether this is a real association or just a chance alignment is not known.

[3] The ESO Cosmic Gems programme is an outreach initiative to produce images of interesting, intriguing or visually attractive objects using ESO telescopes, for the purposes of education and public outreach. The programme makes use of telescope time that cannot be used for science observations. All data collected may also be suitable for scientific purposes, and are made available to astronomers through ESO’s science archive.

More information

ESO is the foremost intergovernmental astronomy organisation in Europe and the world’s most productive ground-based astronomical observatory by far. It is supported by 15 countries: Austria, Belgium, Brazil, the Czech Republic, Denmark, France, Finland, Germany, Italy, the Netherlands, Portugal, Spain, Sweden, Switzerland and the United Kingdom. ESO carries out an ambitious programme focused on the design, construction and operation of powerful ground-based observing facilities enabling astronomers to make important scientific discoveries. ESO also plays a leading role in promoting and organising cooperation in astronomical research. ESO operates three unique world-class observing sites in Chile: La Silla, Paranal and Chajnantor. At Paranal, ESO operates the Very Large Telescope, the world’s most advanced visible-light astronomical observatory and two survey telescopes. VISTA works in the infrared and is the world’s largest survey telescope and the VLT Survey Telescope is the largest telescope designed to exclusively survey the skies in visible light. ESO is the European partner of a revolutionary astronomical telescope ALMA, the largest astronomical project in existence. ESO is currently planning the 39-metre European Extremely Large optical/near-infrared Telescope, the E-ELT, which will become “the world’s biggest eye on the sky”.

Links

Contacts

Richard Hook
ESO Public Information Officer
Garching bei München, Germany
Tel: +49 89 3200 6655
Cell: +49 151 1537 3591
Email:
rhook@eso.org


Source: ESO


Tuesday, April 08, 2014

BOSS Quasars Track the Expanding Universe – the Most Precise Measurement Yet

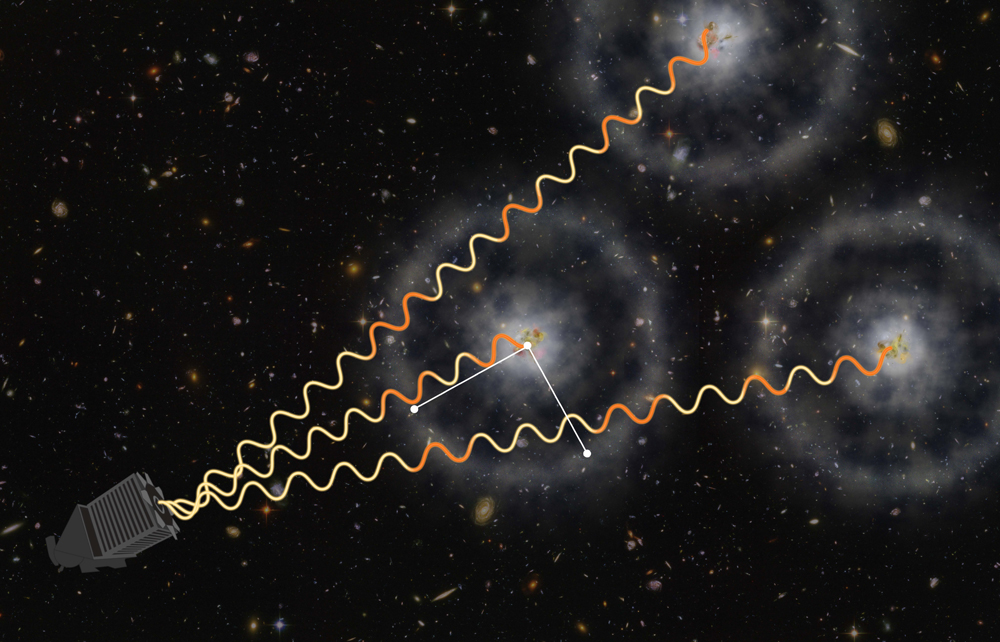
An artist's conception of how BOSS uses quasars to measure the distant universe. Light from distant quasars is partly absorbed by intervening gas, which is imprinted with a subtle ring-like pattern of known physical scale. Astronomers have now measured this scale with an accuracy of two percent, precisely measuring how fast the universe was expanding when it was just 3 billion years old. (Illustration by Zosia Rostomian, Lawrence Berkeley National Laboratory, and Andreu Font-Ribera, BOSS Lyman-alpha team, Berkeley Lab.) (Click here for best resolution.)

Berkeley Lab scientists and their colleagues in BOSS study quasars in a new way, yielding a precise determination of expansion


The Baryon Oscillation Spectroscopic Survey (BOSS), the largest component of the third Sloan Digital Sky Survey (SDSS-III), pioneered the use of quasars to map density variations in intergalactic gas at high redshifts, tracing the structure of the young universe. BOSS charts the history of the universe’s expansion in order to illuminate the nature of dark energy, and new measures of large-scale structure have yielded the most precise measurement of expansion since galaxies first formed.

The latest quasar results combine two separate analytical techniques. A new kind of analysis, led by physicist Andreu Font-Ribera of the U.S. Department of Energy’s Lawrence Berkeley National Laboratory (Berkeley Lab) and his team, was published late last year. Analysis using a tested approach, but with far more data than before, has just been published by Timothée Delubac, of EPFL Switzerland and France’s Centre de Saclay, and his team. The two analyses together establish the expansion rate at 68 kilometers per second per million light years at redshift 2.34, with an unprecedented accuracy of 2.2 percent.

“This means if we look back to the universe when it was less than a quarter of its present age, we’d see that a pair of galaxies separated by a million light years would be drifting apart at a velocity of 68 kilometers a second as the universe expands,” says Font-Ribera, a postdoctoral fellow in Berkeley Lab’s Physics Division. “The uncertainty is plus or minus only a kilometer and a half per second.” Font-Ribera presented the findings at the April 2014 meeting of the American Physical Society in Savannah, GA.

BOSS employs both galaxies and distant quasars to measure baryon acoustic oscillations (BAO), a signature imprint in the way matter is distributed, resulting from conditions in the early universe. While also present in the distribution of invisible dark matter, the imprint is evident in the distribution of ordinary matter, including galaxies, quasars, and intergalactic hydrogen.

“Three years ago BOSS used 14,000 quasars to demonstrate we could make the biggest 3D maps of the universe,” says Berkeley Lab’s David Schlegel, principal investigator of BOSS. “Two years ago, with 48,000 quasars, we first detected baryon acoustic oscillations in these maps. Now, with more than 150,000 quasars, we’ve made extremely precise measures of BAO.”

The BAO imprint corresponds to an excess of about five percent in the clustering of matter at a separation known as the BAO scale. Recent experiments including BOSS and the Planck satellite study of the cosmic microwave background put the BAO scale, as measured in today’s universe, at very close to 450 million light years – a “standard ruler” for measuring expansion. 

BAO directly descends from pressure waves (sound waves) moving through the early universe, when particles of light and matter were inextricably entangled; 380,000 years after the big bang, the universe had cooled enough for light to go free. The cosmic microwave background radiation preserves a record of the early acoustic density peaks; these were the seeds of the subsequent BAO imprint on the distribution of matter.

Quasars extend the standard ruler

Previous work from BOSS used the spectra of over a million galaxies to measure the BAO scale with a remarkable one percent accuracy. But beyond redshift 0.7 (roughly six billion light years distant), galaxies become fainter and more difficult to see. For much higher redshifts like those in the present studies, averaging 2.34, BOSS pioneered the “Lyman-alpha forest” method of using spectra from distant quasars to calculate the density of intergalactic hydrogen.

As the light from a distant quasar passes through intervening hydrogen gas, patches of greater density absorb more light. The absorption lines of neutral hydrogen in the spectrum (Lyman-alpha lines) pinpoint each dense patch by how much they are redshifted. There are so many lines in such a spectrum, in fact, that it resembles a forest – the Lyman-alpha forest.

With enough good quasar spectra, close enough together, the position of the gas clouds can be mapped in three dimensions – both along the line of sight for each quasar and transversely among dense patches revealed by other quasar spectra. From these maps the BAO signal is extracted.

Although introduced by BOSS only a few years ago, this method of using Lyman-alpha forest data, called autocorrelation, by now seems almost traditional. The just-published autocorrelation results by Delubac and his colleagues employ the spectra of almost 140,000 carefully selected BOSS quasars.

Font-Ribera and his colleagues determine BAO using even more BOSS quasars in a different way. Quasars are young galaxies powered by massive black holes, extremely bright, extremely distant, and thus highly redshifted. Instead of comparing spectra to other spectra, Font-Ribera’s team correlated quasars themselves to the spectra of other quasars, a method called cross-correlation.

“Quasars are massive galaxies, and we expect them to be in the denser parts of the universe, where the density of the intergalactic gas should also be higher,” says Font-Ribera. “Therefore we expect to find more of the absorbing gas than average when we look near quasars.” The question was whether the correlation would be good enough to see the BAO imprint.

Indeed the BAO imprint in cross-correlation was strong. Delubac and his team combined their autocorrelation results with the cross-correlation results of Font-Ribera and his team, and they converged on narrow constraints for the BAO scale. Autocorrelation and cross-correlation also converged in the precision of their measures of the universe’s expansion rate, called the Hubble parameter. At redshift 2.34, the combined measure was equivalent to 68 plus or minus 1.5 kilometers per second per million light years.

“It’s the most precise measurement of the Hubble parameter at any redshift, even better than the measurement we have from the local universe at redshift zero,” says Font-Ribera. “These results allow us to study the geometry of the universe when it was only a fourth its current age. Combined with other cosmological experiments, we can learn about dark energy and put tight constraints on the curvature of the universe – it’s very flat!”

David Schlegel remarks that when BOSS was first getting underway, the cross-correlation technique had been suggested, but “some of us were afraid it wouldn’t work. We were wrong. Our precision measures are even better than we optimistically hoped for.”

*****

“Quasar-Lyman α Forest Cross-Correlation from BOSS DR11: Baryon Acoustic Oscillations,” by  Andreu Font-Ribera, David Kirkby, Nicolás Busca, Jordi Miralda-Escudé, Nicholas P. Ross, Anže Slosar, Éric  Aubourg, Stephen Bailey, Vaishali Bhardwaj, Julian Bautista, Florian Beutler, Dmitry Bizyaev, Michael Blomqvist, Howard  Brewington, Jon Brinkmann, Joel R. Brownstein, Bill Carithers, Kyle S. Dawson, Timothée Delubac, Garrett Ebelke, Daniel J. Eisenstein, Jian Ge, Karen Kinemuchi, Khee-Gan Lee, Viktor Malanushenko, Elena Malanushenko, Moses Marchante, Daniel Margala, Demitri Muna, Adam D. Myers, Pasquier Noterdaeme, Daniel Oravetz, Nathalie Palanque-Delabrouille, Isabelle Pâris, Patrick Petitjean, Matthew M. Pieri, Graziano Rossi, Donald P. Schneider, Audrey Simmons, Matteo Viel, Christophe Yeche, and Donald G. York, has been submitted to the Journal of Cosmology and Astropartical Physics and is now available online at arxiv.org/abs/1311.1767.

“Baryon Acoustic Oscillations in the Lyα forest of BOSS DR11 quasars,” by Timothée Delubac, Julian E. Bautista, Nicolás G. Busca, James Rich, David Kirkby, Stephen Bailey, Andreu Font-Ribera, Anže Slosar, Khee-Gan Lee, Matthew M. Pieri, Jean-Christophe Hamilton, Michael Blomqvist, William Carithers, Daniel J. Eisenstein, J.-M. Le Go, Daniel Margala, Jordi Miralda-Escudé, Adam Myers, Pasquier Noterdaeme, Nathalie Palanque-Delabrouille, Isabelle Pâris, Patrick Petitjean, Nicholas P. Ross, Graziano Rossi, David J. Schlegel, David H. Weinberg, and Christophe Yèche, has been submitted to Astronomy & Astrophysics and is available on arXiv.org as of late  Monday, April 7, and before then at www.sdss3.org/science/lyaauto.pdf.

The SDSS-III version of this release may be found at www.sdss3.org/press/precise.php.

Funding for SDSS-III has been provided by the Alfred P. Sloan Foundation, the Participating Institutions, the National Science Foundation, and the U.S. Department of Energy’s Office of Science. This research used resources of the National Energy Research Scientific Computing Center (NERSC), which is supported by the Office of Science. Visit SDSS-III at www.sdss3.org/.

SDSS-III is managed by the Astrophysical Research Consortium for the Participating Institutions of the SDSS-III Collaboration including the University of Arizona, the Brazilian Participation Group, Brookhaven National Laboratory, University of Cambridge, Carnegie Mellon University, University of Florida, the French Participation Group, the German Participation Group, Harvard University, the Instituto de Astrofisica de Canarias, the Michigan State/Notre Dame/JINA Participation Group, Johns Hopkins University, Lawrence Berkeley National Laboratory, Max Planck Institute for Astrophysics, Max Planck Institute for Extraterrestrial Physics, New Mexico State University, New York University, Ohio State University, Pennsylvania State University, University of Portsmouth, Princeton University, the Spanish Participation Group, University of Tokyo, University of Utah, Vanderbilt University, University of Virginia, University of Washington, and Yale University.

Lawrence Berkeley National Laboratory addresses the world’s most urgent scientific challenges by advancing sustainable energy, protecting human health, creating new materials, and revealing the origin and fate of the universe. Founded in 1931, Berkeley Lab’s scientific expertise has been recognized with 13 Nobel prizes. The University of California manages Berkeley Lab for the U.S. Department of Energy’s Office of Science. For more, visit www.lbl.gov.

The National Energy Research Scientific Computing Center (NERSC) provides high-end scientific production computing resources for DOE’s Office of Science researchers, supporting work in a wide range of disciplines that span the DOE missions. For more information visit www.nersc.gov/.

DOE’s Office of Science is the single largest supporter of basic research in the physical sciences in the United States and is working to address some of the most pressing challenges of our time. For more information, please visit the Office of Science website at science.energy.gov/.


Monday, April 07, 2014

Fermi Data Tantalize With New Clues To Dark Matter

At left is a map of gamma rays with energies between 1 and 3.16 GeV detected in the galactic center by the Fermi Space Telescope; red indicates the greatest number. Prominent pulsars are labeled. Removing all known gamma-ray sources (right) reveals excess emission that may arise from dark matter annihilations. T. Linden, Univ. of Chicago. High Resolution (jpg) - Low Resolution (jpg)

At left is a map of gamma rays with energies between 1 and 3.16 GeV detected in the galactic center by the Fermi Space Telescope; red indicates the greatest number. Removing all known gamma-ray sources (right) reveals excess emission that may arise from dark matter annihilations. T. Linden, Univ. of Chicago High. High Resolution (jpg) - Low Resolution (jpg)

"The new maps allow us to analyze the excess and test whether more conventional explanations, such as the presence of undiscovered pulsars or cosmic-ray collisions on gas clouds, can account for it," said Dan Hooper, an astrophysicist at Fermilab and a co-author of the study. "The signal we find cannot be explained by currently proposed alternatives and is in close agreement with the predictions of very simple dark matter models."

"We're working hard to come up with ways to confirm whether or not this signal is indeed from dark matter," said co-author Douglas Finkbeiner, a Harvard professor of astronomy and physics at CfA.

The center of the Milky Way teems with gamma-ray sources, from interacting binary systems and isolated pulsars to supernova remnants and particles colliding with interstellar gas. It's also where astronomers expect to find the Galaxy's highest density of dark matter, which only affects normal matter and radiation through its gravity. Large amounts of dark matter attract normal matter, forming a foundation upon which visible structures, like galaxies, are built.

No one knows the true nature of dark matter, but WIMPs, or Weakly Interacting Massive Particles, represent a leading class of candidates. Theorists have envisioned a wide range of WIMP types, some of which may either mutually annihilate or produce an intermediate, quickly decaying particle when they collide. Both of these pathways end with the production of gamma rays -- the most energetic form of light -- at energies within the detection range of Fermi's Large Area Telescope (LAT).

When astronomers carefully subtract all known gamma-ray sources from LAT observations of the Galactic center, a patch of leftover emission remains. This excess appears most prominent at energies between 1 and 3 billion electron volts (GeV) -- roughly a billion times greater than that of visible light -- and extends outward at least 5,000 light-years from the Galactic center.

Hooper and his colleagues conclude that annihilations of dark matter particles with a mass between 31 and 40 GeV provide a remarkable fit for the excess based on its gamma-ray spectrum, its symmetry around the galactic center, and its overall brightness. Writing in a paper submitted to the journal Physical Review D, the researchers say that these features are difficult to reconcile with other explanations proposed so far, although they note that plausible alternatives not requiring dark matter may yet materialize.

"Dark matter in this mass range can be probed by direct detection and by the Large Hadron Collider (LHC), so if this is dark matter, we're already learning about its interactions from the lack of detection so far," said co-author Tracy Slatyer, a theoretical physicist at MIT. "This is a very exciting signal, and while the case is not yet closed, in the future we might well look back and say this was where we saw dark matter annihilation for the first time."

The researchers caution that it will take multiple sightings -- in other astronomical objects, the LHC or in some of the direct-detection experiments now being conducted around the world -- to validate their dark matter interpretation.

"Our case is very much a process-of-elimination argument. We made a list, scratched off things that didn't work, and ended up with dark matter," said Finkbeiner.

This release is being issued jointly with the NASA Goddard Space Flight Center.

Headquartered in Cambridge, Mass., the Harvard-Smithsonian Center for Astrophysics (CfA) is a joint collaboration between the Smithsonian Astrophysical Observatory and the Harvard College Observatory. CfA scientists, organized into six research divisions, study the origin, evolution and ultimate fate of the universe.

For more information, contact:

Francis Reddy
NASA/Goddard Space Flight Center
301-286-4453

francis.j.reddy@nasa.gov

David A. Aguilar
Director of Public Affairs
Harvard-Smithsonian Center for Astrophysics
617-495-7462

daguilar@cfa.harvard.edu

Christine Pulliam
Public Affairs Specialist
Harvard-Smithsonian Center for Astrophysics
617-495-7463

cpulliam@cfa.harvard.edu


Friday, April 04, 2014

NASA Space Assets Detect Ocean inside Saturn Moon

Gravity measurements by NASA's Cassini spacecraft and Deep Space Network suggest that Saturn's moon Enceladus, which has jets of water vapor and ice gushing from its south pole, also harbors a large interior ocean beneath an ice shell, as this illustration depicts. Image credit: NASA/JPL-Caltech.  Full image and caption

NASA's Cassini spacecraft and Deep Space Network have uncovered evidence Saturn's moon Enceladus harbors a large underground ocean of liquid water, furthering scientific interest in the moon as a potential home to extraterrestrial microbes.

Researchers theorized the presence of an interior reservoir of water in 2005 when Cassini discovered water vapor and ice spewing from vents near the moon's south pole. The new data provide the first geophysical measurements of the internal structure of Enceladus, consistent with the existence of a hidden ocean inside the moon. Findings from the gravity measurements are in the Friday, April 4 edition of the journal Science.

"The way we deduce gravity variations is a concept in physics called the Doppler Effect, the same principle used with a speed-measuring radar gun," said Sami Asmar of NASA's Jet Propulsion Laboratory in Pasadena, Calif., a coauthor of the paper. "As the spacecraft flies by Enceladus, its velocity is perturbed by an amount that depends on variations in the gravity field that we're trying to measure. We see the change in velocity as a change in radio frequency, received at our ground stations here all the way across the solar system."

The gravity measurements suggest a large, possibly regional, ocean about 6 miles (10 kilometers) deep, beneath an ice shell about 19 to 25 miles (30 to 40 kilometers) thick. The subsurface ocean evidence supports the inclusion of Enceladus among the most likely places in our solar system to host microbial life. Before Cassini reached Saturn in July 2004, no version of that short list included this icy moon, barely 300 miles (500 kilometers) in diameter.

"This then provides one possible story to explain why water is gushing out of these fractures we see at the south pole," said David Stevenson of the California Institute of Technology, Pasadena, one of the paper's co-authors. 

Cassini has flown near Enceladus 19 times. Three flybys, from 2010 to 2012, yielded precise trajectory measurements. The gravitational tug of a planetary body, such as Enceladus, alters a spacecraft's flight path. Variations in the gravity field, such as those caused by mountains on the surface or differences in underground composition, can be detected as changes in the spacecraft's velocity, measured from Earth. 

The technique of analyzing a radio signal between Cassini and the Deep Space Network can detect changes in velocity as small as less than one foot per hour (90 microns per second). With this precision, the flyby data yielded evidence of a zone inside the southern end of the moon with higher density than other portions of the interior. 

The south pole area has a surface depression that causes a dip in the local tug of gravity. However, the magnitude of the dip is less than expected given the size of the depression, leading researchers to conclude the depression's effect is partially offset by a high-density feature in the region, beneath the surface.

"The Cassini gravity measurements show a negative gravity anomaly at the south pole that however is not as large as expected from the deep depression detected by the onboard camera," said the paper's lead author, Luciano Iess of Sapienza University of Rome. "Hence the conclusion that there must be a denser material at depth that compensates the missing mass: very likely liquid water, which is seven percent denser than ice. The magnitude of the anomaly gave us the size of the water reservoir."

There is no certainty the subsurface ocean supplies the water plume spraying out of surface fractures near the south pole of Enceladus, however, scientists reason it is a real possibility. The fractures may lead down to a part of the moon that is tidally heated by the moon's repeated flexing, as it follows an eccentric orbit around Saturn.

Much of the excitement about the Cassini mission's discovery of the Enceladus water plume stems from the possibility that it originates from a wet environment that could be a favorable environment for microbial life. 

"Material from Enceladus' south polar jets contains salty water and organic molecules, the basic chemical ingredients for life," said Linda Spilker, Cassini's project scientist at JPL. "Their discovery expanded our view of the 'habitable zone' within our solar system and in planetary systems of other stars. This new validation that an ocean of water underlies the jets furthers understanding about this intriguing environment." 

The Cassini-Huygens mission is a cooperative project of NASA, the European Space Agency and the Italian Space Agency. JPL manages the mission for NASA's Science Mission Directorate in Washington. 

For more information about Cassini, visit: http://www.nasa.gov/cassini   and  http://saturn.jpl.nasa.gov.


Jane Platt 
Jet Propulsion Laboratory, Pasadena, Calif. 
818-354-0880 
jane.platt@jpl.nasa.gov

Dwayne Brown
Headquarters, Washington
202-358-1726

dwayne.c.brown@nasa.gov

Brian Bell
California Institute of Technology, Pasadena
626-395-5832

bpbell@caltech.edu

A spiral home to exploding stars

Credit:NASA, ESA, and S. Smartt (Queen's University Belfast)
Acknowledgement: Brian Campbell

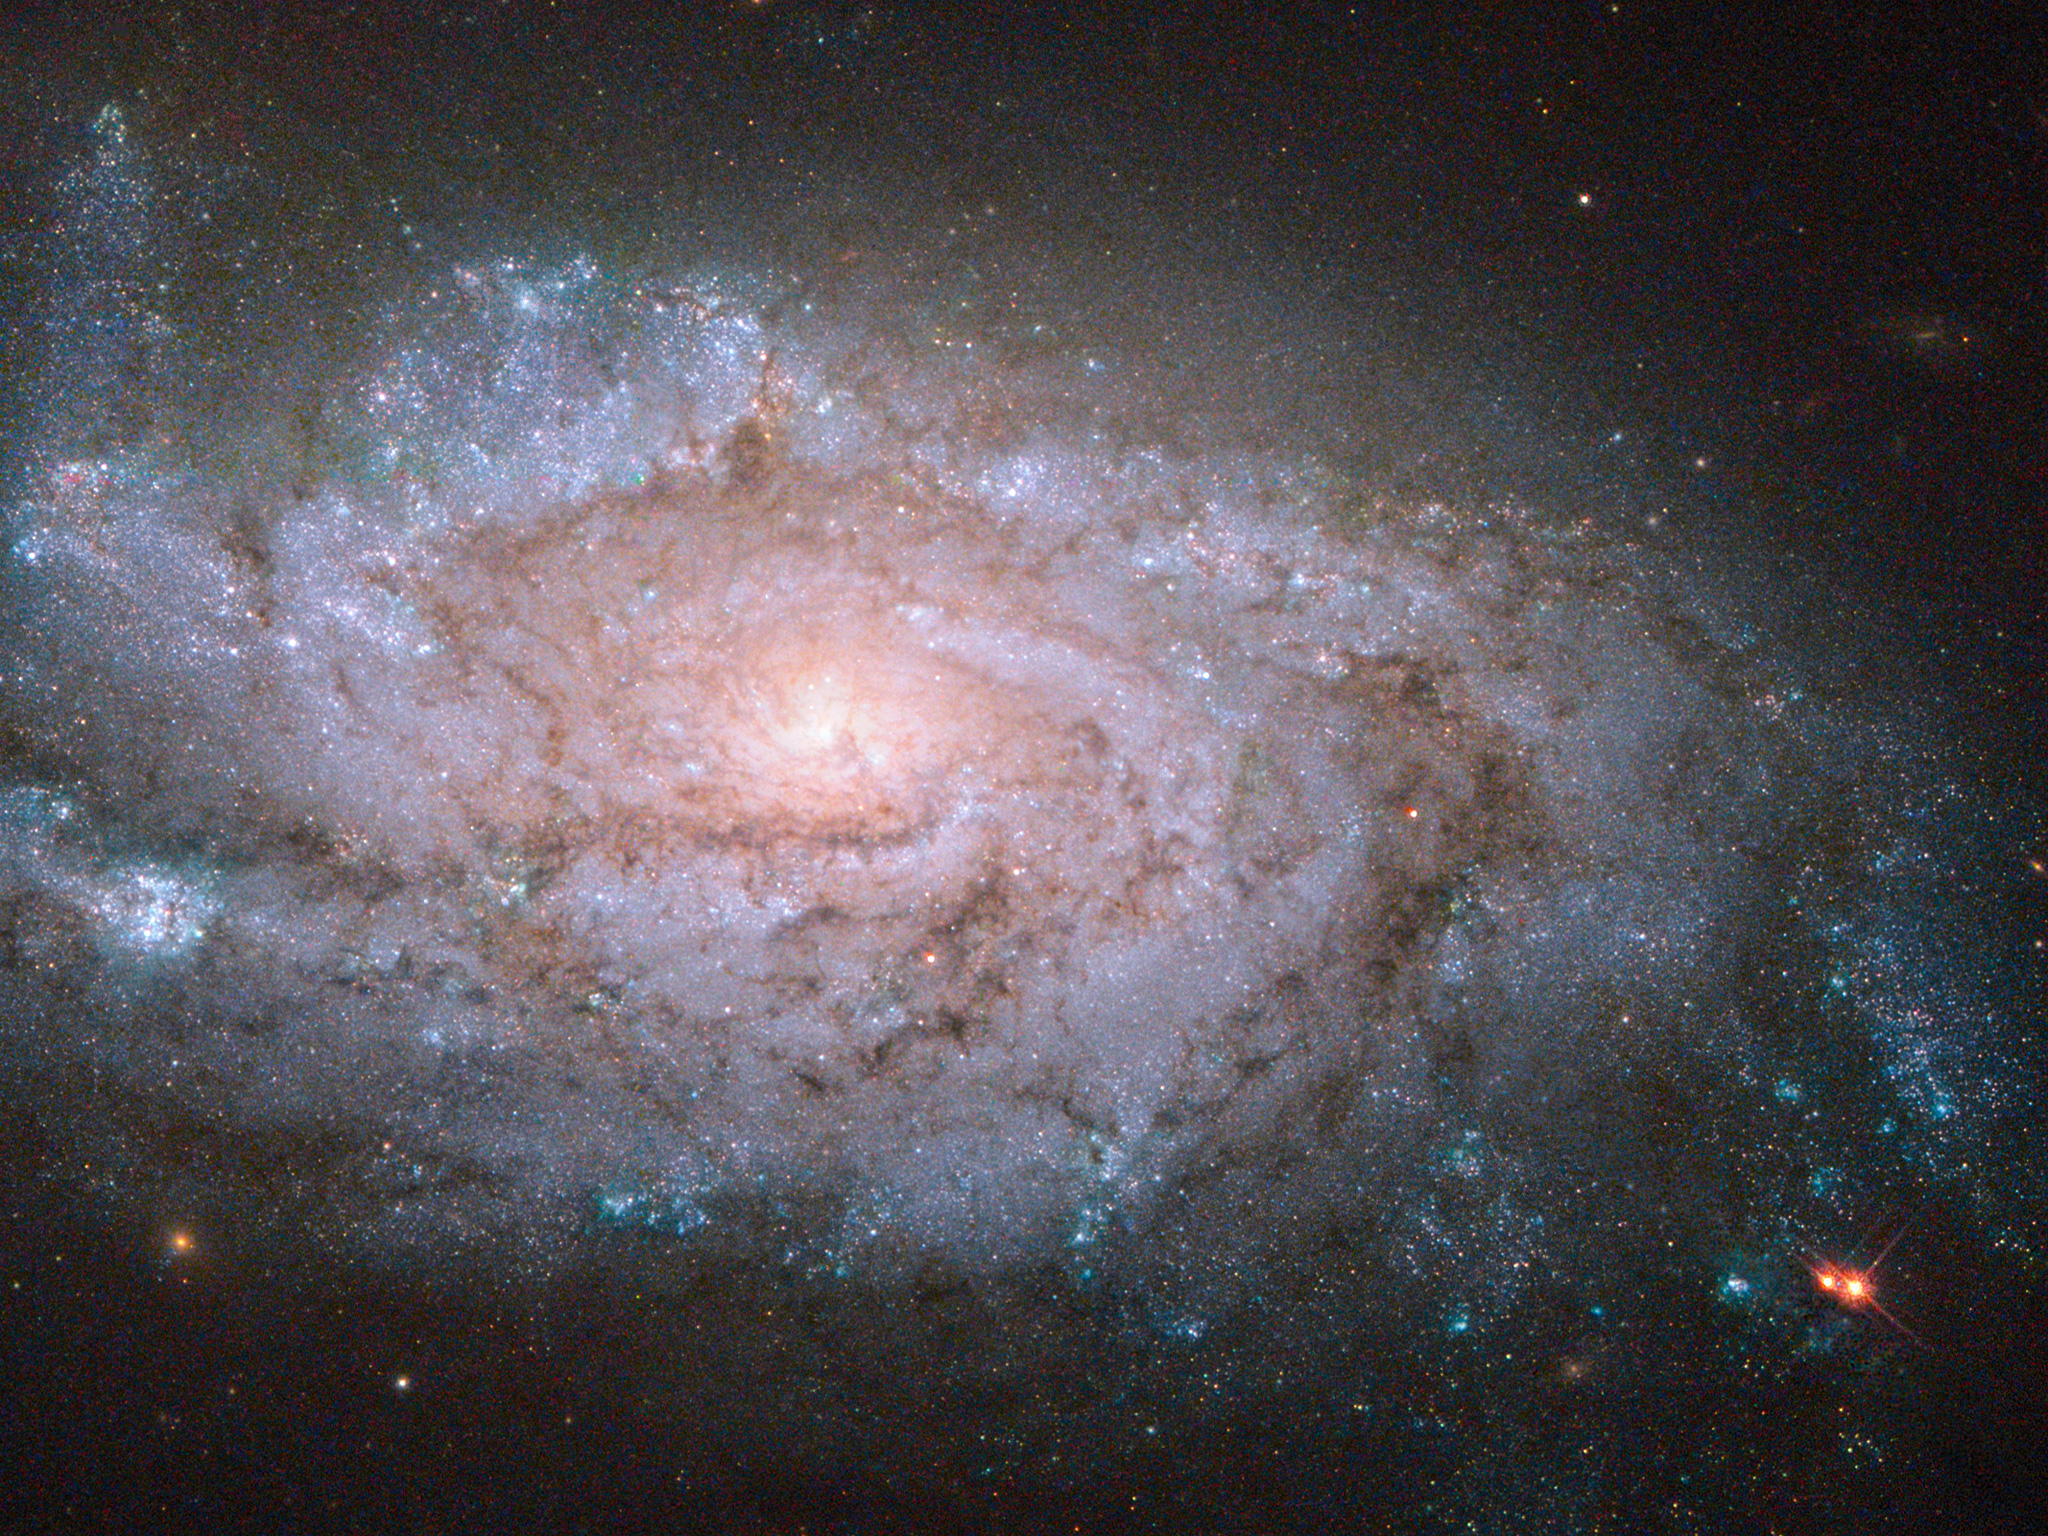
In this new Hubble image, we can see an almost face-on view of the galaxy NGC 1084. At first glance, this galaxy is pretty unoriginal. Like the majority of galaxies that we observe it is a spiral galaxy, and, as with about half of all spirals, it has no bar running through its loosely wound arms. However, although it may seem unremarkable on paper, NGC 1084 is actually a near-perfect example of this type of galaxy — and Hubble has a near-perfect view of it.

NGC 1084 has hosted several violent events known as supernovae — explosions that occur when massive stars, many times more massive than the Sun, approach their twilight years. As the fusion processes in their cores run out of fuel and come to an end, these stellar giants collapse, blowing off their outer layers in a violent explosion. Supernovae can often briefly outshine an entire galaxy, before then fading away over several weeks or months. Although directly observing one of these explosions is hard to do, in galaxies like NGC 1084 astronomers can find and study the remnants left behind.

Astronomers have noted five supernova explosions within NGC 1084 over the past half century. These remnants are named after the year in which they took place — 1963P, 1996an, 1998dl, 2009H, and 2012ec.

The most recent explosion, 2012ec, was detected at the end of NGC 1084’s top right arm in August 2012. It is not visible here as these images were taken in 2001, some eleven years before this supernova exploded.

Astronomers at Queen's University Belfast have managed to use these "before" images to directly identify the star that exploded. It appears to be a red supergiant some 10 to 20 times more massive than the Sun, and quite similar to the well-known star Betelguese in Orion.

A version of this image was entered into the Hubble's Hidden Treasures image processing competition by Flickr user Brian Campbell (Sinickel).


Thursday, April 03, 2014

NASA Hubble Team Finds Monster "El Gordo" Galaxy Cluster Bigger Than Thought

This is a Hubble image of the most massive cluster of galaxies ever seen to exist when the universe was just half its current age of 13.8 billion years. The cluster contains several hundred galaxies.  Image Credit: NASA, ESA, and J. Jee (University of California, Davis)

NASA's Hubble Space Telescope has weighed the largest known galaxy cluster in the distant universe, catalogued as ACT-CL J0102-4915, and found it definitely lives up to its nickname -- El Gordo (Spanish for "the fat one").

By measuring how much the cluster's gravity warps images of galaxies in the distant background, a team of astronomers has calculated the cluster's mass to be as much as 3 million billion times the mass of our sun. Hubble data show the galaxy cluster, which is 9.7 billion light-years away from Earth, is roughly 43 percent more massive than earlier estimates.

The team used Hubble to measure how strongly the mass of the cluster warped space. Hubble's high resolution allowed measurements of so-called "weak lensing," where the cluster's immense gravity subtly distorts space like a funhouse mirror and warps images of background galaxies. The greater the warping, the more mass is locked up in the cluster.

"What I did is basically look at the shapes of the background galaxies that are farther away than the cluster itself," explained lead author James Jee of the University of California at Davis. "It's given us an even stronger probability that this is really an amazing system very early in the universe."

A fraction of this mass is locked up in several hundred galaxies that inhabit the cluster and a larger fraction is in hot gas that fills the entire volume of the cluster. The rest is tied up in dark matter, an invisible form of matter that makes up the bulk of the mass of the universe.

Though equally massive galaxy clusters are found in the nearby part of the universe, such as the Bullet cluster, nothing like this has ever been discovered to exist so far back in time, when the universe was roughly half its current estimated age of 13.8 billion years. The team suspects such monster galaxy clusters are rare in the early universe, based on current cosmological models.

The immense size of El Gordo was first reported in January 2012. Astronomers estimated its mass based on observations made by NASA's Chandra X-ray Observatory, and galaxy velocities measured by the European Southern Observatory's Very Large Telescope array in Paranal, Chile. They were able to put together estimates of the cluster's mass based on the motions of the galaxies moving inside the cluster and the temperatures of the hot gas between those galaxies.

The challenge was that El Gordo looked as if it might have been the result of a titanic collision between a pair of galaxy clusters -- an event researchers describe as two cosmic cannonballs hitting each other.

"We wondered what happens when you catch a cluster in the midst of a major merger and how the merger process influences both the X-ray gas and the motion of the galaxies," explained John Hughes of Rutgers University. "So, the bottom line is because of the complicated merger state, it left some questions about the reliability of the mass estimates we were making."

That is where the Hubble data came in, according to Felipe Menanteau of the University of Illinois at Urbana-Champaign.

"We were in dire need for an independent and more robust mass estimate given how extreme this cluster is and how rare its existence is in the current cosmological model. There was all this kinematic energy that was unaccounted for and could potentially suggest that we were actually underestimating the mass," Menanteau said. 

The expectation of "unaccounted energy" comes from the fact the merger of galaxy clusters is occurring tangentially to the observers' line-of-sight. This means they are potentially missing a good fraction of the kinetic energy of the merger because their spectroscopic measurements only track the radial speeds of the galaxies.

The team's next step with Hubble will be to compile an image of the cluster. Because El Gordo does not fit into Hubble's field of view, the team will capture images of sections of the galaxy cluster and piece them together into a mosaic.

Researchers say it is like observing a giant from the side.

"We can tell it's a pretty big El Gordo, but we don't know what kind of legs he has, so we need to have a larger field of view to get the complete picture of the giant," said Menanteau.

The Hubble Space Telescope is a project of international cooperation between NASA and the European Space Agency. NASA's Goddard Space Flight Center in Greenbelt, Md., manages the telescope. The Space Telescope Science Institute (STScI) in Baltimore conducts Hubble science operations. STScI is operated for NASA by the Association of Universities for Research in Astronomy, Inc., in Washington.

For images and more information about Hubble, visit:  http://www.nasa.gov/hubble


J.D. Harrington
Headquarters, Washington
202-358-5241

j.d.harrington@nasa.gov

Ray Villard
Space Science Telescope Institute, Baltimore, Md.
410-338-4493 / 410-338-4514

villard@stsci.edu


Sakurai’s Object: Stellar Evolution in Real Time

The figure shows an oil painting done by Stephen Mack that represents what the present expanding shell of gas and dust around the star may look like. Mack is a member of the Tohono O’odham Nation, the Native American tribe on whose land the Kitt Peak National Observatory, which is managed by NOAO, is located. 

Stellar lifetimes are measured in billions of years, so changes in their appearance rarely take place on a human timescale. Thus an opportunity to observe a star passing from one stage of life to another on a timescale of months to years is very exciting, as there are only a very few examples known. One such star is Sakurai’s Object (V4334 Sgr). First reported by a Japanese amateur astronomer in 1996 as a “nova-like object," Sakurai’s Object had been only a few years before the faint central star of a planetary nebula. In the 1990’s Sakurai’s Object brightened by a factor of 10000. This brightening has been attributed to a final helium shell flash. In this process the burned out core of the star at the center of the planetary nebula re-ignites. 

The final helium shell flash is violent, ejecting a cloud of dust and gas that forms a thick cocoon around the star blocking all visible light. By 2000 the dust cloud was so thick that Sakurai’s Object was not visible even with the Hubble Space Telescope (HST). Scientists at the National Optical Astronomy Observatory (NOAO) have been observing the sky in the area of Sakurai’s Object waiting for infrared radiation to break through the dust cloud. Infrared radiation penetrates dust much more efficiently than optical light. A detection of the infrared light would mean that the dust cloud is breaking apart, ultimately permitting light from the star to escape. 

Using the Altair adaptive optics (AO) system with the Gemini North telescope on Mauna Kea in Hawai’i to compensate for distortions to starlight caused by the Earth’s atmosphere, two NOAO astronomers were able to observe the shell of escaping material around the star. According to Dr. Richard Joyce, who was in charge of the imaging program, “Using AO at Gemini gave us an unprecedented view into the heart of this object and showed us a number of faint stars where Sakurai’s Object should be.” The team compared the Gemini images to views by the Hubble Space Telescope, taken before Sakurai’s Object had faded from view, to obtain a precise location for the object. The Gemini AO images have a resolution of 0.04 arc second (this is equivalent to asking someone to tell if you are holding up one finger or two – from a distance of 200 miles) which clearly resolved many of the stars that ordinarily would be blurred together from ground-based telescopic views. “The initial Gemini images in 2010 showed a faint fuzzy spot near the Sakurai location. It’s amazing that we could see this level of detail,” says Joyce. “By 2013 Sakurai’s Object was obvious at this location with two ejected clouds thanks to these remarkable observations.” 

Dr. Kenneth Hinkle, lead author, says, “Sakurai’s object appears to be forming a bipolar nebula: in the past three years two lobes of gas have been observed moving outward from the central star. The bipolar nebula is roughly aligned to the planetary nebula. The planetary nebula is formed from gas lost more than 10000 years ago by the red giant. The co-alignment suggests that there is either a companion star or planet in the system.“

The accompanying artist’s conception represents what the present expanding shell of gas and dust around the star may look like. Because it is enshrouded in dust, Sakurai’s object is much brighter in the infrared region of the spectrum than in visible light. In this illustration the star appears bright red since blue light from the star is absorbed by the dust. 

As stars like the sun reach the end of their lives they expand and cool to become luminous red giants. When their nuclear fuel is exhausted a resulting stellar core, a cooling ember, is called a white dwarf. However, in 10-15 percent of stars like the sun enough hydrogen and helium remains to start nuclear burning again, rapidly re-igniting the faint white dwarf. This phase is called a final flash. While not uncommon, this pulse lasts for such a short time that seeing it is very rare: there are only three stars currently known to be undergoing final flash evolution. Estimates of the frequency of such a final flash object in our galaxy suggest that one occurs about once every ten years. The previous one observed by astronomers erupted in 1919. 

Located in the constellation Sagittarius, in the direction of the center of our Milky Way galaxy, the distance to Sakurai’s object can be measured from the expansion of the dust cloud. The current data show that it is about 6800 to 12000 light years from Earth. As the cloud of debris expands it will be possible to refine our knowledge of the distance and other parameters of this interesting object. 

The team’s results will be published in The Astrophysical Journal

The National Optical Astronomy Observatory (NOAO) is operated by Association of Universities for Research in Astronomy Inc. (AURA) under a cooperative agreement with the National Science Foundation.

 Media Contacts:

  • Dr. Katy Garmany
    Deputy Press Officer
    National Optical Astronomy Observatory
    950 N Cherry Ave, Tucson AZ 85719 USA
    Email:
    kgarmany@noao.edu
    Desk: +1 520-318-8526

  • Peter Michaud
    Pubic Information and Outreach Manager
    Gemini Observatory, Hilo, HI
    Email:
    pmichaud@gemini.edu
    Cell: (808) 936-6643
    Desk: (808) 974-2510

Science Contacts:

  • Dr. Ken Hinkle
    National Optical Astronomy Observatory
    950 N Cherry Ave, Tucson AZ 85719 USA
    Email:
    hinkle@noao.edu


Wednesday, April 02, 2014

NASA Releases Images of M-class Solar Flare

A mid-level flare, an M6.5, erupted from sun on April 2, 2014, peaking at 10:05 a.m. EDT. This image from NASA's Solar Dynamics Observatory shows the flare in a blend of two wavelengths of extreme ultraviolet light: 131 Angstroms and 171 Angstroms, colorized in yellow and red, respectively. Image Credit: NASA/SDO/Goddard Space Flight Center
 
On April 2, 2014, the sun emitted a mid-level solar flare, peaking at 10:05 a.m. EDT, and NASA's Solar Dynamics Observatory captured imagery of the event. Solar flares are powerful bursts of radiation. Harmful radiation from a flare cannot pass through Earth's atmosphere to physically affect humans on the ground, however -- when intense enough -- they can disturb the atmosphere in the layer where GPS and communications signals travel.

To see how this event may impact Earth, please visit NOAA's Space Weather Prediction Center at http://spaceweather.gov, the U.S. government's official source for space weather forecasts, alerts, watches and warnings.

This flare is classified as an M6.5 flare. M-class flares are ten times less powerful than the most intense flares, which are labeled X-class. The number after the M provides more information about its strength. An M2 is twice as intense as an M1, an M3 is three times as intense, etc.
Updates will be provided as needed.

Karen C. Fox
NASA's Goddard Space Flight Center, Greenbelt, Md.
 

Galactic Serial Killer

The contrasting galaxies NGC 1316 and 1317

The galaxy pair NGC 1316 and 1317 in the constellation of Fornax

Wide-field view of the sky around the galaxies NGC 1316 and 1317

  **************************

Videos

Zooming in on the galaxies NGC 1316 and 1317

Panning across the galaxies NGC 1316 and 1317


This new image from the MPG/ESO 2.2-metre telescope at ESO’s La Silla Observatory in Chile shows two contrasting galaxies: NGC 1316, and its smaller neighbour NGC 1317. These two are quite close to each other in space, but they have very different histories. The small spiral NGC 1317 has led an uneventful life, but NGC 1316 has engulfed several other galaxies in its violent history and shows the battle scars.

Several clues in the structure of NGC 1316 reveal that its past was turbulent. For instance, it has some unusual dust lanes [1] embedded within a much larger envelope of stars, and a population of unusually small globular star clusters. These suggest that it may have already swallowed a dust-rich spiral galaxy about three billion years ago.

Also seen around the galaxy are very faint tidal tails — wisps and shells of stars that have been torn from their original locations and flung into intergalactic space. These features are produced by complex gravitational effects on the orbits of stars when another galaxy comes too close. All of these signs point to a violent past during which NGC 1316 annexed other galaxies and suggest that the disruptive behaviour is continuing.

NGC 1316 is located about 60 million light-years away from Earth in the southern constellation of Fornax (The Furnace). It also bears the name Fornax A, reflecting the fact that it is the brightest source of radio emission in the constellation — and in fact the fourth brightest radio source in the entire sky [2]. This radio emission is driven by material falling into the supermassive black hole at the centre of the galaxy and has probably been provided with extra fuel by the interactions with other galaxies.

This very detailed new image from the MPG/ESO 2.2-metre telescope at ESO’s La Silla Observatory in Chile was created by combining many individual images in the ESO archive. The aim of the original observations was to reveal the faintest features and study the disruption of this interesting system
.
As a bonus the new picture also provides a window into the distant Universe far beyond the two bright galaxies in the foreground. Most of the faint fuzzy spots in the picture are much more distant galaxies — and there is a particularly dense concentration just to the left of NGC 1316.

Notes

[1] These dust lanes have been imaged in detail by the NASA/ESA Hubble Space Telescope.
[2] This applies at a radio frequency of 1400 MHz, at other frequencies the order will be different.

More information

ESO is the foremost intergovernmental astronomy organisation in Europe and the world’s most productive ground-based astronomical observatory by far. It is supported by 15 countries: Austria, Belgium, Brazil, the Czech Republic, Denmark, France, Finland, Germany, Italy, the Netherlands, Portugal, Spain, Sweden, Switzerland and the United Kingdom. ESO carries out an ambitious programme focused on the design, construction and operation of powerful ground-based observing facilities enabling astronomers to make important scientific discoveries. ESO also plays a leading role in promoting and organising cooperation in astronomical research. ESO operates three unique world-class observing sites in Chile: La Silla, Paranal and Chajnantor. At Paranal, ESO operates the Very Large Telescope, the world’s most advanced visible-light astronomical observatory and two survey telescopes. VISTA works in the infrared and is the world’s largest survey telescope and the VLT Survey Telescope is the largest telescope designed to exclusively survey the skies in visible light. ESO is the European partner of a revolutionary astronomical telescope ALMA, the largest astronomical project in existence. ESO is currently planning the 39-metre European Extremely Large optical/near-infrared Telescope, the E-ELT, which will become “the world’s biggest eye on the sky”.

Links


Contacts

Richard Hook
ESO, Public Information Officer
Garching bei München, Germany
Tel: +49 89 3200 6655
Cell: +49 151 1537 3591
Email:
rhook@eso.org

Tuesday, April 01, 2014

New analytical model for turbulence pressure in galaxy clusters

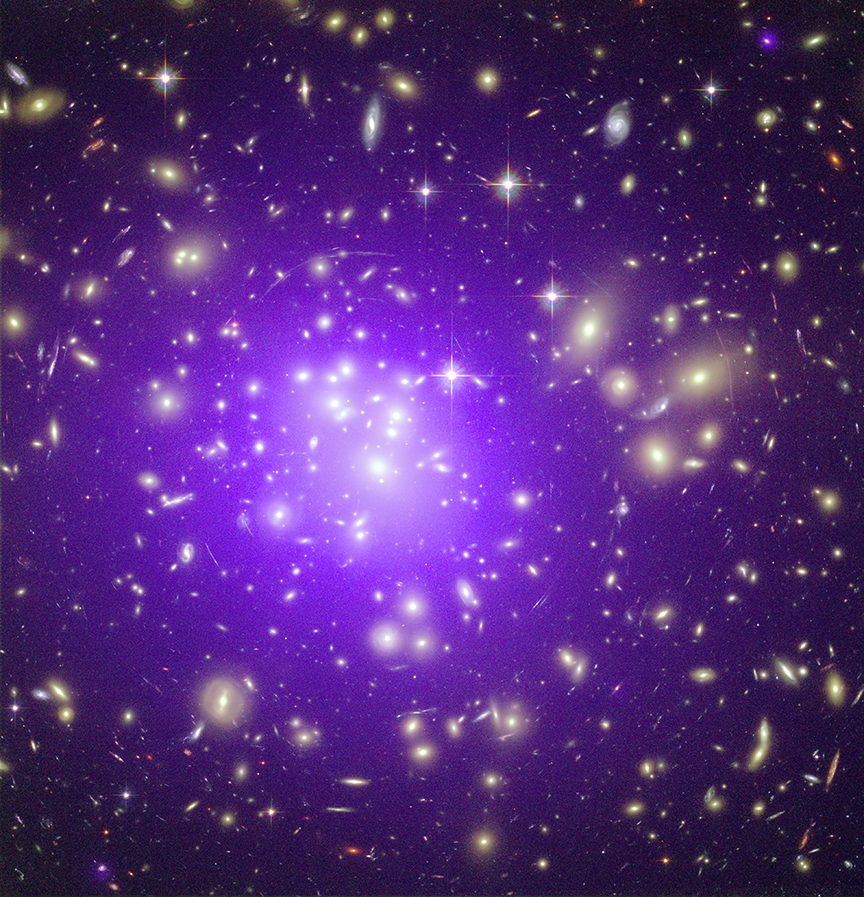
Fig. 1: The galaxy cluster Abell 1689, one of the biggest and most massive galaxy clusters known. Most of the mass is in the form of dark matter, so astronomers need to use indirect methods such as gravitational lensing, the SZ-effect or X-ray observations of the hot intracluster gas to determine the mass of a galaxy cluster.  Credit: X-ray: NASA/CXC/MIT/E.-H Peng et al; Optical: NASA/STScI 

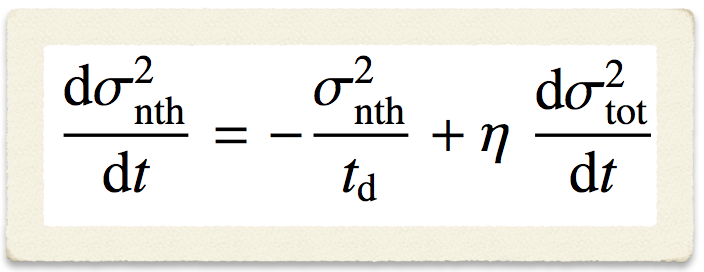
Fig. 2: This analytical equation is at the heart of the new method: it describes the evolution of pressure due to turbulence in galaxy clusters. 

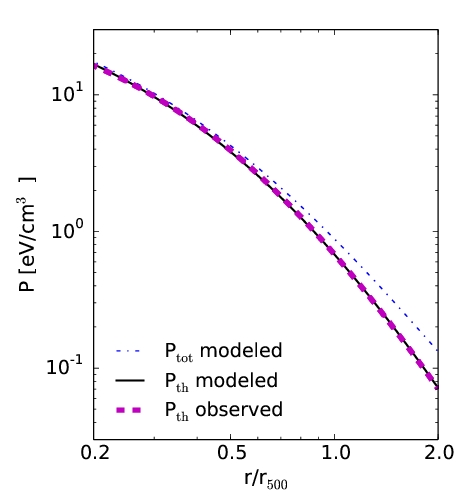
Fig. 3: The predicted total (dash-dotted) and thermal (solid) pressure profiles calculated with the new model. The calculations were performed for a group of clusters at a mean redshift z=0.1 with a average mass of 300 trillion solar masses. The thick dashed line shows the profile derived from X-ray and SZ observations. 

Mass determinations of galaxy clusters based on observations of the hot intracluster gas often neglect non-thermal processes, most importantly intracluster turbulence. This introduces a systematic error in the estimate. A group of scientists at MPA has therefore developed an analytical, one-dimensional model for the non-thermal pressure contribution, which combines the growth of galaxy clusters in a cosmological context and the physics of turbulence. If further tests against both observations and simulations confirm the initial positive results, this new model could improve the determination of cluster masses and thus make galaxy clusters a more accurate cosmological tool.  

The expansion of the present-day Universe is accelerating, and the origin of this acceleration is unknown. It indicates either the presence of “Dark Energy” - a mysterious energy component in the Universe with negative pressure, or a breakdown of Einstein’s General Relativity - how gravity works on cosmological scales. In order to distinguish between these two explanations, we must measure how structures in the Universe evolve over time. 

Galaxy clusters (see Fig. 1) grow in mass by accreting material from their surroundings over cosmic history. They are the largest known gravitationally bound objects in the Universe and therefore are an excellent probe of the growth of large-scale structures – and thus of the origin of the cosmic acceleration. If we want to use galaxy clusters as a probe of the acceleration, we need to accurately determine their masses. Although these giants are dominated by invisible “dark matter”, we can infer their total mass from observations of the intracluster gas under the assumption of a hydrostatic equilibrium between the gravitational pull and the gas pressure, or more accurately the gradient of the gas pressure. 

Observations of the intracluster gas, however, typically measure only the thermal pressure of the gas. Non-thermal pressure, especially from turbulent gas motion, has been recognized to provide an additional pressure gradient and therefore has to be taken into account as well. Neglecting this contribution would result in a deviation of the inferred cluster mass from the true mass and in consequence this would influence the study of cosmic acceleration. 

So far, the amplitude of the turbulence pressure has mainly been estimated with large-scale hydrodynamical numerical simulations. These state-of-the-art simulations, however, yield quantitatively different results when using different numerical methods. Moreover, they are computationally expensive and do not lead to a direct physical understanding of what is happening in the galaxy clusters. 

Therefore, we took a different approach to this problem by gathering physical insights about how turbulence arises and dissipates in the intracluster gas. From this input, we formed a one-dimensional analytical model of the non-thermal pressure contribution, which describes the velocity dispersion due to turbulence at each radius as the galaxy cluster grows in mass (Fig.2). 

This new analytical model predicts that the non-thermal fraction of the gas pressure increases towards cluster outskirts as it takes significantly longer for turbulence to dissipate at larger distances from the cluster centre. Another prediction is that the non-thermal fraction is larger in clusters with higher masses and in clusters observed at higher redshift (i.e. at earlier cosmic times), since they grow faster which triggers more turbulence. 

With the help of an existing model of the total pressure, the new model also gives the thermal pressure as well as the biased mass estimate derived from this thermal pressure gradient. If we compare our results with observations of a population of galaxy clusters, the predicted thermal pressure profile is in excellent agreement with the data (Fig.3). 

Thus, our model has passed an important observational test; in addition we found qualitative agreement with simulation data. More specific tests on the predicted mass and redshift dependence will be performed both against observations and numerical simulations. If all the tests are passed successfully, the physical understanding provided by the new model will lead to a better determination of the cluster masses. We can then use galaxy clusters as a competitive probe of the origin of cosmic acceleration.

Xun Shi and Eiichiro Komatsu


Original publication:

Xun Shi, Eiichiro Komatsu, "Analytical model for non-thermal pressure in galaxy clusters", submitted to MNRAS linkPfeilExtern.gifarXiv:1401.7657


NASA Releases Images of X-class Solar Flare

Extreme ultraviolet light streams out of an X-class solar flare as seen in this image captured on March 29, 2014, by NASA's Solar Dynamics Observatory. This image blends two wavelengths of light: 304 and 171 Angstroms, which help scientists observe the lower levels of the sun's atmosphere.Image Credit: NASA/SDO. View full disk image
 
The sun emitted a significant solar flare, peaking at 1:48 p.m. EDT March 29, 2014, and NASA's Solar Dynamics Observatory captured images of the event. Solar flares are powerful bursts of radiation. Harmful radiation from a flare cannot pass through Earth's atmosphere to physically affect humans on the ground, however -- when intense enough -- they can disturb the atmosphere in the layer where GPS and communications signals travel.

To see how this event impacted Earth, please visit NOAA's Space Weather Prediction Center at http://spaceweather.gov, the U.S. government's official source for space weather forecasts, alerts, watches and warnings.

This flare is classified as an X.1-class flare. X-class denotes the most intense flares, while the number provides more information about its strength. An X2 is twice as intense as an X1, an X3 is three times as intense, etc.

Karen C. Fox
NASA's Goddard Space Flight Center, Greenbelt, Md.