Saturday, August 31, 2024

New Horizons Measurements Shed New Light on the Darkness of the Universe

An artist's impression of NASA's New Horizons spacecraft against the backdrop of deep space. More than 5.4 billion miles (7.3 billion kilometers) from Earth, New Horizons is traversing a region of the solar system far enough from the Sun to offer the darkest skies available to any existing telescope – and to provide a unique vantage point from which to measure the overall brightness of the distant universe. The lane of our Milky Way galaxy is in the background. Credits: Artwork: NASA, APL, SwRI, Serge Brunier (ESO), Marc Postman (STScI), Dan Durda

Just how dark is deep space? Astronomers may have finally answered this long-standing question by tapping into the capabilities and distant position of NASA's New Horizons spacecraft, by making the most precise, direct measurements ever of the total amount of light the universe generates.

More than 18 years after launch and nine years after its historic exploration of Pluto, New Horizons is more than 5.4 billion miles (7.3 billion kilometers) from Earth, in a region of the solar system far enough from the Sun to offer the darkest skies available to any existing telescope – and to provide a unique vantage point from which to measure the overall brightness of the distant universe.

"If you hold up your hand in deep space, how much light does the universe shine on it?" asked Marc Postman, an astronomer at the Space Telescope Science Institute in Baltimore and lead author of a new paper detailing the research, which published today in The Astrophysical Journal . "We now have a good idea of just how dark space really is. The results show that the great majority of visible light we receive from the universe was generated in galaxies. Importantly, we also found that there is no evidence for significant levels of light produced by sources not presently known to astronomers."

The findings solve a puzzle that has perplexed scientists since the 1960s, when astronomers Arno Penzias and Robert Wilson discovered that space is pervaded by strong microwave radiation, which had been predicted to be left over from the creation of the universe itself. This result led to their being awarded the Nobel Prize. Subsequently, astronomers also found evidence of backgrounds of X-rays, gamma rays and infrared radiation that also fill the sky.

Detecting the background of "ordinary" (or visible) light – more formally called the cosmic optical background, or COB – provided a way to add up all the light generated by galaxies over the lifetime of the universe before NASA's Hubble Space Telescope and James Webb Space Telescope could see the faint background galaxies directly.

In the Hubble and James Webb telescope era, astronomers measure the COB to detect light that might come from sources other than these known galaxies. But measuring the total light output of the universe is extremely difficult from Earth or anywhere in the inner solar system.

"People have tried over and over to measure it directly, but in our part of the solar system, there's just too much sunlight and reflected interplanetary dust that scatters the light around into a hazy fog that obscures the faint light from the distant universe," said Tod Lauer, a New Horizons co-investigator, astronomer from the National Science Foundation NOIRLab in Tucson, Arizona, and a co-author of the new paper. "All attempts to measure the strength of the COB from the inner solar system suffer from large uncertainties."

Enter New Horizons, billions of miles along its trek beyond the planets, now deep in the Kuiper Belt and headed toward interstellar space. Late last summer, from a distance 57 times farther from the Sun than Earth, New Horizons scanned the universe with its Long Range Reconnaissance Imager (LORRI), collecting two-dozen separate imaging fields. LORRI itself was intentionally shielded from the Sun by the main body of the spacecraft – keeping even the dimmest sunlight from directly entering the sensitive camera – and the target fields were positioned away from the bright disk and core of the Milky Way and nearby bright stars.

The New Horizons observers used other data, taken in the far-infrared by the European Space Agency's Planck mission, of fields with a range in dust density to calibrate the level of those far-infrared emissions to the level of ordinary visible light. This allowed them to accurately predict and correct for the presence of dust-scattered Milky Way light in the COB images – a technique that was not available to them during a 2021 test COB observation run with New Horizons in which they underestimated the amount of dust-scattered light and overestimated excess light from the universe itself.

But this time around, after accounting for all known sources of light, such as background stars and light scattered by thin clouds of dust within the Milky Way galaxy, the researchers found the remaining level of visible light was entirely consistent with the intensity of light generated by all galaxies over the past 12.6 billion years.

"The simplest interpretation is that the COB is completely due to galaxies," Lauer said. "Looking outside the galaxies, we find darkness there and nothing more."

"This newly published work is an important contribution to fundamental cosmology, and really something that could only be done with a far-away spacecraft like New Horizons," said New Horizons Principal Investigator Alan Stern, of the Southwest Research Institute in Boulder, Colorado. "And it shows that our current extended mission is making important scientific contributions far beyond the original intent of this planetary mission designed to make the first close spacecraft explorations of Pluto and Kuiper Belt objects."

Launched in January 2006, New Horizons made the historic reconnaissance of Pluto and its moons in July 2015, before giving humankind its first close-up look at a planetary building block and Kuiper Belt object, Arrokoth, in January 2019. New Horizons is now in its second extended mission, imaging distant Kuiper Belt objects, characterizing the outer heliosphere of the Sun, and making important astrophysical observations from its unmatched vantage point in the farthest regions of the solar system.

The Johns Hopkins Applied Physics Laboratory (APL) in Laurel, Maryland, built and operates the New Horizons spacecraft and manages the mission for NASA's Science Mission Directorate. Southwest Research Institute, based in San Antonio and Boulder, Colorado, directs the mission via Principal Investigator Alan Stern and leads the science team, payload operations and encounter science planning. New Horizons is part of NASA's New Frontiers program, managed by NASA's Marshall Space Flight Center in Huntsville, Alabama.


About This Release

Credits:

Media Contact:

Michael Buckley
Johns Hopkins University Applied Physics Laboratory, Laurel, Maryland

Ray Villard
Space Telescope Science Institute, Baltimore, Maryland

Science Contact:

Marc Postman
Space Telescope Science Institute, Baltimore, Maryland

Permissions: Content Use Policy

Contact Us: Direct inquiries to the News Team.

Related Links and Documents


Friday, August 30, 2024

Webb peeks into Perseus

A nebula made up of cloudy gas and dust in the form of soft and wispy clouds and, in the centre, thin and highly detailed layers pressed close together. Large, bright stars surrounded by six long points of light are dotted over the image, as well as some small, point-like stars embedded in the clouds. The clouds are lit up in blue close to the stars; orange colours show clouds that glow in infrared light. Credit: ESA/Webb, NASA & CSA, A. Scholz, K. Muzic, A. Langeveld, R. Jayawardhana

This stunning new mosaic of images from the NASA/ESA/CSA James Webb Space Telescope showcases the nearby star-forming cluster, NGC 1333. The nebula is in the Perseus molecular cloud, and located approximately 960 light-years away.

Webb’s superb sensitivity allows astronomers to investigate young objects with extremely low masses. Some of the faintest ‘stars’ in the picture are in fact newly born free-floating brown dwarfs with masses comparable to those of giant planets.

The same cluster was featured as the 33rd anniversary image of the NASA/ESA Hubble Space Telescope in April 2023. Hubble’s image just scratched the surface of this region, because clouds of dust obscure much of the star formation process. Observing with larger aperture and in the infrared part of the spectrum, Webb is capable of peering through the dusty veil to reveal newborn stars, brown dwarfs and planetary mass objects.

The centre of the image presents a deep peek into the heart of the NGC1333 cloud. Across the image we see large patches of orange, which represent gas glowing in the infrared. These so-called Herbig-Haro objects form when ionised material ejected from young stars collides with the surrounding cloud. They are hallmarks of a very active site of star formation.

Many of the young stars in this image are surrounded by disks of gas and dust, which may eventually produce planetary systems. Similar to the young stars in this mosaic, our own Sun and planets formed inside a dusty molecular cloud, 4.6 billion years ago. Our Sun did not form in isolation but as part of a cluster, which was perhaps even more massive than NGC 1333. The cluster in the mosaic, only 1-3 million years old, presents us with an opportunity to study stars like our Sun, as well as brown dwarfs and free-floating planets, in their nascent stages.

The images were captured as part of the Webb observation programme 1202 (PI: A. Scholz) to survey a large portion of NGC 1333. These data constitute the first deep spectroscopic survey of the young cluster, and have identified brown dwarfs down to planetary masses using the observatory’s Near-Infrared Imager and Slitless Spectrograph (NIRISS). The first results from this survey have been accepted for publication in the Astronomical Journal.

Source: ESA


Licence
CC BY 4.0 INT or ESA Standard Licence
(content can be used under either licence)

Space Science

JWST | Webb


Thursday, August 29, 2024

Black Hole Fireworks: Tidal Disruption Events Light Up Supermassive Black Holes

An illustration of an accretion disk forming around a supermassive black hole in the wake of a tidal disruption event.
Adapted from NASA/Swift/Aurore Simonnet, Sonoma State University


Title: Late-Time Radio Flares in Tidal Disruption Events
Authors: Tatsuya Matsumoto and Tsvi Piran
First Author’s Institution: Kyoto University
Status: Published in ApJ

Hungry (and Loud) Black Holes

Tidal disruption events arise when a star wanders too close to a supermassive black hole that then exerts a tidal force across the star, shredding it. These events are relatively rare: we have only discovered a few hundred. When the star is disrupted, about two-thirds of the material remains bound. The remaining material is ejected from the supermassive black hole into the “circumnuclear medium,” or the region immediately surrounding the supermassive black hole. We typically discover tidal disruption events from the optical emission resulting from the initial disruption, which lasts several weeks. However, tidal disruption events are known to be multi-wavelength events visible across the electromagnetic spectrum. Before optical tidal disruption events were discovered, almost all of the tidal disruption events were found in the X-ray, where the formation of an accretion disk around the supermassive black hole may be powering some high-energy activity. On the other end of the spectrum, the radio properties of tidal disruption events have proven to be unique. Today’s article aims to explain the radio light curves of tidal disruption events.

The radio emission from tidal disruption events is caused by the material that survives the disruption of the star and is ejected away from the supermassive black hole. This stellar material runs into the ambient density surrounding the supermassive black hole, causing shocks inside the material. These shocks give rise to synchrotron radiation, an emission caused by free electrons in a plasma spiraling around magnetic field lines. Directly related to the density and energy of the material, the synchrotron radiation is emitted across the radio spectrum, typically at frequencies lower than 10 GHz, making it an excellent choice for instruments like the Very Large Array.

Second Peak, Second Life?

Although we know about a third of the material from the star is ejected away from the supermassive black hole after the disruption, we do not understand how the black hole launches this material. For example, supermassive black holes in active galactic nuclei can launch powerful relativistic jets as they accrete massive amounts of material. Or, in a less energetic scenario, a jet does not have to be launched, and the outflows could be in all directions and essentially non-relativistic. In yet another situation, the delayed formation of an accretion disk may induce a relativistic jet to be launched much later than the initial disruption. To complicate matters further, it is almost certain that tidal disruption events do not originate from an underlying homogeneous population and that a spectrum of disruption scenarios results in many different ejecta geometries.

Today’s article uses the non-relativistic approach to model the tidal disruption event scenario. The authors model a shock quasi-spherically propagating first through a circumnuclear medium with a radially decreasing density and then through an interstellar medium with constant density. Using a standard set of code and modeling packages for synchrotron emission, they produce light curves for what this model should look like. In this model, there are two peaks caused by differing effects. The radio emission is “self-absorbed” in the first peak and transitions to optically thin, eventually peaking. By measuring the peak frequency and luminosity, we can estimate the radius of the outflow and local circumnuclear medium density. Then, depending on the spectral index of the circumnuclear medium’s radial density profile, the light curve will fall and eventually reach a minimum at the Bondi radius of the supermassive black hole. At this point, the radial density profile becomes flat (i.e., constant density interstellar medium), and the radio light curve will rise again as the shock wave sweeps up material. The brightness will continue to increase until the swept-up mass is comparable to the mass from the original ejected outflow. After the second peak, the radio brightness decreases indefinitely.

How does this model compare to some real scenarios? The authors of today’s article select two well-known events from the literature and gather radio observations to compare with their modeled light curves. When comparing AT2019dsg and AT2020vwl, the double-peaked feature is evident in both light curves, as seen in Figure 1. The authors note that while the rapid t3 initial rise is well explained for both sources, other radio-loud tidal disruption events, such as AT2018hyz, rise even faster like t5 and thus are better candidates for relativistic models. The authors state that further observations at even later times will enable improvements to this model and constrain their parameters.


Figure 1: The late-time C-band (6 GHz) radio light curves of AT2019dsg and AT2020vwl. These sources have some of the best data quality and quantity in the literature. The double-peaked feature of our authors’ model is evident in the light curves of both events. Credit: Matsumoto & Piran 2024

Original astrobite edited by Archana Aravindan


About the author, Will Golay:

I am a graduate student in the Department of Astronomy at Harvard University and the Center for Astrophysics | Harvard & Smithsonian, advised by Edo Berger. I study radio emission from transient astrophysical objects like tidal disruption events.


Editor’s Note: Astrobites is a graduate-student-run organization that digests astrophysical literature for undergraduate students. As part of the partnership between the AAS and astrobites, we occasionally repost astrobites content here at AAS Nova. We hope you enjoy this post from astrobites; the original can be viewed at astrobites.org.


Wednesday, August 28, 2024

EHT scientists make highest-resolution observations yet from the surface of Earth

PR Image eso2411a
Illustration of the highest-resolution detections ever made from the surface of Earth

PR Image eso2411b
Location of the observatories used in an EHT pilot experiment

PR Image eso2411c
Computer simulation illustrating how a black hole looks like at different wavelengths


Videos

Sharpest ground observations ever | ESO Chasing Starlight
PR Video eso2411a
Sharpest ground observations ever | ESO Chasing Starlight

Animation of the highest-resolution detections ever made from the surface of Earth
PR Video eso2411b
Animation of the highest-resolution detections ever made from the surface of Earth


The Event Horizon Telescope (EHT) Collaboration has conducted test observations, using the Atacama Large Millimeter/submillimeter Array (ALMA) and other facilities, that achieved the highest resolution ever obtained from the surface of Earth [1]. They managed this feat by detecting light from distant galaxies at a frequency of around 345 GHz, equivalent to a wavelength of 0.87 mm. The Collaboration estimates that in future they will be able to make black hole images that are 50% more detailed than was possible before, bringing the region immediately outside the boundary of nearby supermassive black holes into sharper focus. They will also be able to image more black holes than they have done so far. The new detections, part of a pilot experiment, were published today in The Astronomical Journal.

The EHT Collaboration released images of M87*, the supermassive black hole at the centre of the M87 galaxy, in 2019, and of Sgr A*, the black hole at the heart of our Milky Way galaxy, in 2022. These images were obtained by linking together multiple radio observatories across the planet, using a technique called very long baseline interferometry (VLBI), to form a single ‘Earth-sized’ virtual telescope.

To get higher-resolution images, astronomers typically rely on bigger telescopes — or a larger separation between observatories working as part of an interferometer. But since the EHT was already the size of Earth, increasing the resolution of their ground-based observations called for a different approach. Another way to increase the resolution of a telescope is to observe light of a shorter wavelength — and that’s what the EHT Collaboration has now done.

With the EHT, we saw the first images of black holes using the 1.3-mm wavelength observations, but the bright ring we saw, formed by light bending in the black hole’s gravity, still looked blurry because we were at the absolute limits of how sharp we could make the images,” said the study's co-lead Alexander Raymond, previously a postdoctoral scholar at the Center for Astrophysics | Harvard & Smithsonian (CfA), and now at the Jet Propulsion Laboratory, both in the United States. “At 0.87 mm, our images will be sharper and more detailed, which in turn will likely reveal new properties, both those that were previously predicted and maybe some that weren’t.

To show that they could make detections at 0.87 mm, the Collaboration conducted test observations of distant, bright galaxies at this wavelength [2]. Rather than using the full EHT array, they employed two smaller subarrays, both of which included ALMA and the Atacama Pathfinder EXperiment (APEX) in the Atacama Desert in Chile. The European Southern Observatory (ESO) is a partner in ALMA and co-hosts and co-operates APEX. Other facilities used include the IRAM 30-meter telescope in Spain and the NOrthern Extended Millimeter Array (NOEMA) in France, as well as the Greenland Telescope and the Submillimeter Array in Hawaiʻi.

In this pilot experiment, the Collaboration achieved observations with detail as fine as 19 microarcseconds, meaning they observed at the highest-ever resolution from the surface of Earth. They have not been able to obtain images yet, though: while they made robust detections of light from several distant galaxies, not enough antennas were used to be able to accurately reconstruct an image from the data.

This technical test has opened up a new window to study black holes. With the full array, the EHT could see details as small as 13 microarcseconds, equivalent to seeing a bottle cap on the Moon from Earth. This means that, at 0.87 mm, they will be able to get images with a resolution about 50% higher than that of previously released M87* and SgrA* [3] 1.3-mm images. In addition, there’s potential to observe more distant, smaller and fainter black holes than the two the Collaboration has imaged thus far.

EHT Founding Director Sheperd “Shep” Doeleman, an astrophysicist at the CfA and study co-lead, says: “Looking at changes in the surrounding gas at different wavelengths will help us solve the mystery of how black holes attract and accrete matter, and how they can launch powerful jets that stream over galactic distances.

This is the first time that the VLBI technique has been successfully used at the 0.87 mm wavelength. While the ability to observe the night sky at 0.87 mm existed before the new detections, using the VLBI technique at this wavelength has always presented challenges that took time and technological advances to overcome. For example, water vapour in the atmosphere absorbs waves at 0.87 mm much more than it does at 1.3 mm, making it more difficult for radio telescopes to receive signals from black holes at the shorter wavelength. Combined with increasingly pronounced atmospheric turbulence and noise buildup at shorter wavelengths, and an inability to control global weather conditions during atmospherically sensitive observations, progress to shorter wavelengths for VLBI — especially those that cross the barrier into the submillimetre regime — has been slow. But with these new detections, that’s all changed.

"These VLBI signal detections at 0.87 mm are groundbreaking since they open a new observing window for the study of supermassive black holes", states Thomas Krichbaum, a co-author of the study from the Max Planck Institute for Radio Astronomy in Germany, an institution that operates the APEX telescope together with ESO. He adds: "In the future, the combination of the IRAM telescopes in Spain (IRAM-30m) and France (NOEMA) with ALMA and APEX will enable imaging of even smaller and fainter emission than has been possible thus far at two wavelengths, 1.3 mm and 0.87 mm, simultaneously."

Source: ESO/News


Notes

[1] There have been astronomical observations with higher resolution, but these were obtained by combining signals from telescopes on the ground with a telescope in space: https://www.mpifr-bonn.mpg.de/pressreleases/2022/2. The new observations released today are the highest-resolution ones ever obtained using only ground-based telescopes.

[2] To test their observations, the EHT Collaboration pointed the antennas to very distant ‘active’ galaxies, which are powered by supermassive black holes at their cores and are very bright. These types of sources help to calibrate the observations before pointing the EHT to fainter sources, like nearby black holes.

[3] The GRAVITY instrument on ESO’s Very Large Telescope Interferometer has also obtained
extremely detailed observations of Sgr A*, pinpointing the exact location of the black hole and the material orbiting it with an accuracy of a few tenths of microarcseconds.


More information

This EHT Collaboration research was presented in a paper by A. W. Raymond et al. published today in The Astronomical Journal (doi: 10.3847/1538-3881/ad5bdb).

The EHT Collaboration involves more than 400 researchers from Africa, Asia, Europe, North and South America, with around 270 participating in this paper. The international collaboration aims to capture the most detailed black hole images ever obtained by creating a virtual Earth-sized telescope. Supported by considerable international efforts, the EHT links existing telescopes using novel techniques — creating a fundamentally new instrument with the highest angular resolving power that has yet been achieved.

The EHT consortium consists of 13 stakeholder institutes; the Academia Sinica Institute of Astronomy and Astrophysics, the University of Arizona, the Center for Astrophysics | Harvard & Smithsonian, the University of Chicago, the East Asian Observatory, Goethe University Frankfurt, Institut de Radioastronomie Millimétrique, Large Millimeter Telescope, Max Planck Institute for Radio Astronomy, MIT Haystack Observatory, National Astronomical Observatory of Japan, Perimeter Institute for Theoretical Physics, and Radboud University.

The Atacama Large Millimeter/submillimeter Array (ALMA), an international astronomy facility, is a partnership of ESO, the U.S. National Science Foundation (NSF) and the National Institutes of Natural Sciences (NINS) of Japan in cooperation with the Republic of Chile. ALMA is funded by ESO on behalf of its Member States, by NSF in cooperation with the National Research Council of Canada (NRC) and the Ministry of Science and Technology (MOST) and by NINS in cooperation with the Academia Sinica (AS) in Taiwan and the Korea Astronomy and Space Science Institute (KASI). ALMA construction and operations are led by ESO on behalf of its Member States; by the National Radio Astronomy Observatory (NRAO), managed by Associated Universities, Inc. (AUI), on behalf of North America; and by the National Astronomical Observatory of Japan (NAOJ) on behalf of East Asia. The Joint ALMA Observatory (JAO) provides the unified leadership and management of the construction, commissioning and operation of ALMA.

The Atacama Pathfinder EXperiment (APEX) is a 12-metre-diameter telescope, operating at millimetre and submillimetre wavelengths — between infrared light and radio waves. ESO operates APEX at one of the highest observatory sites on Earth, at an elevation of 5100 metres, high on the Chajnantor plateau in Chile’s Atacama region. APEX is a project of the Max Planck Institute for Radio Astronomy (MPIfR), hosted and operated by ESO on behalf of the MPIfR.

The European Southern Observatory (ESO) enables scientists worldwide to discover the secrets of the Universe for the benefit of all. We design, build and operate world-class observatories on the ground — which astronomers use to tackle exciting questions and spread the fascination of astronomy — and promote international collaboration for astronomy. Established as an intergovernmental organisation in 1962, today ESO is supported by 16 Member States (Austria, Belgium, Czechia, Denmark, France, Finland, Germany, Ireland, Italy, the Netherlands, Poland, Portugal, Spain, Sweden, Switzerland and the United Kingdom), along with the host state of Chile and with Australia as a Strategic Partner. ESO’s headquarters and its visitor centre and planetarium, the ESO Supernova, are located close to Munich in Germany, while the Chilean Atacama Desert, a marvellous place with unique conditions to observe the sky, hosts our telescopes. ESO operates three observing sites: La Silla, Paranal and Chajnantor. At Paranal, ESO operates the Very Large Telescope and its Very Large Telescope Interferometer, as well as survey telescopes such as VISTA. Also at Paranal ESO will host and operate the Cherenkov Telescope Array South, the world’s largest and most sensitive gamma-ray observatory. Together with international partners, ESO operates ALMA on Chajnantor, a facility that observes the skies in the millimetre and submillimetre range. At Cerro Armazones, near Paranal, we are building “the world’s biggest eye on the sky” — ESO’s Extremely Large Telescope. From our offices in Santiago, Chile we support our operations in the country and engage with Chilean partners and society.


Links


Contacts:

Shep Doeleman
Center for Astrophysics | Harvard & Smithsonian
Cambridge, MA, United States
Tel: +1-617-496-7762
Email:
sdoeleman@cfa.harvard.edu

Thomas Krichbaum
Max Planck Institute for Radio Astronomy
Bonn, Germany
Tel: +49 228 525 295
Email:
tkrichbaum@mpifr-bonn.mpg.de

Bárbara Ferreira
ESO Media Manager
Garching bei München, Germany
Tel: +49 89 3200 6670
Cell: +49 151 241 664 00
Email:
press@eso.org


Tuesday, August 27, 2024

Webb Finds Early Galaxies Weren't Too Big for Their Britches After All

CEERS Crop (NIRCam Image)
Credits: Image: NASA, ESA, CSA, Steve Finkelstein (UT Austin)


When astronomers got their first glimpses of galaxies in the early universe from NASA’s James Webb Space Telescope, they were expecting to find galactic pipsqueaks, but instead they found what appeared to be a bevy of Olympic bodybuilders. Some galaxies appeared to have grown so massive, so quickly, that simulations couldn’t account for them. Some researchers suggested this meant that something might be wrong with the theory that explains what the universe is made of and how it has evolved since the big bang, known as the standard model of cosmology.

According to a new study in the Astronomical Journal led by University of Texas at Austin graduate student Katherine Chworowsky, some of those early galaxies are in fact much less massive than they first appeared. Black holes in some of these galaxies make them appear much brighter and bigger than they really are.

“We are still seeing more galaxies than predicted, although none of them are so massive that they ‘break’ the universe,” Chworowsky said.

The evidence was provided by Webb’s Cosmic Evolution Early Release Science (CEERS) Survey, led by Steven Finkelstein, a professor of astronomy at UT Austin and study co-author.

Black Holes Add to Brightness

According to this latest study, the galaxies that appeared overly massive likely host black holes rapidly consuming gas. Friction in the fast-moving gas emits heat and light, making these galaxies much brighter than they would be if that light emanated just from stars. This extra light can make it appear that the galaxies contain many more stars, and hence are more massive, than we would otherwise estimate. When scientists remove these galaxies, dubbed “little red dots” (based on their red color and small size), from the analysis, the remaining early galaxies are not too massive to fit within predictions of the standard model.

“So, the bottom line is there is no crisis in terms of the standard model of cosmology,” Finkelstein said. “Any time you have a theory that has stood the test of time for so long, you have to have overwhelming evidence to really throw it out. And that’s simply not the case.”

Efficient Star Factories

Although they’ve settled the main dilemma, a less thorny problem remains: There are still roughly twice as many massive galaxies in Webb’s data of the early universe than expected from the standard model. One possible reason might be that stars formed more quickly in the early universe than they do today.

“Maybe in the early universe, galaxies were better at turning gas into stars,” Chworowsky said.

Star formation happens when hot gas cools enough to succumb to gravity and condense into one or more stars. But as the gas contracts, it heats up, generating outward pressure. In our region of the universe, the balance of these opposing forces tends to make the star formation process very slow. But perhaps, according to some theories, because the early universe was denser than today, it was harder to blow gas out during star formation, allowing the process to go faster.

More Evidence of Black Holes

Concurrently, astronomers have been analyzing the spectra of "little red dots" discovered with Webb, with researchers in both the CEERS team and others finding evidence of fast-moving hydrogen gas, a signature of black hole accretion disks. This supports the idea that at least some of the light coming from these compact, red objects comes from gas swirling around black holes, rather than stars – reinforcing Chworowsky and their team’s conclusion that they are probably not as massive as astronomers initially thought. However, further observations of these intriguing objects are incoming, and should help solve the puzzle about how much light comes from stars versus gas around black holes.

Often in science, when you answer one question, that leads to new questions. While Chworowsky and their colleagues have shown that the standard model of cosmology likely isn’t broken, their work points to the need for new ideas in star formation.

“And so there is still that sense of intrigue,” Chworowsky said. “Not everything is fully understood. That’s what makes doing this kind of science fun, because it’d be a terribly boring field if one paper figured everything out, or there were no more questions to answer.”

The James Webb Space Telescope is the world’s premier space science observatory. Webb is solving mysteries in our solar system, looking beyond to distant worlds around other stars, and probing the mysterious structures and origins of our universe and our place in it. Webb is an international program led by NASA with its partners, ESA (European Space Agency) and CSA (Canadian Space Agency).


About This Release:

Credits:

Media Contact:

Marc Airhart
University of Texas at Austin, Austin, Texas

Christine Pulliam
Space Telescope Science Institute, Baltimore, Maryland


Permissions: Content Use Policy

Contact Us: Direct inquiries to the News Team.

Related Links and Documents


Monday, August 26, 2024

Hiding a bright secret

A spiral galaxy, with two glowing spiral arms. They are filled with thin lines of dark dust, and surrounded by a faint cloud. One arm stretches further from the galaxy than the other. The point at the centre of the spiral is particularly bright. It is on a black background, mostly empty, except for some distant galaxies and a few bright stars in the foreground. Credit: ESA/Hubble & NASA, M. Koss, A. Barth

Looking past its long spiral arms filled with stars and the dark threads of dust crossing it, your eye might be caught by the shining point at the centre of UGC 3478, the spiral galaxy starring in this Hubble Picture of the Week. This point is the galaxy’s nucleus, and indeed there is something special about it: it is a growing giant black hole which astronomers call an active galactic nucleus, or AGN.

UGC 3478, located in the constellation Camelopardalis, is what is known as a Seyfert galaxy. This is a type of galaxy with an AGN at its core. Like all such “active galaxies”, the brightness that you see here hides a supermassive black hole at the centre of the galaxy. A disc of gas spirals into this black hole, and as the material crashes together and heats up it emits very strong radiation. The spectrum of this radiation includes hard X-ray emission, which clearly mark it out from the stars in the galaxy. Despite the strong brightness of the compact central region, we can still clearly see the disc of the galaxy around it, which makes the galaxy a Seyfert galaxy.

Many active galaxies are known to astronomers at vast distances from Earth, thanks to the great brightness of their nuclei highlighting them next to other, dimmer galaxies. At 128 million light-years from Earth, UGC 3478 is positively neighbourly to us. The data used to make this image comes from a Hubble survey of nearby powerful AGNs found in relatively high-energy X-rays, like this one, which it is hoped can help astronomers to understand how the galaxies interact with the supermassive black holes at their hearts.


Friday, August 23, 2024

NuSTAR Reveals Black Hole Shredding a Star

A star is being consumed by a nearby supermassive black hole, in a rare event that astronomers call a tidal disruption event (TDE). What makes this event, AT2022cmc, even more rare is that as the black hole ripped the star apart, jets of material moving at almost the speed of light were launched. AT2022cmc, depicted here in an artist’s impression, was the first jetted-TDE discovered in over a decade and the first since the launch of NuSTAR. The sensitive, broadband X-ray observation by NuSTAR provided critical data for understanding the event. Image credit: ESO/M.Kornmesser


NuSTAR unveiled crucial details for understanding one of the most energetic types of event in the universe. If a star comes too close to a supermassive black hole, it will be torn apart by the black hole’s tidal force. Fundamentally, the side of the star closer to the black hole feels a stronger gravitational pull than the far side of the star, much like people on Earth feel stronger gravity than an astronaut in the International Space Station. However, you’d have to imagine an astronaut so tall that their feet were on Earth while their head was in orbit. And the difference in gravitational field would also be much larger. When a star comes extremely close to the black hole, it becomes stretched and is pulled apart. The resulting stream of material loops around the black hole. Some stellar material is captured into orbit, creating an accretion disk around the black hole. This disk becomes quite bright. In a very rare subclass of events, a relativistic jet is also produced, creating another source of light. As the disk material is consumed by the black hole over the course of months to years, the event gradually fades.

Tidal disruption events, or TDEs for short, were first predicted in the 1970s, and first observed in the 1990s. Currently, approximately 100 TDEs are known, only four of which are of the rare jetted-TDE variety.

Just after midnight on February 11, 2022, the Zwicky Transient Facility at Palomar Observatory in Southern California detected a new transient source. Data obtained over the next two nights led to this new source, AT2022cmc, being flagged as unusual, rising and falling faster than a typical supernova. This inspired follow-up observations using telescopes around the planet and in space. Those data provided the distance and energetics of the system, ultimately classifying it as a jetted-TDE. This subclass of TDE is very bright at X-ray energies, and only four have been detected to date. The most recent jetted-TDE occurred more than a decade ago, prior to the launch of NuSTAR. NuSTAR is the first focusing high-energy, or hard X-ray telescope in orbit, providing two orders of magnitude improvement in sensitivity compared to previous instruments. NuSTAR significantly extends the range of X-ray energies that can be studied in detail for astrophysical phenomena. AT2022cmc provided the first opportunity to study this type of rare, X-ray bright, transient event and motivated three NuSTAR observations in the month after its discovery.

While the lower energy emission from jetted-TDEs is relatively well understood (e.g., at radio, optical, and UV energies), the location and mechanism producing the bright X-ray emission in jetted-TDEs is a topic of active debate. The most popular scenario is that the X-rays come from less energetic photons in the radio and optical bands being scattered by energetic relativistic electrons in the surrounding plasma up to X-ray energies. This scenario predicts that we should see the high-energy X-ray spectrum as a smooth extrapolation of the lower-energy X-ray spectrum. However, when NuSTAR observed AT2022cmc, it detected a pronounced break in the X-ray spectrum within the NuSTAR band. This break gives an important clue to the X-ray emission mechanisms of jetted-TDEs.

In a recent paper published in the Astrophysical Journal, Dr. Yuhan Yao of the University of California, Berkeley and her team report that the NuSTAR data and spectral break are consistent with a phenomenon known as synchrotron radiation, created as relativistic charged particles (i.e., electrons) move through a strong magnetic field. This is naturally expected from astrophysical jets, though the leading jetted-TDE models had predicted it to be subdominant to the up-scattered emission in jetted-TDEs. Modeling the X-ray data, Dr. Yao and her team were able to constrain the properties of the jet and determine what part of the jet is dominating its X-ray emission. They find that the jet is likely to be starved of protons, and instead is dominated by electrons moving in a highly magnetized jet.

AT2022cmc represents a significant leap in our understanding of relativistic jets in astrophysical phenomena. “The NuSTAR data challenge existing models and suggest that magnetic reconnection plays a key role in accelerating particles within these jets,” noted Dr. Yao. This result not only sheds light on the inner workings of TDEs but also has broader implications for understanding relativistic jets in other high-energy astrophysical sources, such as gamma-ray bursts. Dr. Yao explained, “overall, this work contributes to the ongoing quest to decipher the composition and acceleration mechanisms of relativistic jets in the Universe.”


Thursday, August 22, 2024

Astronomers explore the properties of quasar 1604+159

Quasar 1604+159: distribution of fractional polarization (color) at 1.7 GHz
Credit: Hu et al., 2024.


Chinese astronomers have conducted multi-frequency polarimetric observations of a quasar known as 1604+159. Results of the observational campaign, published August 13 on the pre-print server arXiv, shed more light on the properties of this quasar, including its morphology and magnetic field.

Quasars, or quasi-stellar objects (QSOs) are active galactic nuclei (AGN) of very high luminosity, emitting electromagnetic radiation observable in radio, infrared, visible, ultraviolet and X-ray wavelengths.

They are among the brightest and most distant objects in the known universe, and serve as fundamental tools for numerous studies in astrophysics as well as cosmology. For instance, quasars have been used to investigate the large-scale structure of the universe and the era of reionization. They also improved our understanding of the dynamics of supermassive black holes and the intergalactic medium.

At a redshift of approximately 0.5, 1604+159 is a low-spectral peaked (LSP) quasar with a linear scale of 19,750 light years/arcsecond. Previous observations have found that it has flat radio spectral and low radio variability.

Aiming to get more insights into the properties of 1604+159, a team of astronomers led by Xu-Zhi Hu of Shanghai Astronomical Observatory in China, has observed this quasar with the American Very Long Baseline Array (VLBA) and the Very Large Array (VLA).

"This work contains one observation with the Very Long Baseline Array and three observations with the Very Large Array, all in dual-polarization mode," the researchers explained.

The observations show that 1604+159 has several lobes and bulges, which together form a cocoon shape. Moreover, the images show several bulges surrounding the core, jets, and hotspots are towards the quasar's edges. The largest structure detected reaches about 50 arcseconds.

According to the paper, 1604+159 has a global helical magnetic field extending from the jet base to the outer jet region. The helical magnetic field has a large intrinsic pitch angle, of about 80 degrees, in the jet rest frame.

The study detected polarization at the core of 1604+159. This polarization appears to be normal to the edges of the structure. However, the fractional polarization turned up to be relatively high—about 60%. This is approximately 15% higher than that of the core.

The observations found that the jet of the quasar generally propagates in a collimating structure with several slight bends. As it bends, the jet shows strong polarized intensity and high fractional polarization towards the bending edge.

The authors of the paper conclude that the results suggest that it may be in the stage when the cocoon expands. Due to this, shocks, formed during the expansion, heat the interstellar medium, contributing to the jet-driven AGN feedback.

by Tomasz Nowakowski , Phys.org


More information: Xu-Zhi Hu et al, Magnetic Field of the Quasar 1604+159 from Parsec to Kilo-parsec Scale, arXiv (2024). DOI: 10.48550/arxiv.2408.06647

Journal information: arXiv

© 2024 Science X Network


Explore further


Wednesday, August 21, 2024

The Evolution of the Trappist-1 Planetary System

This video shows the distances between the planets in the Trappist-1 system (labeled b-h) and their orbital frequencies, showing where and when various planets' orbits come into brief alignment with one another. Credit: Gabriele Pichierri

All seven planets discovered in orbit around the red dwarf star TRAPPIST-1 could easily fit inside the orbit of Mercury, the innermost planet of our solar system. In fact, they would have room to spare. TRAPPIST-1 also is only a fraction of the size of our sun; it isn't much larger than Jupiter. So, the TRAPPIST-1 system's proportions look more like Jupiter and its moons than those of our solar system. Credit: NASA/JPL-Caltech/R. Hurt, T. Pyle (IPAC)


Planets are bodies that orbit a star and have sufficient gravitational mass that they form themselves into roughly spherical shapes that, in turn, exert gravitational force on smaller objects around them, such as asteroids and moons. For most of human history, the only planets our ancestors knew of were those they could see in the night sky. But in the last 30 years, telescopes sensitive enough to infer the presence of exoplanets—planets outside our own solar system—have been developed.

Exoplanets are, of course, much more difficult to directly observe than stars and galaxies. Almost all exoplanet discoveries, particularly starting around 2010, have been based on photometric measurements (the amount of light received) of the exoplanets' host stars, rather than of the planets themselves. This is called the transit method. Now, with the help of the Spitzer Space Telescope, which made its own first exoplanet detection in 2005; the Kepler/KW Space Telescope, specifically designed to search for exoplanets; and the James Webb Space Telescope, launched in 2021, the transit method and other techniques have confirmed the existence of more than 5,000 exoplanets inhabiting thousands of star systems

"When we had only our own solar system to analyze, one could just assume that the planets formed in the places where we find them today," says Gabriele Pichierri, postdoctoral scholar research associate in planetary science at Caltech, working in the group of Professor of Planetary Science Konstantin Batygin. "However, when we discovered even the first exoplanet in 1995, we had to reconsider this assumption. We are developing better models for how planets are formed and how they come to be in the orientations we find them in."

Most exoplanets form out of the disc of gas and dust around newly formed stars and are then expected to migrate inward approaching the inner boundary of this disc. This assembles planetary systems that are much closer to the host star than is the case in our own solar system.

In the absence of other factors, planets will tend to space themselves apart from one another at characteristic distances based on their masses and gravitational forces between the planets and their host star. "This is the standard migration process," Pichierri explains. "The positions of the planets form resonances between their orbital periods. If you take the orbital period of one planet and then you divide it by the orbital period of its neighboring planet, you get a ratio of simple integers, such as 3:2." So, for example, if one planet takes two days to orbit around its star, the next planet, farther out, will take three days. If that second planet and a third one farther out are also in a 3:2 resonance, then the third planet's orbital period will be 4.5 days.

Trappist-1 system, which hosts seven planets and is located about 40 light-years from Earth, is a special one for multiple reasons. "The outer planets behave properly, so to speak, with the simpler expected resonances," Pichierri says. "But the inner ones have resonances that are a bit spicier." The ratio between planet b and c's orbits is 8:5, for example, and that between c and d is 5:3. "This narrow discrepancy in the outcome of Trappist-1's assembly is puzzling and represents a wonderful opportunity to figure out in detail what other processes were at play in its assembly," he says.

"In addition, most planetary systems are thought to have started in these resonant states but have encountered significant instabilities in their lifespan before we observe them today," Pichierri explains. "Most planets go unstable or collide with one another, and everything gets shuffled. Our own solar system, for example, was affected by such an instability. But we know of a few systems that have remained stable, that are more or less pristine specimens. They, in effect, exhibit a record of their entire dynamical history that we can then attempt to reconstruct. Trappist-1 is one of these."

The challenge then was to develop a model that could explain the orbits of the Trappist-1 planets and how they reached their current configuration.

The resulting model suggests that the inner four planets initially evolved alone in the expected 3:2 resonance chain. It was only as the disc's inner boundary expanded outward that their orbits relaxed out of the tighter 3:2 chain into the configuration we observe today. The fourth planet, which originally sat on the inner boundary of the disc, moving farther out along with it, was later pushed back inward when three additional outer planets joined the planetary system at a later stage.

"By looking at Trappist-1, we have been able to test exciting new hypotheses for the evolution of planetary systems," Pichierri says. "Trappist-1 is very interesting because it is so intricate; it's a long planetary chain. And it's a great exemplar for testing alternative theories about planetary system formation."

The paper containing this research, titled "Forming the Trappist-1 system in two steps during the recession of the disc inner edge," is published in Nature Astronomy. Authors are Pichierri; Alessandro Morbidelli of the Observatoire de la Cote d'Azur, formerly a Moore Distinguished Scholar at Caltech; Konstantin Batygin (PhD '12) of Caltech; and Ramon Brasser of the University of Oslo. This work was supported by the European Research Council, the Barr Foundation, the David and Lucile Packard Foundation, the National Science Foundation, and the Research Council of Norway.

Written by Cynthia Eller

Source: Caltech/News

Contact:

Cynthia Eller
celler@caltech.edu


Tuesday, August 20, 2024

A super(nova) spiral

 A spiral galaxy with two broad spiral arms wrapping around a large central region, which has a glowing white bar in the very centre. Thin strands of dark dust lie over much of the galaxy. The arms have small and large patches of glowing blue light, emitted by new stars. The galaxy is on a dark background. In the foreground, bright stars with four points are dotted around. Credit: ESA/Hubble & NASA, C. Kilpatrick

Resting near the centre of the northerly constellation Cepheus, high in the northern sky, is the barred spiral galaxy UGC 11861, the subject of the latest Hubble Picture of the Week.

UGC 11861 is located 69 million light-years away from Earth — which may seem a vast distance, but it’s just right for Hubble to grab this majestic shot of the galaxy’s spiral arms and the short but brightly glowing bar in its centre. Among the cloudy gases and the dark wisps of dust, this galaxy is actively forming new stars, visible in the glowing blue patches in its outer arms.

This activity has resulted in three supernova explosions being spotted in and nearby UGC 11861, in 1995, 1997 and 2011. The earlier two were both Type II supernovae, a kind which results from the collapse of a massive star at the end of its life. This Hubble image was made from data collected to study Type II supernovae and their environments.

Monday, August 19, 2024

Queen Berenice II’s Hair Tied Together by Dark Matter


PR Image noirlab2420b
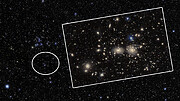
Coma Cluster (uncropped view)


Videos

Cosmoview Episode 85: Queen Berenice II’s Hair Tied Together by Dark Matter
PR Video noirlab2420a
Cosmoview Episode 85: Queen Berenice II’s Hair Tied Together by Dark Matter

Zooming into the Coma Cluster
PR Video noirlab2420b
Zooming into the Coma Cluster

Pan on the Coma Cluster
PR Video noirlab2420c
Pan on the Coma Cluster

Cosmoview Episodio 85: Cerro Tololo captura deslumbrante cúmulo galáctico en Chile
PR Video noirlab2420d
Cosmoview Episodio 85: Cerro Tololo captura deslumbrante cúmulo galáctico en Chile


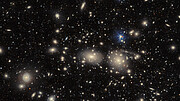
The Dark Energy Camera probes the Coma Cluster, a rich cluster of galaxies named for the hair of an ancient queen and an inspiration for the theory of dark matter

The Dark Energy Camera captures an image of the dazzling Coma Cluster, named after the hair of Queen Berenice II of Egypt. Not only significant in Greek mythology, this collection of galaxies was also fundamental to the discovery of the existence of dark matter. The theory emerged in 1937 when Swiss astronomer Fritz Zwicky noticed that the Coma Cluster galaxies behaved as if they were under the influence of vast amounts of unobservable ‘dark’ matter.

This densely populated image showcases an enormous cluster not of individual stars, but of entire galaxies, known as the Coma Cluster. The Coma Cluster is named for the constellation in which it lies, Coma Berenices. It is the only one of the 88 IAU constellations [1] to be named after a historical figure. Its namesake is Queen Berenice II of Egypt, or more precisely her hair, with ‘coma’ meaning ‘hair of the head’ in Latin.

Berenice famously cut her hair off and presented it as a votive offering to the gods when her husband returned safely from war. The hair was placed in a temple, but went missing soon after. The court astronomer, Conon of Samos, claimed to identify Berenice’s lost tresses in a rather unlikely spot — the night sky — suggesting that the goddess Aphrodites had catasterized (literally turned into a constellation) the queen’s locks. This all took place around 245 BCE, meaning that Berenice’s hair has enjoyed celestial recognition for an extraordinarily long time.

The data used to build this detailed picture were collected by the Department of Energy-fabricated Dark Energy Camera (DECam), which is mounted on the U.S. National Science Foundation Víctor M. Blanco 4-meter Telescope at Cerro Tololo Inter-American Observatory, a Program of NSF NOIRLab. The 570-megapixel camera was built to carry out the Dark Energy Survey (DES) — an amazing 758-night run of observations between 2013 and 2019. DES was conducted with the intention to better understand the nature of dark energy — the unknown entity that is causing the expansion of our Universe to accelerate.

The Coma Cluster is closely associated with dark energy’s equally mysterious counterpart: dark matter. Nearly a century ago, in 1937, Swiss astronomer Fritz Zwicky observed several galaxies within the Coma Cluster. He calculated an approximation of the cluster’s mass based on its luminous — in other words, observable — structures. But he encountered something strange: the cluster seemed to be missing mass. In fact, the galaxies within the cluster were behaving as though the cluster contained 400 times more mass than his estimates suggested.

Zwicky reached this conclusion by observing how fast the galaxies within the cluster were moving. To explain this further, it is helpful to briefly revisit a key point about the nature of gravity. Gravity is one of the four known fundamental interactions that exist between all entities with energy or mass. The more mass that an object has, the stronger the gravitational pull it will exert. Therefore, less massive objects that are within a certain distance to a more massive object will be pulled uncontrollably towards it.

However, there is an additional factor to consider: velocity. If an object is moving fast enough, it can escape the gravitational pull of other objects. It is this principle that enabled Zwicky to infer that the Coma Cluster appeared to be ‘missing’ matter. He found that the galaxies were moving so fast that they should be escaping the cluster if it were being held together only by the observable mass. This led him to postulate that the cluster must be held together by vast amounts of unobservable ‘dark’ matter, though this suggestion seemed far-fetched to much of the astronomical community.

It took until the 1980s for the majority of astronomers to be convinced of the existence of dark matter. The consensus moved as several studies came out reporting the same curious mass inconsistency that Zwicky observed, but on the scale of single galaxies rather than entire galaxy clusters. One such study was done in 1970 by U.S. astronomers Kent Ford and Vera C. Rubin, who found evidence of invisible matter in the Andromeda Galaxy. And in 1979, astronomers Sandra Faber and John Gallagher performed a robust analysis of the mass-to-light ratio for over 50 spiral and elliptical galaxies, which led them to conclude that, “the case for invisible mass in the Universe is very strong and getting stronger.”

The existence of dark matter and dark energy is now widely accepted, and understanding their elusive nature is a main focus of modern astrophysics. A deeper understanding may be on the horizon with the upcoming 10-year Legacy Survey of Space and Time, which will be conducted by NSF–DOE Vera C. Rubin Observatory, named after the inspirational female astronomer who helped show the world that there is so much more to the Universe than meets the eye.


Notes

[1] It is worth nothing that the 88 IAU constellations are just some of the imagined figures and shapes derived from the patterns of stars in the observable sky. Many more were invented by cultures throughout history.


More information

NSF NOIRLab (U.S. National Science Foundation National Optical-Infrared Astronomy Research Laboratory), the U.S. center for ground-based optical-infrared astronomy, operates the International Gemini Observatory (a facility of NSF, NRC–Canada, ANID–Chile, MCTIC–Brazil, MINCyT–Argentina, and KASI–Republic of Korea), Kitt Peak National Observatory (KPNO), Cerro Tololo Inter-American Observatory (CTIO), the Community Science and Data Center (CSDC), and NSF-DOE Vera C. Rubin Observatory (operated in cooperation with the Department of Energy’s SLAC National Accelerator Laboratory). It is managed by the Association of Universities for Research in Astronomy (AURA) under a cooperative agreement with NSF and is headquartered in Tucson, Arizona. The astronomical community is honored to have the opportunity to conduct astronomical research on I’oligam Du’ag (Kitt Peak) in Arizona, on Maunakea in Hawai‘i, and on Cerro Tololo and Cerro Pachón in Chile. We recognize and acknowledge the very significant cultural role and reverence that these sites have to the Tohono O’odham Nation, to the Native Hawaiian community, and to the local communities in Chile, respectively.


Links:


Contacts:

Josie Fenske
Jr. Public Information Officer
NSF NOIRLab
Email:
josie.fenske@noirlab.edu


Sunday, August 18, 2024

Whale Galaxy (NGC 4631) and Hockey Stick Galaxy (NGC 4656)

Whale Galaxy (NGC 4631) and Hockey Stick Galaxy (NGC 4656)

The Whale Galaxy, located in the Canes Venatici constellation, is a spiral galaxy smaller than the Milky Way and Andromeda Galaxy. The shapes of this galaxy and the Hockey Stick Galaxy, seen in the lower left from the Whale Galaxy, are distorted, indicating that the two galaxies are gravitationally interacting. These two galaxies are likely to merge into a larger galaxy. The Subaru Telescope’s Hyper Suprime-Cam (HSC), the ultra-wide field-of-view camera, successfully observed the two galaxies in one shot.
(Credit: Tohoku University/NAOJ). High Res.( 8.34 MB)

Distance from Earth: About 25 million light-years
Instrument: Hyper Suprime-Cam (HSC)

Relevant Links:


Saturday, August 17, 2024

A 5D Map of the Milky Way


Ready to be mesmerized by an elegant data visualization? You can now watch the endless, swirling trajectories of 170 million stars in our galaxy using a simple interactive tool. A team led by Joshua Speagle (沈佳士) from the University of Toronto used data from five surveys — the Panoramic Survey Telescope and Rapid Response System (Pan-STARRS), the Two Micron All Sky Survey (2MASS), the United Kingdom Infrared Telescope Infrared Deep Sky Survey (UKIDSS), the “unofficial” Wide-field Infrared Survey Explorer (unWISE), and the Gaia survey — to craft this visualization. In the image above, the color scale shows the tangential speed of stars within a certain distance bin, while the white streamlines show the stars’ tangential velocity. You can play around with the full visualization, which allows you to filter by distance and switch the color overlay between velocity, density, metallicity, and age. To learn more about the data selection process and the construction of the final star catalog, be sure to check out the full research article linked below.

By Kerry Hensley

Citation

“Mapping the Milky Way in 5D with 170 Million Stars,” Joshua S. Speagle et al 2024 ApJ 970 121. doi:10.3847/1538-4357/ad2b62

Friday, August 16, 2024

NASA Telescopes Work Out Black Hole's Snack Schedule

AT2018fyk
Credit Illustration: NASA/CXC/M. Weiss; Image: X-ray: NASA/SAO/Kavli Inst. at MIT/D.R. Pasham;
Optical: NSF/Legacy Survey/SDSS


By using new data from NASA’s Chandra X-ray Observatory and Neil Gehrels Swift Observatory as well as ESA’s XMM-Newton, a team of researchers have made important headway in understanding how — and when — a supermassive black hole obtains and then consumes material, as described in our latest press release.

This artist’s impression shows a star that has partially been disrupted by such a black hole in the system known as AT2018fyk. The supermassive black hole in AT2018fyk — with about 50 million times more mass than the sun — is in the center of a galaxy located about 860 million light-years from Earth.

Astronomers have determined that a star is on a highly elliptical orbit around the black hole in AT2018fyk so that its point of farthest approach from the black hole is much larger than its closest. During its closest approach, tidal forces from the black hole pull some material from the star, producing two tidal tails of “stellar debris”.

The illustration shows a point in the orbit soon after the star is partially destroyed, when the tidal tails are still in close proximity to the star. Later in the star's orbit, the disrupted material returns to the black hole and loses energy, leading to a large increase in X-ray brightness occurring later in the orbit (not shown here). This process repeats each time the star returns to its point of closest approach, which is approximately every 3.5 years. The illustration depicts the star during its second orbit, and the disk of X-ray emitting gas around the black hole that is produced as a byproduct of the first tidal encounter.

Researchers took note of AT2018fyk in 2018 when the optical ground-based survey ASAS-SN detected that the system had become much brighter. After observing it with NASA’s NICER and Chandra, and XMM-Newton, researchers determined that the surge in brightness came from a “tidal disruption event,” or TDE, which signals that a star was completely torn apart and partially ingested after flying too close to a black hole. Chandra data of AT2018fyk is shown in the inset of an optical image of a wider field-of-view.

X-ray and optical image of AT2018fyk
Credit: X-ray: NASA/SAO/Kavli Inst. at MIT/D.R. Pasham; Optical: NSF/Legacy Survey/SDSS

When material from the destroyed star approached close to the black hole, it got hotter and produced X-ray and ultraviolet (UV) light. These signals then faded, agreeing with the idea that nothing was left of the star for the black hole to digest.

However, about two years later, the X-ray and UV light from the galaxy got much brighter again. This meant, according to astronomers, that the star likely survived the initial gravitational grab by the black hole and then entered a highly elliptical orbit with the black hole. During its second close approach to the black hole, more material was pulled off and produced more X-ray and UV light.

Based on what they had learned about the star and its orbit, a team of astronomers predicted that the black hole’s second meal would end in August 2023 and applied for Chandra observing time to check. Chandra observations on August 14, 2023, indeed showed the telltale sign of the black hole feeding coming to an end with a sudden drop in X-rays. The researchers also obtained a better estimate of how long it takes the star to complete an orbit, and predicted future mealtimes for the black hole.

A paper describing these results appears in the August 14, 2024 issue of The Astrophysical Journal and is available online. The authors are Dheeraj Passam (Massachusetts Institute of Technology), Eric Coughlin (Syracuse University), Muryel Guolo (Johns Hopkins University), Thomas Wevers (Space Telescope Science Institute), Chris Nixon (University of Leeds, UK), Jason Hinkle (University of Hawaii at Manoa), and Ananaya Bandopadhyay (Syracuse).

NASA's Marshall Space Flight Center manages the Chandra program. The Smithsonian Astrophysical Observatory's Chandra X-ray Center controls science from Cambridge Massachusetts and flight operations from Burlington, Massachusetts.


Visual Description:

In this digital illustration, a star sheds stellar debris as it orbits a supermassive black hole. This artist’s impression represents the center of a galaxy about 860 million light-years from Earth.

The supermassive black hole sits at our upper left. It resembles an irregular, pitch-black sphere at the heart of an almond-shaped pocket of swirling sand and dirt. Though gritty in texture, the swirling brown and grey pocket is actually a disk of hot gas.

Near our lower right is the orbiting star. In this illustration, the star is relatively close to us, with the black hole far behind it. The star is a blue-white ball that, from this perspective, appears slightly larger than the distant black hole.

Two tapered streaks peel off of the glowing star like the pulled-back corners of a smile. These streaks represent tidal tails of stellar debris; material pulled from the surface of the star by the gravity of the black hole. This partial destruction of the star occurs every 3.5 years, when the star’s orbit brings it closest to the supermassive black hole.

During the orbit, the stellar debris from the tidal tails is ingested by the black hole. A byproduct of this digestion is the X-ray gas which swirls in a disk around the black hole.


Fast Facts for AT2018fyk:

Scale: Image is about 10 arcsec (42,000 light-years) across.
Category: Black Holes, Quasars & Active Galaxies
Coordinates (J2000): RA 22h 50m 16.1s | Dec -44° 51´ 53.5"
Constellation: Grus
Observation Dates: 2 observations, Oct 10-11, 2023
Observation Time: 14 hours 34 minutes
Obs. ID: 28294, 28972
Instrument: ACIS
References: Pasham, D. et al, 2024, ApJ Letters, Accepted. arXiv:2406.18124
Color Code: X-ray: purple; Optical: red, green, and blue
Distance Estimate: About 860 million light-years