Showing posts with label NASA's Chandra X-Ray Observatory. Show all posts

Saturday, March 08, 2025

X-ray Signal Points to Destroyed Planet, Chandra Finds

Helix Nebula
Credit: X-ray: NASA/CXC/SAO/Univ Mexico/S. Estrada-Dorado et al.; Ultraviolet: NASA/JPL; Optical: NASA/ESA/STScI (M. Meixner)/NRAO (T.A. Rector); Infrared: ESO/VISTA/J. Emerson; Image Processing: NASA/CXC/SAO/K. Arcand; Illustration: NASA/CXC/SAO/M. Weiss


A planet may have been destroyed by a white dwarf at the center of a planetary nebula — the first time this has been seen. As described in our latest press release, this would explain a mysterious X-ray signal that astronomers have detected from the Helix Nebula for over 40 years. The Helix is a planetary nebula, a late-stage star like our Sun that has shed its outer layers leaving a small dim star at its center called a white dwarf.

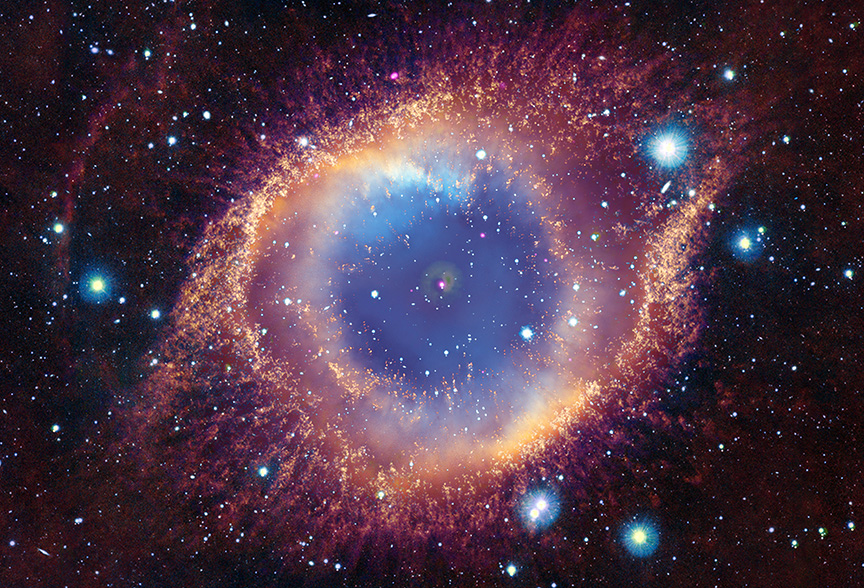
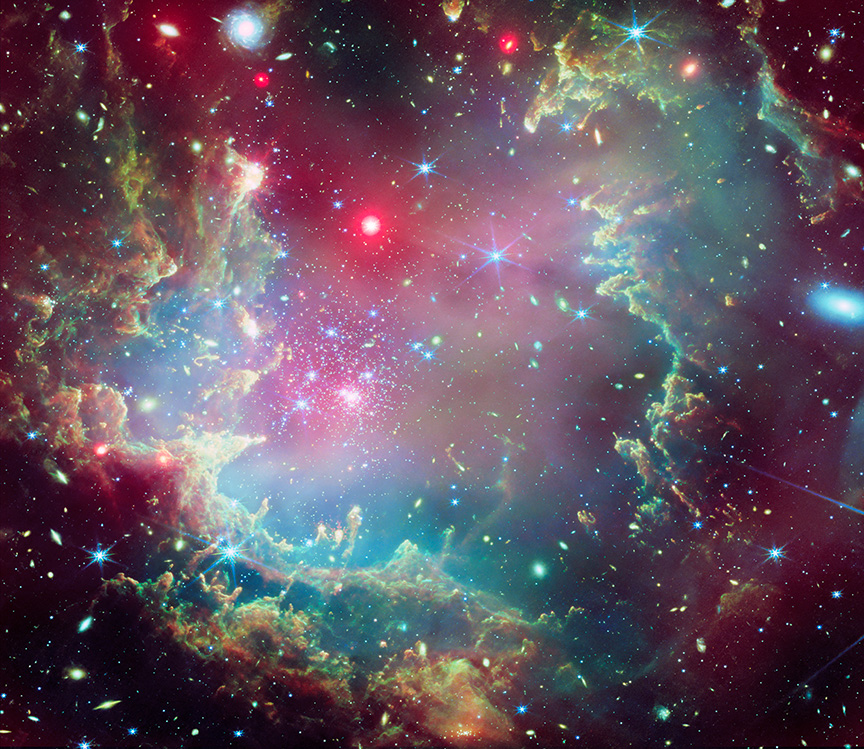
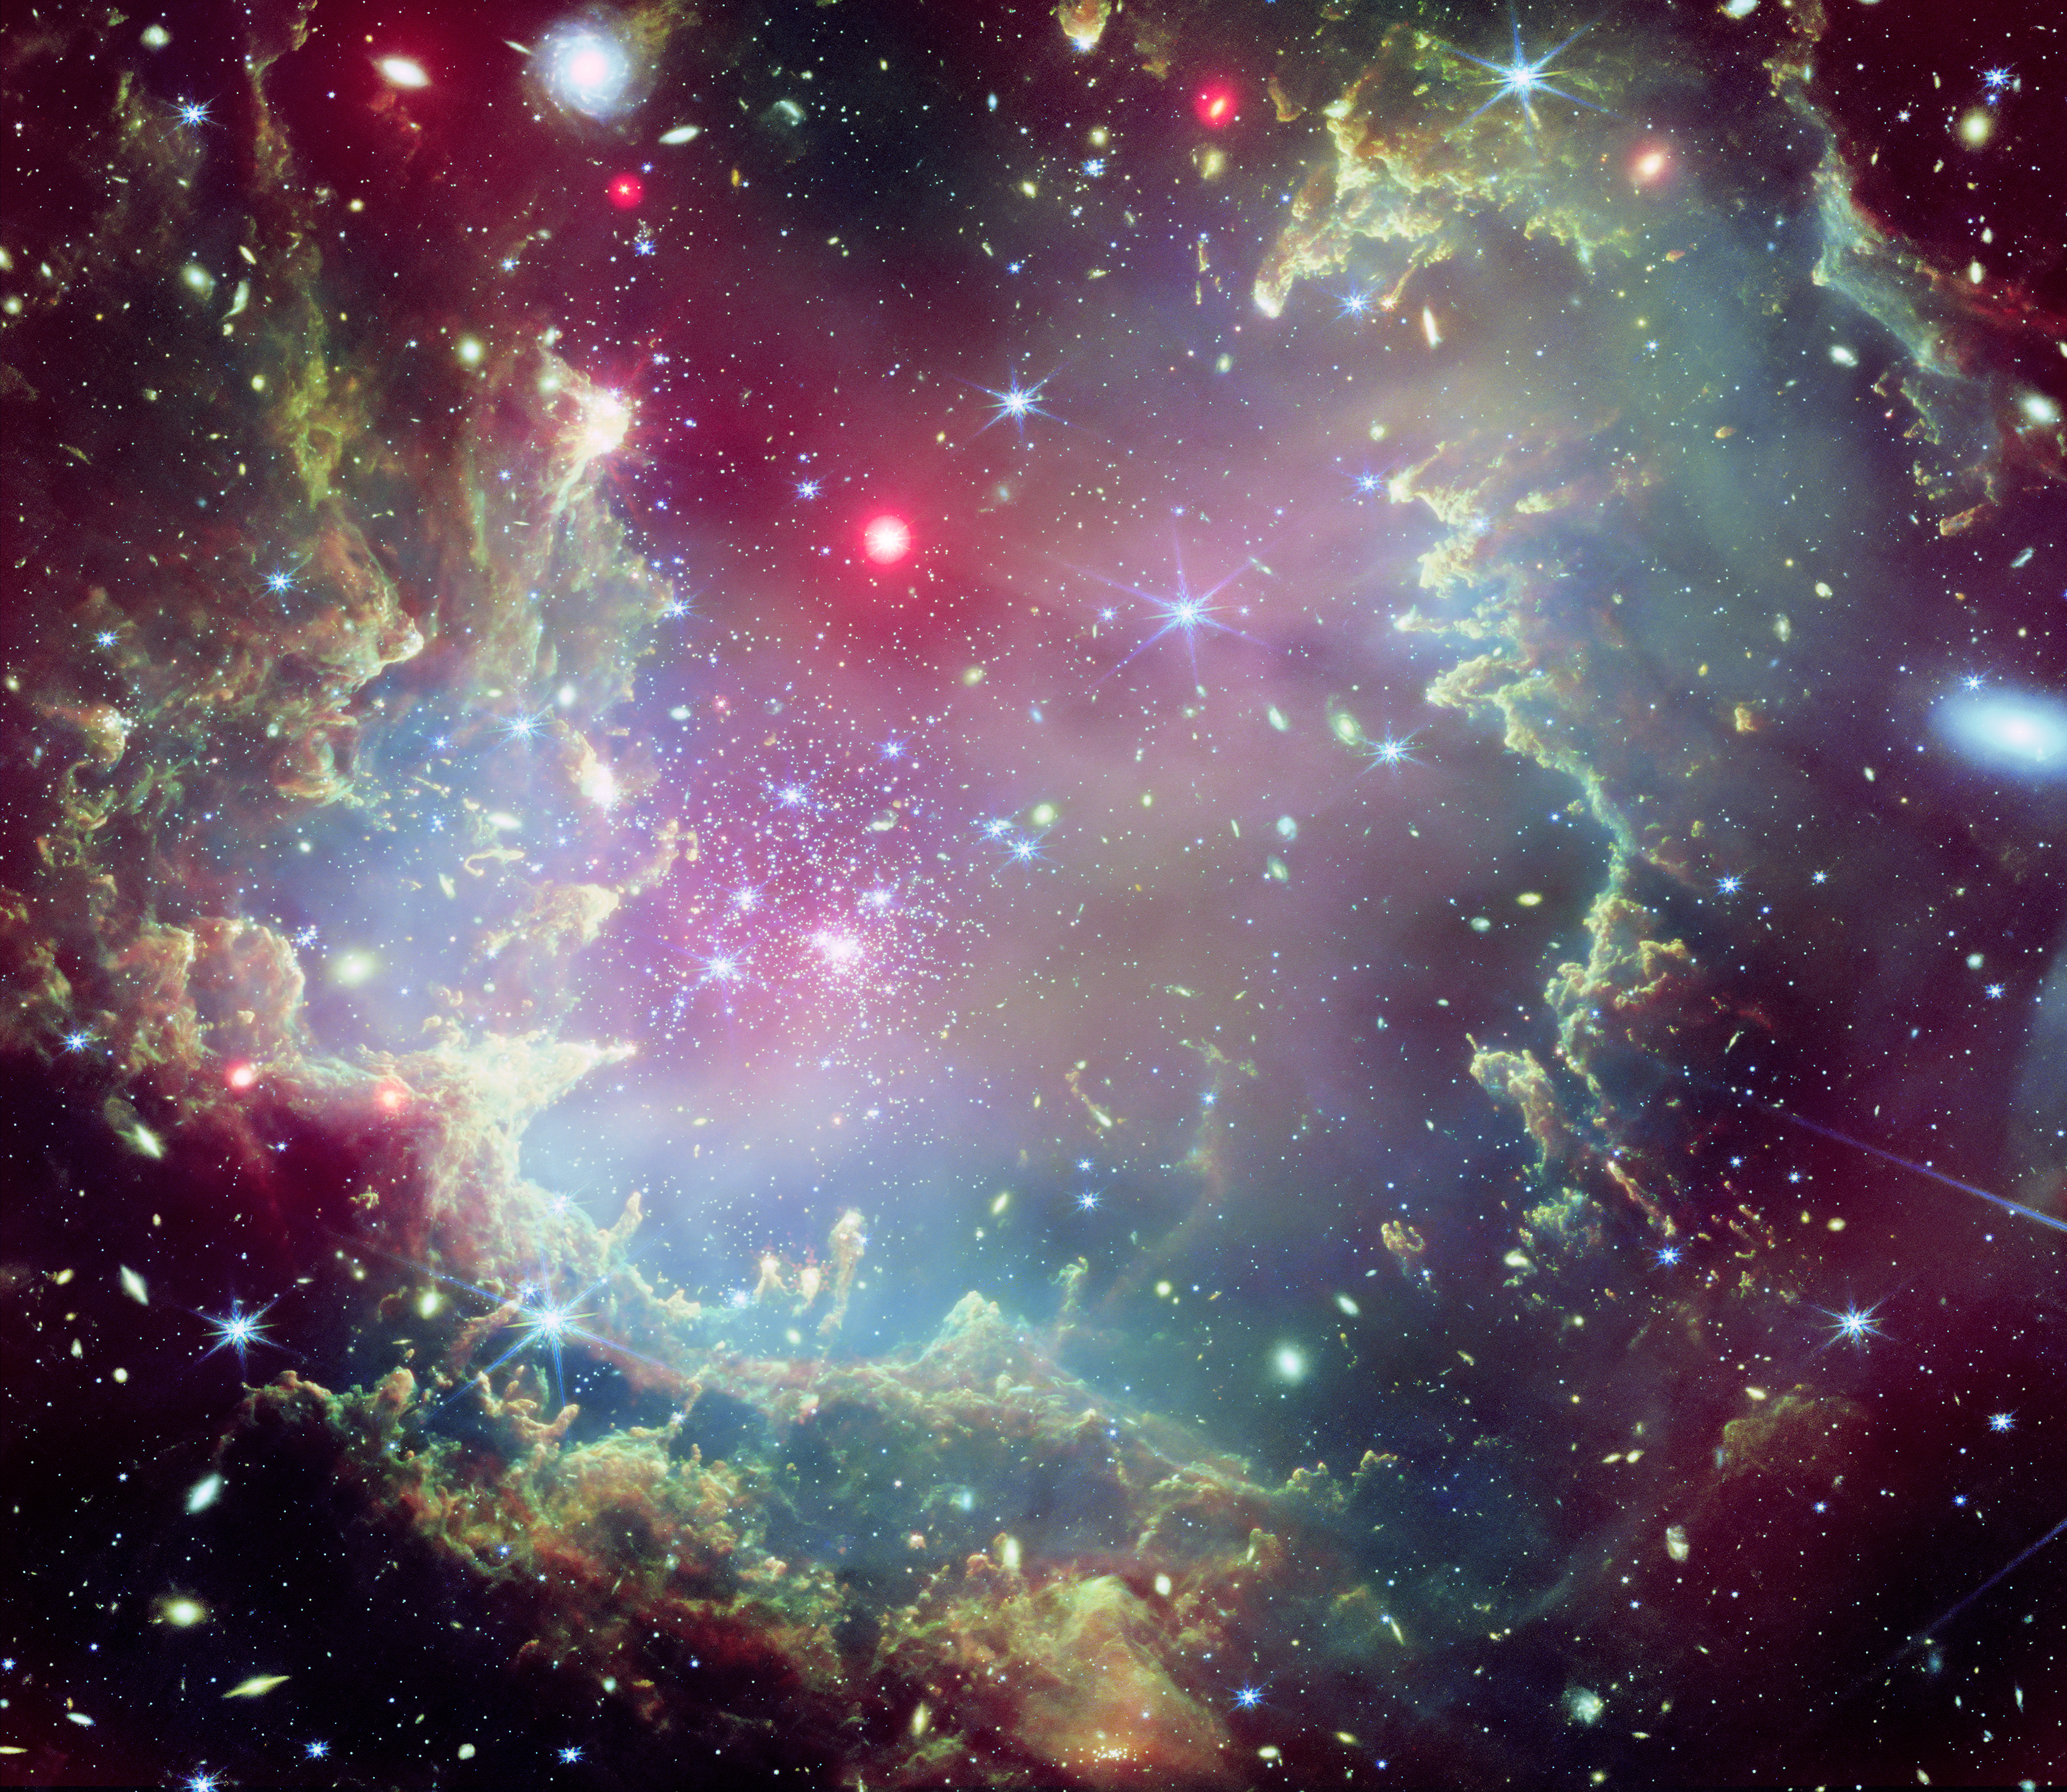
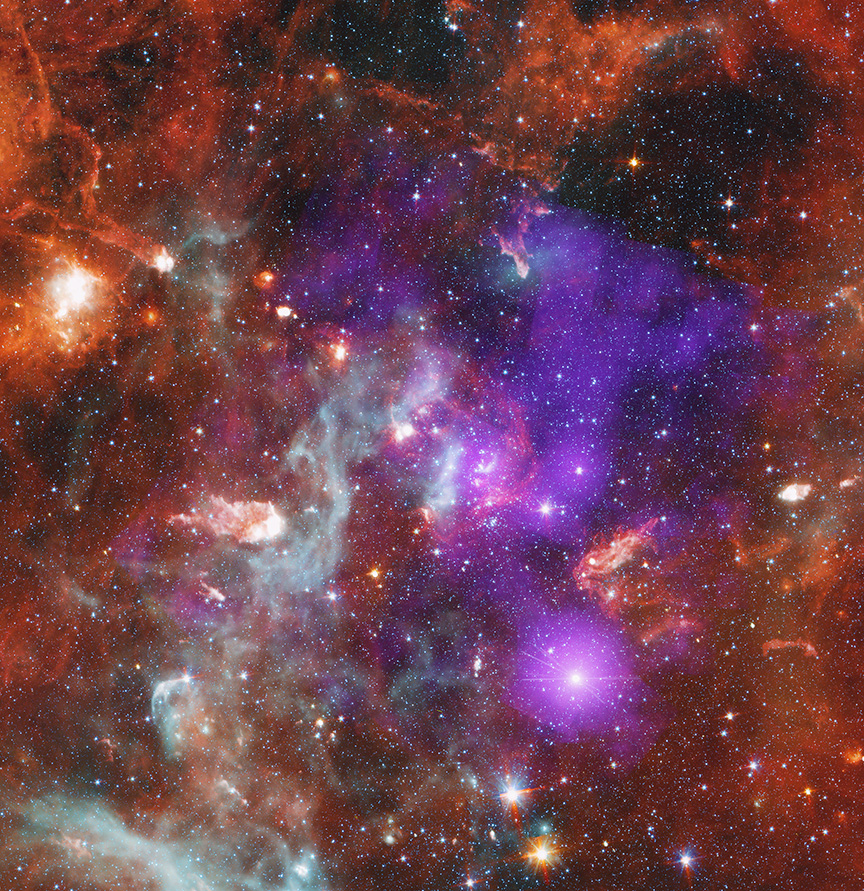
This composite image contains X-rays from Chandra (magenta), optical light data from Hubble (orange, light blue), infrared data from ESO (gold, dark blue), and ultraviolet data from GALEX (purple) of the Helix Nebula. Data from Chandra indicates that this white dwarf has destroyed a very closely orbiting planet.

Illustration of WD 2226-210:
This artist's impression shows a planet (left) that has approached too close to a white dwarf (right) and been torn apart by tidal forces from the star. The white dwarf is in the center of a planetary nebula depicted by the blue gas in the background. The planet is part of a planetary system, which includes one planet in the upper left and another in the lower right. The besieged planet could have initially been a considerable distance from the white dwarf but then migrated inwards by interacting with the gravity of other planets in the system. Credit:NASA/CXC/SAO/M. Weiss

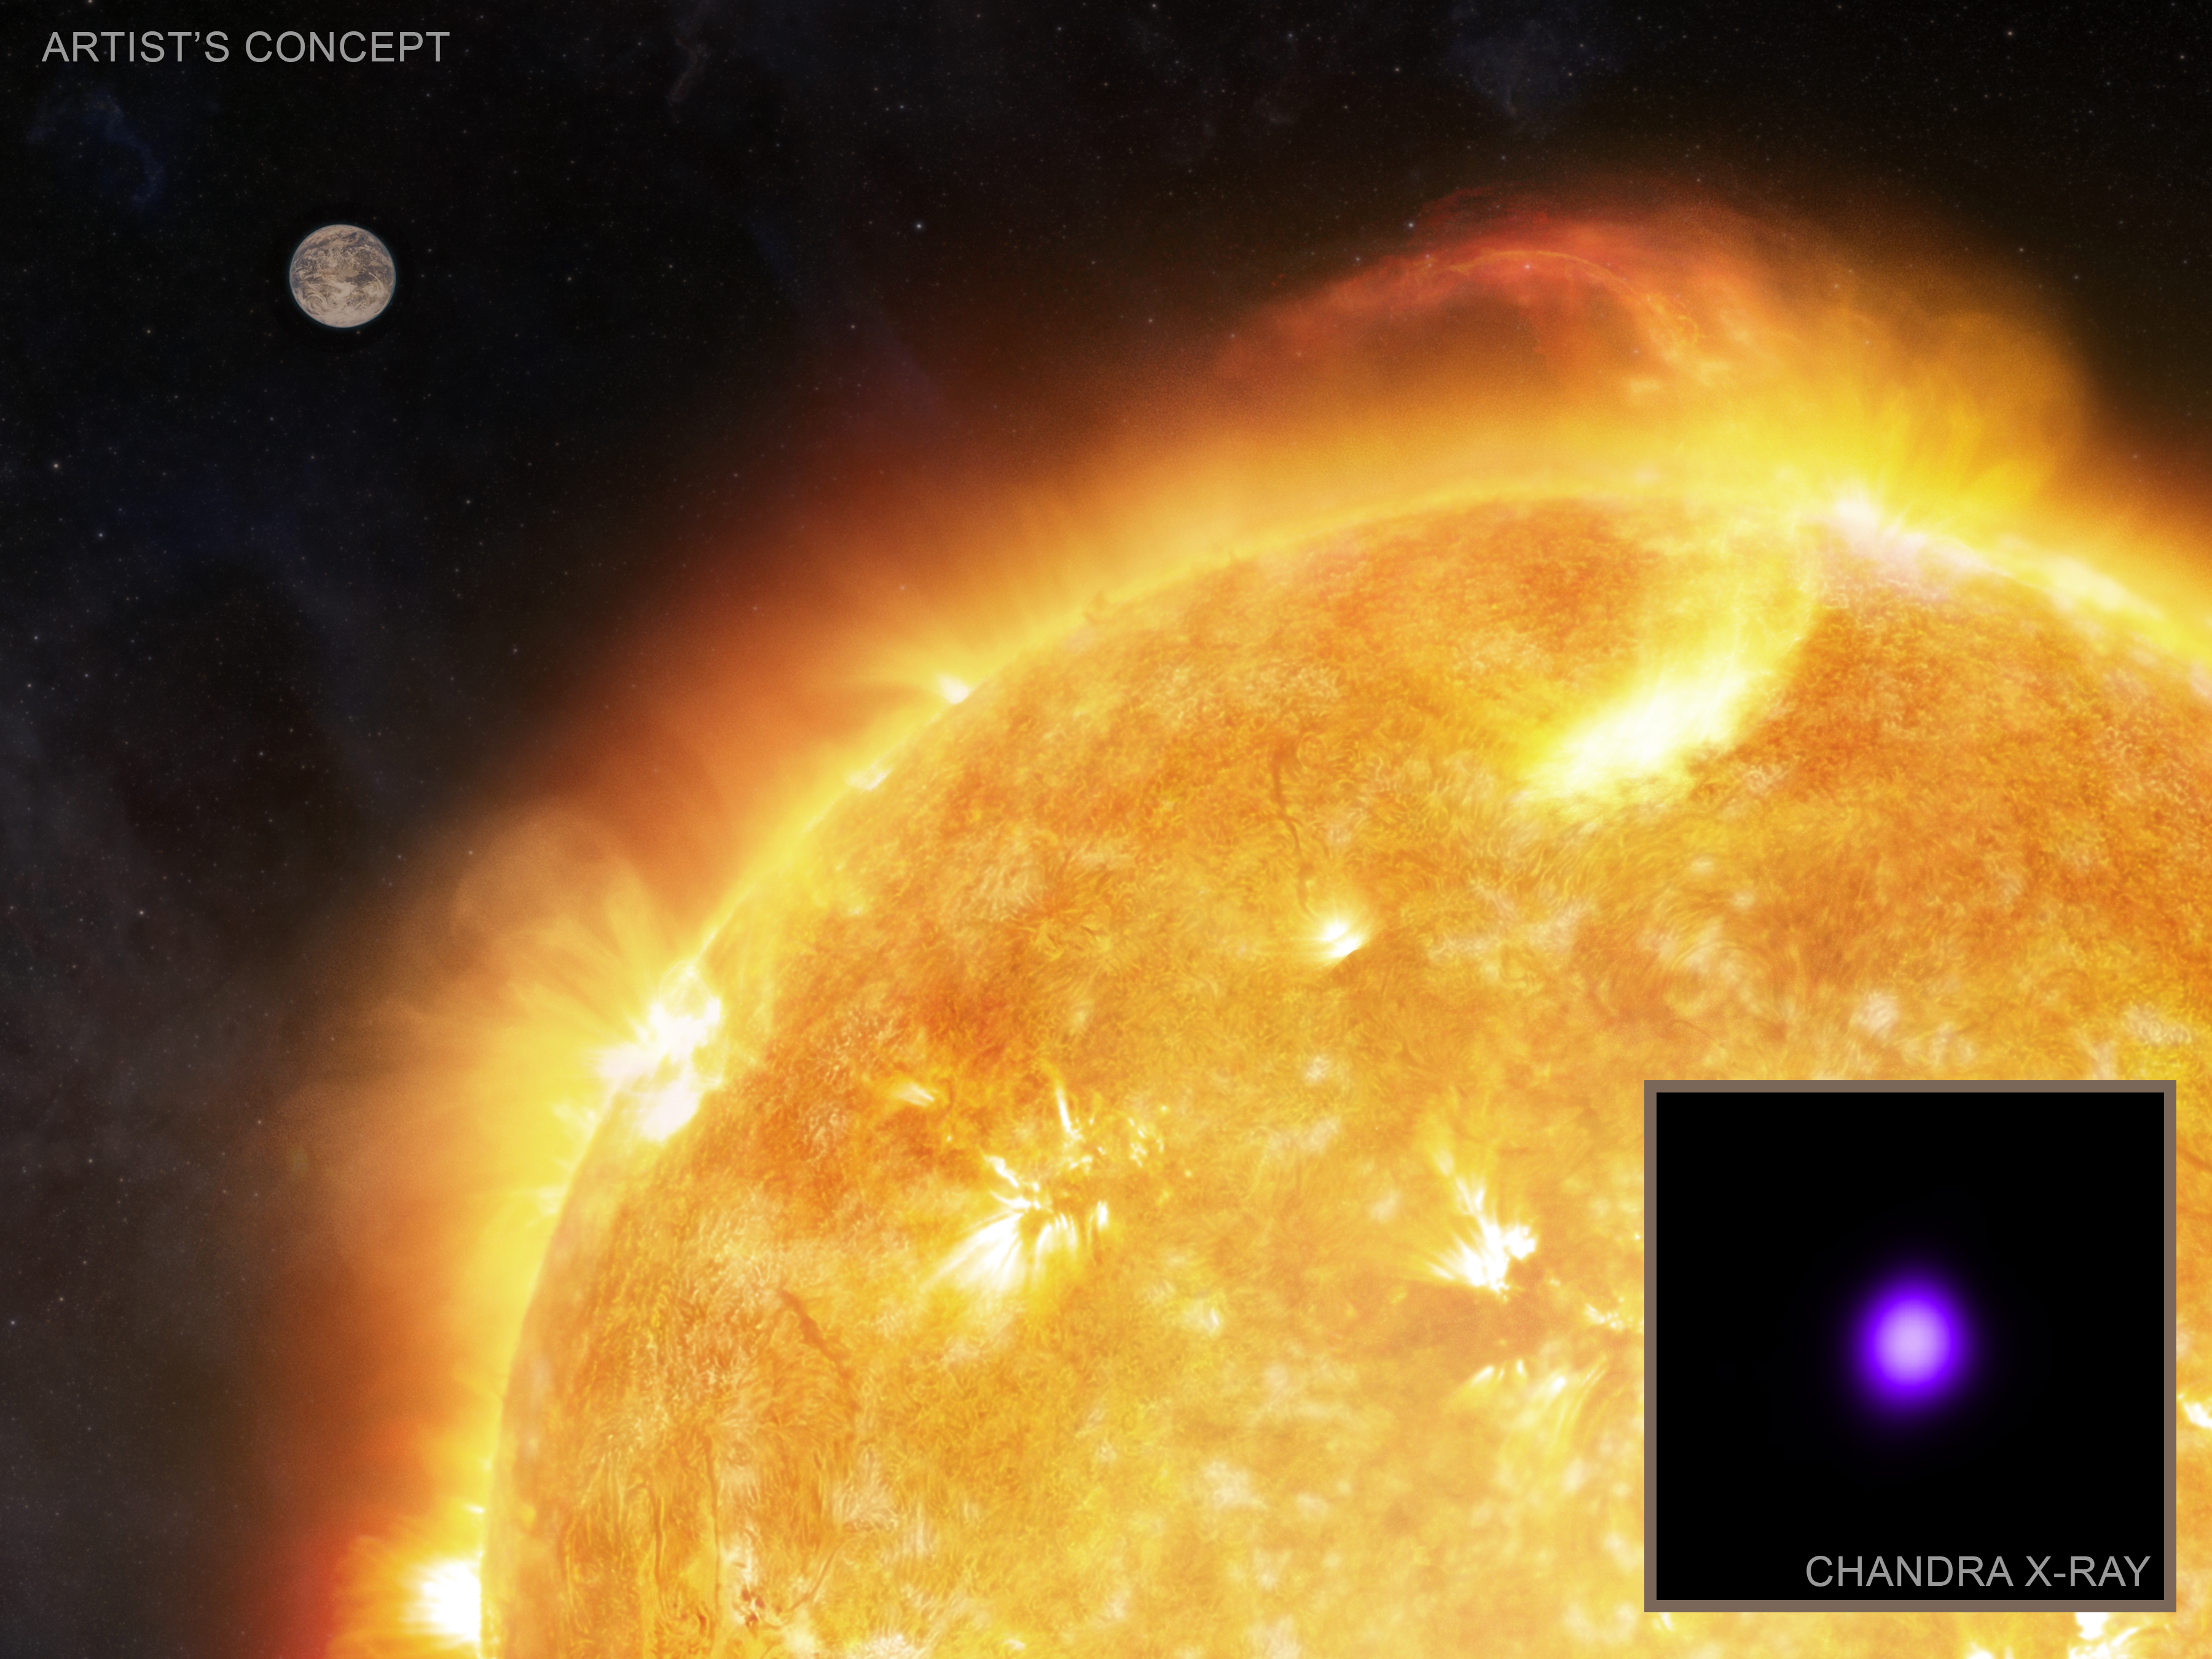
An artist’s concept shows a planet (left) that has approached too close to a white dwarf (right) and is being torn apart by tidal forces from the star. The white dwarf is in the center of a planetary nebula depicted by the blue gas in the background. The planet is part of a planetary system, which includes one planet in the upper left and another in the lower right. The besieged planet could have initially been a considerable distance from the white dwarf but then migrated inwards by interacting with the gravity of the other planets in the system.

Eventually debris from the planet will form a disk around the white dwarf and fall onto the star’s surface, creating the mysterious signal in X-rays that astronomers have detected for decades.

Dating back to 1980, X-ray missions, such as the Einstein Observatory and ROSAT telescope, have picked up an unusual reading from the center of the Helix Nebula. They detected highly energetic X-rays coming from the white dwarf at the center of the Helix Nebula named WD 2226-210, located only 650 light-years from Earth. White dwarfs like WD 2226-210 do not typically give off strong X-rays.

WD 2226-210 and the Helix Nebula (Labeled):
In about 5 billion years, our Sun will run out of fuel and expand, possibly engulfing Earth. These end stages of a star’s life can be utterly beautiful as is the case with this planetary nebula called the Helix Nebula. Credit: X-ray: NASA/CXC/SAO/Univ Mexico/S. Estrada-Dorado et al.; Ultraviolet: NASA/JPL; Optical: NASA/ESA/STScI (M. Meixner)/NRAO (T.A. Rector); Infrared: ESO/VISTA/J. Emerson; Image Processing: NASA/CXC/SAO/K. Arcand


A new study featuring the data from Chandra and XMM-Newton may finally have settled the question of what is causing these X-rays from WD 2226-210: this X-ray signal could be the debris from a destroyed planet being pulled onto the white dwarf. If confirmed, this would be the first case of a planet seen to be destroyed by the central star in a planetary nebula.

Observations by ROSAT, Chandra, and XMM-Newton between 1992 and 2002 show that the X-ray signal from the white dwarf has remained approximately constant in brightness during that time. The data, however, suggest there may be a subtle, regular change in the X-ray signal every 2.9 hours, providing evidence for the remains of a planet exceptionally close to the white dwarf.

Previously scientists determined that a Neptune-sized planet is in a very close orbit around the white dwarf — completing one revolution in less than three days. The researchers in this latest study conclude that there could have been a planet like Jupiter even closer to the star. The besieged planet could have initially been a considerable distance from the white dwarf but then migrated inwards by interacting with the gravity of other planets in the system. Once it approached close enough to the white dwarf the gravity of the star would have partially or completely torn the planet apart.

WD 2226-210 has some similarities in X-ray behavior to two other white dwarfs that are not inside planetary nebulas. One is possibly pulling material away from a planet companion, but in a more sedate fashion without the planet being quickly destroyed. The other white dwarf is likely dragging material from the vestiges of a planet onto its surface. These three white dwarfs may constitute a new class of variable, or changing, object.

A paper describing these results appears in The Monthly Notices of the Royal Astronomical Society and is available online. The authors of the paper are Sandino Estrada-Dorado (National Autonomous University of Mexico), Martin Guerrero (The Institute of Astrophysics of Andalusia in Spain), Jesús Toala (National Autonomous University of Mexico), Ricardo Maldonado (National Autonomous University of Mexico), Veronica Lora (National Autonomous University of Mexico), Diego Alejandro Vasquez-Torres (National Autonomous University of Mexico), and You-Hua Chu (Academia Sinica in Taiwan).

NASA's Marshall Space Flight Center manages the Chandra program. The Smithsonian Astrophysical Observatory's Chandra X-ray Center controls science operations from Cambridge, Massachusetts, and flight operations from Burlington, Massachusetts.


Visual Description:

This release features two images; a composite image of the Helix Nebula, and an artist's rendering of a planet's destruction, which may be occurring in the nebula's core.

The Helix Nebula is a cloud of gas ejected by a dying star, known as a white dwarf. In the composite image, the cloud of gas strongly resembles a creature's eye. Here, a hazy blue cloud is surrounded by misty, concentric rings of pale yellow, rose pink, and blood orange. Each ring appears dusted with flecks of gold, particularly the outer edges of the eye-shape.

The entire image is speckled with glowing dots in blues, whites, yellows, and purples. At the center of the hazy blue gas cloud, a box has been drawn around some of these dots including a bright white dot with a pink outer ring, and a smaller white dot. The scene which may be unfolding inside this box has been magnified in the artist's rendering.

The artist's digital rendering shows a possible cause of the large white dot with the pink outer ring. A brilliant white circle near our upper right shows a white dwarf, the ember of a dying star. At our lower left, in the relative foreground of the rendering, is what remains of a planet. Here, the planet resembles a giant boulder shedding thousands of smaller rocks. These rocks flow off the planet's surface, pulled back toward the white dwarf in a long, swooping tail. Glowing orange fault lines mar the surface of the crumbling planet. In our upper left and lower right, inside the hazy blue clouds which blanket the rendering, are two other, more distant planets. After the rocks from the planet start striking the surface of the white dwarf, X-rays should be produced.


Fast Facts for WD 2226-210, the central star in the Helix Nebula:

Scale: Image is about 25 arcmin (4.7 light-years) across.
Category: White Dwarfs & Planetary Nebulas
Coordinates (J2000): RA 22h 29m 38.6s | Dec -20° 50´ 13.6"
Constellation: Aquarius
Observation Dates: 2 observations Nov 17-18, 1999
Observation Time: 13 hours 15 minutes
Obs. ID: 631, 1480
Instrument: ACIS
References: S. Estrada-Dorado et al., 2025, MNRAS, 536, 2477; doi:10.1093/mnras/stae2733
Color Code: X-ray: magenta-purple; Ultraviolet: periwinkle-purple; Optical: orange and light blue; Infrared: yellow-gold and dark blue
Distance Estimate: About 650 light-years


Thursday, February 13, 2025

NASA Telescopes Deliver Stellar Bouquet in Time for Valentine's Day

30 Doradus
Credit X-ray: NASA/CXC/Penn State Univ./L. Townsley et al.; Infrared: NASA/JPL-CalTech/SST; Optical: NASA/STScI/HST; Radio: ESO/NAOJ/NRAO/ALMA; Image Processing: NASA/CXC/SAO/J. Schmidt, N. Wolk, K. Arcand


A bouquet of thousands of stars in bloom has arrived. This composite image contains the deepest X-ray image ever made of the spectacular star forming region called 30 Doradus.

By combining X-ray data from NASA’s Chandra X-ray Observatory (blue and green) with optical data from NASA’s Hubble Space Telescope (yellow) and radio data from the Atacama Large Millimeter/submillimeter Array (orange), this stellar arrangement comes alive.

30 Doradus Region (Labeled). Credit: X-ray: NASA/CXC/Penn State Univ./L. Townsley et al.; Infrared: NASA/JPL-CalTech/SST; Optical: NASA/STScI/HST; Radio: ESO/NAOJ/NRAO/ALMA; Image Processing: NASA/CXC/SAO/J. Schmidt, N. Wolk, K. Arcand)

Otherwise known as the Tarantula Nebula, 30 Dor is located about 160,000 light-years away in a small neighboring galaxy to the Milky Way known as the Large Magellanic Cloud (LMC). Because it one of the brightest and populated star-forming regions to Earth, 30 Dor is a frequent target for scientists trying to learn more about how stars are born.

With enough fuel to have powered the manufacturing of stars for at least 25 million years, 30 Dor is the most powerful stellar nursery in the local group of galaxies that includes the Milky Way, the LMC, and the Andromeda galaxy.

The massive young stars in 30 Dor send cosmically strong winds out into space. Along with the matter and energy ejected by stars that have previously exploded, these winds have carved out an eye-catching display of arcs, pillars, and bubbles.

A dense cluster in the center of 30 Dor contains the most massive stars astronomers have ever found, each only about one to two million years old. (Our Sun is over a thousand times older with an age of about 5 billion years.)

This new image includes the data from a large Chandra program that involved about 23 days of observing time, greatly exceeding the 1.3 days of observing that Chandra previously conducted on 30 Dor. The 3,615 X-ray sources detected by Chandra include a mixture of massive stars, double-star systems, bright stars that are still in the process of forming, and much smaller clusters of young stars.

There is a large quantity of diffuse, hot gas seen in X-rays, arising from different sources including the winds of massive stars and from the gas expelled by supernova explosions. This data set will be the best available for the foreseeable future for studying diffuse X-ray emission in star-forming regions.

The long observing time devoted to this cluster allows astronomers the ability to search for changes in the 30 Dor’s massive stars. Several of these stars are members of double star systems and their movements can be traced by the changes in X-ray brightness.

A paper describing these results appears in the July 2024 issue of The Astrophysical Journal Supplement Series. NASA's Marshall Space Flight Center manages the Chandra program. The Smithsonian Astrophysical Observatory's Chandra X-ray Center controls science operations from Cambridge, Massachusetts, and flight operations from Burlington, Massachusetts.


Visual Description:

This release features a highly detailed composite image of a star-forming region of space known as 30 Doradus, shaped like a bouquet, or a maple leaf.

30 Doradus is a powerful stellar nursery. In 23 days of observation, the Chandra X-ray telescope revealed thousands of distinct star systems. Chandra data also revealed a diffuse X-ray glow from winds blowing off giant stars, and X-ray gas expelled by exploding stars, or supernovas.

In this image, the X-ray wind and gas takes the shape of a massive purple and pink bouquet with an extended central flower, or perhaps a leaf from a maple tree. The hazy, mottled shape occupies much of the image, positioned just to our left of center, tilted slightly to our left. Inside the purple and pink gas and wind cloud are red and orange veins, and pockets of bright white light. The pockets of white light represent clusters of young stars. One cluster at the heart of 30 Doradus houses the most massive stars astronomers have ever found.

The hazy purple and pink bouquet is surrounded by glowing dots of green, white, orange, and red. A second mottled purple cloud shape, which resembles a ring of smoke, sits in our lower righthand corner.


Fast Facts for 30 Doradus:

Scale: Image is about 30 arcmin (1,400 light-years) across.
Category: Normal Stars & Star Clusters
Coordinates (J2000): RA 5h 38m 38s | Dec -69° 05´ 42"
Constellation: Dorado
Observation Dates: 54 observations from Sep 9, 1999 to Jan 22 2016
Observation Time: 541 hours (22 days 13 hours)
Obs. ID: 22, 5906, 7263, 7264, 2783, 16192-16203, 16442-16449, 16612, 16615-16617, 16621, 16640, 17321, 17414, 17486, 17544, 17545, 17555, 17561, 17562, 17602, 117603, 17640-17642, 17660, 18670-18672, 18706, 18720-18722, 18729, 18749, 18750
Instrument: ACIS
Also Known As: 30 Doradus
References: Townsley, L. et al, 2024, ApJS, 273, 5; arXiv:2403.16944
Color Code: X-ray: green, magenta, blue; Optical: dark yellow; Radio: orange; Infrared: red
Distance Estimate: About 160,000 light-years


Sunday, February 02, 2025

Black Holes Can Cook for Themselves, Chandra Study Shows

Perseus Cluster & the Centaurus Cluster
Credit: Perseus Cluster: X-ray: NASA/CXC/SAO/V. Olivares et al.; Optical/IR: DSS; H-alpha: CFHT/SITELLE; Centaurus Cluster: X-ray: NASA/CXC/SAO/V. Olivaresi et al.; Optical/IR: NASA/ESA/STScI; H-alpha: ESO/VLT/MUSE; Image Processing: NASA/CXC/SAO/N. Wolk


Astronomers have taken a crucial step in showing that the most massive black holes in the universe can create their own meals. Data from NASA’s Chandra X-ray Observatory and the Very Large Telescope (VLT) provide new evidence that outbursts from black holes can help cool down gas to feed themselves.

This study was based on observations of seven clusters of galaxies. The centers of galaxy clusters contain the universe’s most massive galaxies, which harbor huge black holes with masses ranging from millions to tens of billions of times that of the Sun. Jets from these black holes are driven by the black holes feasting on gas.

These images show two of the galaxy clusters in the study, the Perseus Cluster and the Centaurus Cluster. Chandra data represented in blue reveals X-rays from filaments of hot gas, and data from the VLT, an optical telescope in Chile, shows cooler filaments in red.

The results support a model where outbursts from the black holes trigger hot gas to cool and form narrow filaments of warm gas. Turbulence in the gas also plays an important role in this triggering process.

According to this model, some of the warm gas in these filaments should then flow into the centers of the galaxies to feed the black holes, causing an outburst. The outburst causes more gas to cool and feed the black holes, leading to further outbursts.

This model predicts there will be a relationship between the brightness of filaments of hot and warm gas in the centers of galaxy clusters. More specifically, in regions where the hot gas is brighter, the warm gas should also be brighter. The team of astronomers has, for the first time, discovered such a relationship, giving critical support for the model.

This result also provides new understanding of these gas-filled filaments, which are important not just for feeding black holes but also for causing new stars to form. This advance was made possible by an innovative technique that isolates the hot filaments in the Chandra X-ray data from other structures, including large cavities in the hot gas created by the black hole’s jets.

The newly found relationship for these filaments shows remarkable similarity to the one found in the tails of jellyfish galaxies, which have had gas stripped away from them as they travel through surrounding gas, forming long tails. This similarity reveals an unexpected cosmic connection between the two objects and implies a similar process is occurring in these objects.

This work was led by Valeria Olivares from the University of Santiago de Chile, and was published Monday in Nature Astronomy and is available online. The study brought together international experts in optical and X-ray observations and simulations from the United States, Chile, Australia, Canada, and Italy. The work relied on the capabilities of the MUSE (Multi Unit Spectroscopic Explorer) instrument on the VLT, which generates 3D views of the universe.

NASA's Marshall Space Flight Center in Huntsville, Alabama, manages the Chandra program. The Smithsonian Astrophysical Observatory's Chandra X-ray Center controls science operations from Cambridge, Massachusetts, and flight operations from Burlington, Massachusetts.


Visual Description:

This release features composite images shown side-by-side of two different galaxy clusters, each with a central black hole surrounded by patches and filaments of gas. The galaxy clusters, known as Perseus and Centaurus, are two of seven galaxy clusters observed as part of an international study led by the University of Santiago de Chile.

In each image, a patch of purple with neon pink veins floats in the blackness of space, surrounded by flecks of light. At the center of each patch is a glowing, bright white dot. The bright white dots are black holes. The purple patches represent hot X-ray gas, and the neon pink veins represent filaments of warm gas. According to the model published in the study, jets from the black holes impact the hot X-ray gas. This gas cools into warm filaments, with some warm gas flowing back into the black hole. The return flow of warm gas causes jets to again cool the hot gas, triggering the cycle once again.

While the images of the two galaxy clusters are broadly similar, there are significant visual differences. In the image of the Perseus Cluster on the left, the surrounding flecks of light are larger and brighter, making the individual galaxies they represent easier to discern. Here, the purple gas has a blue tint, and the hot pink filaments appear solid, as if rendered with quivering strokes of a paintbrush. In the image of the Centaurus Cluster on the right, the purple gas appears softer, with a more diffuse quality. The filaments are rendered in more detail, with feathery edges, and gradation in color ranging from pale pink to neon red.


Fast Facts for Perseus Cluster:

Credit: X-ray: NASA/CXC/SAO/V. Olivares et al.; Optical/IR: DSS; H-alpha: CFHT/SITELLE; Image Processing: NASA/CXC/SAO/N. Wolk
Scale: Image is about 6.4 arcmin (450,000 light-years) across.
Category: Groups and Clusters of Galaxies
Coordinates (J2000): RA 3h 19m 47.71 | Dec +41° 31´ 15.8"
Constellation: Perseus
Observation Dates: 29 observations between Sep 20, 1999 and Nov 7, 2016
Observation Time: 416 hours 45 minutes (17 days 8 hours 45 minutes)
Obs. ID: 428, 502, 503, 3209, 3404, 1513, 4289, 4946, 4947, 3939-4953, 6139, 6145, 6146, 11713-11716, 12025, 12033, 12036, 12037, 19568, 19913-19915

Instrument: ACIS
References: Olivares, V. et al. 2025, Nature Astronomy; arXiv:2501.01902
Color Code: X-ray: blue; Optical: red, green, blue; H-alpha: red
Distance Estimate: About 240 million light-years from Earth


Fast Facts for Centaurus Cluster:

Credit: X-ray: NASA/CXC/SAO/V. Olivaresi et al.; Optical/IR: NASA/ESA/STScI; H-alpha: ESO/VLT/MUSE; Image Processing: NASA/CXC/SAO/N. Wolk
Scale: Image is about 1.4 arcmin (57,000 light-years) across.
Category: Groups and Clusters of Galaxies
Coordinates (J2000): RA 12h 48m 49.2s | Dec -41° 18´ 43.8"
Constellation: Centaurus
Observation Dates: 16 observations from May 22, 2000 to Jun 05, 2014
Observation Time: 240 hours 1 minute (10 days 1 minutes)
Obs. ID: 504 ,505 ,1560 ,4190, 4191, 4954, 4955 ,5310, 16223-16225 ,16534 ,16607-16610
Instrument: ACIS
References: Olivares, V. et al. 2025, Nature Astronomy; arXiv:2501.01902
Color Code: X-ray: blue; Optical/IR: red, green, blue; H-alpha: red
Distance Estimate: About 145 million light-years from Earth


Monday, January 27, 2025

Exoplanets Need to be Prepared for Extreme Space Weather, Chandra Finds

Wolf 359
Credit: X-ray: NASA/CXC/SAO/S.Wolk, et al.; Illustration: NASA/CXC/SAO/M.Weiss; Image processing: NASA/CXC/SAO/N. Wolk


This artist’s illustration represents the results from a new study that examines the effects of X-ray and other high-energy radiation unleashed on potential exoplanets from a host star. As outlined in our latest press release, astronomers using NASA’s Chandra X-ray Observatory and ESA’s XMM-Newton observed Wolf 359, a red dwarf that is only 7.8 light-years from Earth, making it one of the closest stars to the Earth other than the Sun.

The artist’s rendering shows Wolf 359 in the foreground and a potential planet in orbit around it in the background. Red dwarfs are the most common type of star in the Universe. They are much smaller and dimmer than Sun-like stars, which allows them to last for trillions of years. This would give planets in orbit around them ample time for life to form and emerge, which makes them particularly interesting to scientists looking for life beyond the Solar System.

In the new study, researchers used Chandra and XMM to study the impact of steady X-ray and energetic ultraviolet (UV) radiation from Wolf 359 on the atmospheres of planets that might be orbiting the star. They found that only a planet with greenhouse gases like carbon dioxide in its atmosphere and at a relatively large distance away from Wolf 359 would have a chance to support life as we know it around a nearby star. The planet is depicted with the heavy cloud cover expected from the effects of greenhouse gases.

Animation of a Sun & Planet System
Animation Credit: NASA/CXC/SAO/A.Jubett)

Their work suggests that just being far enough away from the star’s harmful radiation would not be enough to allow a planet around Wolf 359 to sustain life. The team looked at the “habitable zone,” the region around a star where liquid water could exist on a planet’s surface, for Wolf 359. They found that an Earth-like planet in the middle of the habitable zone blanketed with greenhouse gases should be able to sustain an atmosphere for almost two billion years.

In addition to the dangers posed by the steady, everyday high-energy radiation from a star like Wolf 359, any orbiting planets would be subjected to occasional giant bursts of X-rays. Using observations with Chandra and XMM-Newton, astronomers discovered 18 X-ray flares, or outbursts, from Wolf 359 in under 4 days. Chandra data of Wolf 359 is shown in the inset. Extrapolating from these observed flares, the team expects that much more powerful and damaging flares would occur over longer periods of time. The combined effects of the steady X-ray and UV radiation and the flares means that any planet located in the habitable zone is unlikely to have a significant atmosphere long enough for multicellular life, as we know it on Earth, to form and survive. (Evidence suggests that it took at least 3 billion years for multicellular life to emerge on Earth.) The exception is the habitable zone's outer edge if a planet has a significant greenhouse effect.

The researchers used a special technique to estimate the energetic UV radiation from Wolf 359 using Chandra. The team looked at the difference in radiation measured with the High Resolution Camera (HRC) using two different filters: first, a thick filter that allows only X-rays to be detected, and second, a thinner filter that allows both X-rays and UV radiation to be detected. There are currently no specialized space missions for studying the most energetic ultraviolet radiation.

These results were presented at the 245th meeting of the American Astronomical Society in National Harbor, MD and are being prepared for publication in a journal. NASA's Marshall Space Flight Center manages the Chandra program. The Smithsonian Astrophysical Observatory's Chandra X-ray Center controls science operations from Cambridge, Massachusetts, and flight operations from Burlington, Massachusetts.


Visual Description:

This release features an artist's illustration of the red dwarf star Wolf 359, with a small orbiting planet in the distance. An inset image is included at our lower right.

Wolf 359 occupies much of the illustration. The fiery orange and yellow star fills the lower right corner of the image, extending well beyond the edges of the frame. The star's exterior appears to churn, with white hot flares bursting off the surface. A glowing yellow and orange haze surrounds the star, blanketing white flares and tendrils of hot gas.

In the distance, at our upper left, is an illustration of a small planet set against a black background dotted with faint specks of light. This represents one of two planets that may be in orbit around Wolf 359. Here, the orbiting planet has a blue-grey surface beneath a layer of swirling clouds. The water-like surface and cloudy atmosphere suggest that in this depiction, the planet is in Wolf 359's habitable zone, which may allow life to flourish.

Inset at our lower righthand corner is an X-ray image of Wolf 359. Here, the red dwarf star is a distant lavender dot glowing with purple haze, set against a pitch black background.


Fast Facts for Wolf 359:

Scale: Image is about 10 arcsec (3.8 billion km or 0.0004 light-years) across.
Category: Normal Stars & Star Clusters
Coordinates (J2000): RA 10h 56m 29s | Dec +07° 00´ 52"
Constellation: Leo
Observation Dates: 2 observations Nov 9-10, 2023
Observation Time: 244 hours 4 minutes (4 hours 4 minutes)
Obs. ID: 26490, 29051
Instrument: HRC
References: S. Wolk et al., 2025, 245th AAS meeting
Color Code: X-ray: purple
Distance Estimate: About 7.9 light-years


Sunday, December 22, 2024

NASA Missions Spot Cosmic 'Wreath' Displaying Stellar Circle of Life

NGC 602
Credit: X-ray: NASA/CXC; Infrared: ESA/Webb, NASA & CSA, P. Zeilder, E.Sabbi, A. Nota, M. Zamani; Image Processing: NASA/CXC/SAO/L. Frattare and K. Arcand


Since antiquity, wreaths have symbolized the cycle of life, death, and rebirth. It is fitting then that one of the best places for astronomers to learn more about the stellar lifecycle resembles a giant holiday wreath itself.

The star cluster NGC 602 lies on the outskirts of the Small Magellanic Cloud, which is one of the closest galaxies to the Milky Way, about 200,000 light-years from Earth. The stars in NGC 602 have fewer heavier elements compared to the Sun and most of the rest of the galaxy. Instead, the conditions within NGC 602 mimic those for stars found billions of years ago when the universe was much younger.

This new image combines data from NASA’s Chandra X-ray Observatory with a previously released image from the agency’s James Webb Space Telescope. The dark ring-like outline of the wreath seen in Webb data (represented as orange, yellow, green, and blue) is made up of dense clouds of filled dust.

Meanwhile, X-rays from Chandra (red) show young, massive stars that are illuminating the wreath, sending high-energy light into interstellar space. These X-rays are powered by winds flowing from the young, massive stars that are sprinkled throughout the cluster. The extended cloud in the Chandra data likely comes from the overlapping X-ray glow of thousands of young, low-mass stars in the cluster.

NGC 2264, the “Christmas Tree Cluster”
Credit: X-ray: NASA/CXC/SAO; Optical: Clow, M.; Image Processing: NASA/CXC/SAO/L. Frattare and K. Arcand);

View Animated Version

In addition to this cosmic wreath, a new version of the “Christmas tree cluster” is also now available. Like NGC 602, NGC 2264 is a cluster of young stars between one and five million years old. (For comparison, the Sun is a middle-aged star about 5 billion years old — about 1,000 times older.) In this image of NGC 2264, which is much closer than NGC 602 at a distance of about 2,500 light-years from Earth, Chandra data (red, purple, blue, and white) has been combined with optical data (green and violet) captured from by astrophotographer Michael Clow from his telescope in Arizona in November 2024.

NASA's Marshall Space Flight Center in Huntsville, Alabama, manages the Chandra program. The Smithsonian Astrophysical Observatory's Chandra X-ray Center controls science operations from Cambridge, Massachusetts, and flight operations from Burlington, Massachusetts.

Quick Look: NASA Missions Spot Cosmic 'Wreath' Displaying Stellar Circle of Life


Visual Description:

This release includes two composite images, each featuring a star cluster that strongly resembles holiday greenery.

The first image depicts star cluster NGC 602 in vibrant and festive colors. The cluster includes a giant dust cloud ring, shown in greens, yellows, blues, and oranges. The green hues and feathery edges of the ring cloud create the appearance of a wreath made of evergreen boughs. Hints of red representing X-rays provide shading, highlighting layers within the wreath-like ring cloud.

The image is aglow with specks and dots of colorful, festive light, in blues, golds, whites, oranges, and reds. These lights represent stars within the cluster. Some of the lights gleam with diffraction spikes, while others emit a warm, diffuse glow. Upon closer inspection, many of the glowing specks have spiraling arms, indicating that they are, in fact, distant galaxies.

The second image in today's release is a new depiction of NGC 2264, known as the "Christmas Tree Cluster". Here, wispy green clouds in a conical shape strongly resemble an evergreen tree. Tiny specks of white, blue, purple, and red light, stars within the cluster, dot the structure, turning the cloud into a festive, cosmic Christmas tree!


Fast Facts for NGC 602:

Credit: X-ray: NASA/CXC; Infrared: ESA/Webb, NASA & CSA, P. Zeilder, E.Sabbi, A. Nota, M. Zamani; Image Processing: NASA/CXC/SAO/L. Frattare and K. Arcand
Scale: Image is about 3 arcmin (175 light-years) across.
Category: Normal Stars & Star Clusters
Coordinates (J2000): RA 01h 29m 28.7s | Dec -73° 33´ 40.8"
Constellation: Hydrus
Observation Dates: 11 pointings between 31 March and 29 April, 2010
Observation Time: 80 hours 45 minutes (3 days 8 hours 45 minutes)
Obs. ID: 10985-10986, 11978-11979, 11988-11989, 12130-12131, 12134, 12136, 12207
Instrument: ACIS
References: Oskinova, L. et al, 2013, ApJ, 765 73; arXiv:1301.3500
Color Code: X-ray: red; Infrared: orange, yellow, green, and blue
Distance Estimate: About 200,000 light-years


Fast Facts for NGC 2264:

Credit: X-ray: NASA/CXC/SAO; Optical: Clow, M.; Image Processing: NASA/CXC/SAO/L. Frattare and K. Arcand
Scale: Image is about 77 arcmin (56 light-years) across.
Category: Normal Stars & Star Clusters
Coordinates (J2000): RA: 06h 40m 42.8s | Dec: +09° 49' 3.6"
Constellation: Monoceros
Observation Dates: 8 observations from February 2002 to December 2011
Observation Time: 137 hours 26 minutes ( 5 days 17 hours 26 mintues)
Obs. IDs: 2540, 2550, 9768, 9769, 13610, 13611, 14368, 14369
Instrument: ACIS
References: Ramirez, S.V., et al., 2004, AJ, 127,2659; arXiv:astro-ph:0401533
Color Code: X-ray: red, green, and blue; Optical: green and white
Distance Estimate: About 2,500 light-years


Monday, December 16, 2024

NASA's Chandra Sees Black Hole Jet Stumble Into Something in the Dark

Centaurus A
Credit: NASA/CXC/SAO/D. Bogensberger et al.; Image Processing: NASA/CXC/SAO/N. Wolk


Even matter ejected by black holes can run into objects in the dark. Using NASA’s Chandra X-ray Observatory, astronomers have found an unusual mark from a giant black hole’s powerful jet striking an unidentified object in its path.

The discovery was made in a galaxy called Centaurus A (Cen A), located about 12 million light-years from Earth. Astronomers have long studied Cen A because it has a supermassive black hole in its center sending out spectacular jets that stretch out across the entire galaxy. The black hole launches this jet of high-energy particles not from inside the black hole, but from intense gravitational and magnetic fields around it.

The image shows low-energy X-rays seen by Chandra represented in pink, medium-energy X-rays in purple, and the highest-energy X-rays in blue.
In this latest study, researchers determined that the jet is — at least in certain spots — moving at close to the speed of light. Using the deepest X-ray image ever made of Cen A, they also found a patch of V-shaped emission connected to a bright source of X-rays, something that had not been seen before in this galaxy.

Called C4, this source is located close to the path of the jet from the supermassive black hole and is highlighted in the inset. The arms of the “V” are at least about 700 light-years long. For context, the nearest star to Earth is about 4 light-years away.

Source C4 in the Centaurus A Galaxy
Credit: NASA/CXC/SAO/D. Bogensberger et al.; Image Processing: NASA/CXC/SAO/N. Wolk)

While the researchers have ideas about what is happening, the identity of the object being blasted is a mystery because it is too distant for its details to be seen, even in images from the current most powerful telescopes.

The incognito object being rammed may be a massive star, either by itself or with a companion star. The X-rays from C4 could be caused by the collision between the particles in the jet and the gas in a wind blowing away from the star. This collision can generate turbulence, causing a rise in the density of the gas in the jet. This, in turn, ignites the X-ray emission seen with Chandra.

The shape of the “V,” however, is not completely understood. The stream of X-rays trailing behind the source in the bottom arm of the “V” is roughly parallel to the jet, matching the picture of turbulence causing enhanced X-ray emission behind an obstacle in the path of the jet. The other arm of the “V” is harder to explain because it has a large angle to the jet, and astronomers are unsure what could explain that.

This is not the first time astronomers have seen a black hole jet running into other objects in Cen A. There are several other examples where a jet appears to be striking objects — possibly massive stars or gas clouds. However, C4 stands out from these by having the V-shape in X-rays, while other obstacles in the jet’s path produce elliptical blobs in the X-ray image. Chandra is the only X-ray observatory capable of seeing this feature. Astronomers are trying to determine why C4 has this different post-contact appearance, but it could be related to the type of object that the jet is striking or how directly the jet is striking it.

A paper describing these results appears in a recent issue of The Astrophysical Journal. The authors of the study are David Bogensberger (University of Michigan), Jon M. Miller (University of Michigan), Richard Mushotsky (University of Maryland), Niel Brandt (Penn State University), Elias Kammoun (University of Toulouse, France), Abderahmen Zogbhi (University of Maryland), and Ehud Behar (Israel Institute of Technology).

NASA's Marshall Space Flight Center in Huntsville, Alabama, manages the Chandra program. The Smithsonian Astrophysical Observatory's Chandra X-ray Center controls science operations from Cambridge, Massachusetts, and flight operations from Burlington, Massachusetts.


Visual Description:

This release features a series of images focusing on a collision between a jet of matter blasting out of a distant black hole, and a mysterious, incognito object.

At the center of the primary image is a bright white dot, encircled by a hazy purple blue ring tinged with neon blue. This is the black hole at the heart of the galaxy called Centaurus A. Shooting out of the black hole is a stream of ejected matter. This stream, or jet, shoots in two opposite directions. It shoots toward us, widening as it reaches our upper left, and away from us, growing thinner and more faint as it recedes toward the lower right. In the primary image, the jet resembles a trail of hot pink smoke. Other pockets of granular, hot pink gas can be found throughout the image. Here, pink represents low energy X-rays observed by Chandra, purple represents medium energy X-rays, and blue represents high energy X-rays.

Near our lower right, where the jet is at its thinnest, is a distinct pink "V", its arms opening toward our lower right. This mark is understood to be the result of the jet striking an unidentified object that lay in its path. A labeled version of the image highlights this region, and names the point of the V-shape, the incognito object, C4. A wide view version of the image is composited with optical data.

At the distance of Cen A, the arms of the V-shape appear rather small. In fact, each arm is at least 700 light-years long. The jet itself is 30,000 light-years long. For context, the nearest star to the Sun is about 4 light-years away.


Fast Facts for Centaurus A Knots:

Scale: Image is about 3 arcmin (11,000 light-years) across.
Category: Quasars & Active Galaxies
Coordinates (J2000): RA 13h 25m 27.62s | Dec -43° 01´ 08.80"
Constellation: Centaurus
Observation Dates: 34 observations between 17 May 2000 and 9 Sept 2022
Observation Time: 233 hours 18 minutes (9 days 17 hours 18 minutes)
Obs. ID: 962, 2978, 3965, 8489, 8490, 10722, 10725, 11846, 12156, 13303, 15294, 16276, 17890, 17891, 18461, 19747, 19521, 20794, 21698, 22714, 23823, 24318-24326, 26405, 26453, 27344, 27345
Instrument: ACIS
References: Bogensberger, D. et al., 2024, ApJ, 974, 307; arXiv:2408.14078
Color Code: X-ray (Chandra): magenta, purple, blue


Saturday, November 23, 2024

NASA's Chandra, Hubble Tune Into 'Flame-Throwing' Guitar Nebula

PSR B2224+65/Guitar Nebula
Credit/X-ray: NASA/CXC/Stanford Univ./M. de Vries et al.; Optical: (Hubble) NASA/ESA/STScI and (Palomar) Hale Telescope/Palomar/CalTech; Image Processing: NASA/CXC/SAO/L. Frattare


A Tour the Guitar Nebula - More Videos


Normally found only in heavy metal bands or certain post-apocalyptic films, a “flame-throwing guitar” has now been spotted moving through space. Astronomers have captured movies of this extreme cosmic object using NASA’s Chandra X-ray Observatory and Hubble Space Telescope.

The new movie of Chandra (red) and Palomar (blue) data helps break down what is playing out in the Guitar Nebula. X-rays from Chandra show a filament of energetic matter and antimatter particles, about two light-years or 12 trillion miles long, blasting away from the pulsar (seen as the bright white dot connected to the filament).
 
Astronomers have nicknamed the structure connected to the pulsar PSR B2224+65 as the “Guitar Nebula” because of its distinct resemblance to the instrument in glowing hydrogen light. The guitar shape comes from bubbles blown by particles ejected from the pulsar through a steady wind. Because the pulsar is moving from the lower right to the upper left, most of the bubbles were created in the past as the pulsar moved through a medium with variations in density

Outline of the guitar shape in the X-ray and optical image. Credit: X-ray: NASA/CXC/Stanford Univ./M. de Vries et al.; Optical: (Hubble) NASA/ESA/STScI and (Palomar) Hale Telescope/Palomar/CalTech; Illustrated outline: NASA/CXC/K. DiVona; Image Processing: NASA/CXC/SAO/L. Frattare)

At the tip of the guitar is the pulsar, a rapidly rotating neutron star left behind after the collapse of a massive star. As it hurtles through space it is pumping out a flame-like filament of particles and X-ray light that astronomers have captured with Chandra.

How does space produce something so bizarre? The combination of two extremes — fast rotation and high magnetic fields of pulsars — leads to particle acceleration and high-energy radiation that creates matter and antimatter particles, as electron and positron pairs. In this situation, the usual process of converting mass into energy, famously determined by Albert Einstein's E = mc2 equation, is reversed. Here, energy is being converted into mass to produce the particles.

Particles spiraling along magnetic field lines around the pulsar create the X-rays that Chandra detects. As the pulsar and its surrounding nebula of energetic particles have flown through space, they have collided with denser regions of gas. This allows the most energetic particles to escape the confines of the Guitar Nebula and fly to the right of the pulsar, creating the filament of X-rays. When those particles escape, they spiral around and flow along magnetic field lines in the interstellar medium, that is, the space in between stars.

The new movie shows the pulsar and the filament flying towards the upper left of the image through Chandra data taken in 2000, 2006, 2012 and 2021. The movie has the same optical image in each frame, so it does not show changes in parts of the “guitar.” A separate movie obtained with data from NASA’s Hubble Space Telescope (obtained in 1994, 2001, 2006, and 2021) shows the motion of the pulsar and the smaller structures around it.

Hubble Space Telescope data: 1994, 2001, 2006, and 2021
Credit: Optical: (Hubble) NASA/ESA/STScI and (Palomar) Hale Telescope/Palomar/CalTech)

A study of this data has concluded that the variations that drive the formation of bubbles in the hydrogen nebula, which forms the outline of the guitar, also control changes in how many particles escape to the right of the pulsar, causing subtle brightening and fading of the X-ray filament, like a cosmic blow torch shooting from the tip of the guitar.

The structure of the filament teaches astronomers about how electrons and positrons travel through the interstellar medium. It also provides an example of how this process is injecting electrons and positrons into the interstellar medium.

A paper describing these results was published in The Astrophysical Journal and is available here.

NASA's Marshall Space Flight Center manages the Chandra program. The Smithsonian Astrophysical Observatory's Chandra X-ray Center controls science operations from Cambridge, Massachusetts, and flight operations from Burlington, Massachusetts.

NASA's Chandra, Hubble Tune Into 'Flame-Throwing' Guitar Nebula


Visual Description:

This release features two short videos and a labeled composite image, all featuring what can be described as a giant flame-throwing guitar floating in space.

In both the six second multiwavelength Guitar Nebula timelapse video and the composite image, the guitar shape appears at our lower left, with the neck of the instrument pointing toward our upper left. The guitar shape is ghostly and translucent, resembling a wispy cloud on a dark night. At the end of the neck, the guitar’s headstock comes to a sharp point that lands on a bright white dot. This dot is a pulsar, and the guitar shape is a hydrogen nebula. The nebula was formed when particles being ejected by the pulsar produced a cloud of bubbles. The bubbles were then blown into a curvy guitar shape by a steady wind. The guitar shape is undeniable, and is traced by a thin white line in the labeled composite image.

The pulsar, known as PSR B2224+65, has also released a long filament of energetic matter and antimatter particles approximately 12 trillion miles long. In both the composite image and the six second video, this energetic, X-ray blast shoots from the bright white dot at the tip of the guitar’s headstock, all the way out to our upper righthand corner. In the still image, the blast resembles a streak of red dots, most of which fall in a straight, densely packed line. The six second video features four separate images of the phenomenon, created with Chandra data gathered in 2000, 2006, 2012, and 2021. When shown in sequence, the density of the X-ray blast filament appears to fluctuate.

A 12 second video is also included in this release. It features four images that focus on the headstock of the guitar shape. These images were captured by the Hubble Space Telescope in 1994, 2001, 2006, and 2021. When played in sequence, the images show the headstock shape expanding. A study of this data has concluded that the variations that drive the formation of bubbles in the hydrogen nebula also control changes in the pulsar’s blast filament. Meaning the same phenomenon that created the cosmic guitar also created the cosmic blowtorch shooting from the headstock.


Fast Facts for Guitar Nebula:

Scale: Image is about 2.6 arcmin (2 light-years) across.
Category: Neutron Stars/X-ray Binaries
Coordinates (J2000): RA 22h 25m 52.36s | Dec +65° 35´ 33.79"
Constellation: Cepheus
Observation Dates: 21 pointings between Oct 2000 and Feb 2022
Observation Time: 147 hours 56 minutes (6 days 3 hours 56 minutes)
Obs. ID: 755, 6691, 7400, 13771, 14353, 14467, 24426-24437, 24992, 26336
Instrument: ACIS
References: de Vries, M. et al., 2022, ApJ, 939, 70.
Color Code: X-ray: red; Optical: blue
Distance Estimate: About 2,700 light-years


Monday, November 04, 2024

Planets Beware: NASA Unburies Danger Zones of Star Cluster

Cygnus OB2

Credit X-ray: NASA/CXC/SAO/J. Drake et al, IR: NASA/JPL-Caltech/Spitzer; Image Processing: NASA/CXC/SAO/N. Wolk

JPEG (697.3 kb) - Large JPEG (14.3 MB) - Tiff (24 MB - More Images

A Tour of 3C 58 - More Videos


Most stars form in collections, called clusters or associations, that include very massive stars. These giant stars send out large amounts of high-energy radiation, which can disrupt relatively fragile disks of dust and gas that are in the process of coalescing to form new planets.

A team of astronomers used NASA’s Chandra X-ray Observatory, in combination with ultraviolet, optical, and infrared data, to show where some of the most treacherous places in a star cluster may be, where planets’ chances to form are diminished.

The target of the observations was Cygnus OB2, which is the nearest large cluster of stars to our Sun — at a distance of about 4,600 light-years. The cluster contains hundreds of massive stars as well as thousands of lower-mass stars. The team used long Chandra observations pointing at different regions of Cygnus OB2, and the resulting set of images were then stitched together into one large image.

The deep Chandra observations mapped out the diffuse X-ray glow in between the stars, and they also provided an inventory of the young stars in the cluster. This inventory was combined with others using optical and infrared data to create the best census of young stars in the cluster.

In this new composite image, the Chandra data (purple) shows the diffuse X-ray emission and young stars in Cygnus OB2, and infrared data from NASA’s now-retired Spitzer Space Telescope (red, green, blue, and cyan) reveals young stars and the cooler dust and gas throughout the region.
In these crowded stellar environments, copious amounts of high-energy radiation produced by stars and planets are present. Together, X-rays and intense ultraviolet light can have a devastating impact on planetary disks and systems in the process of forming.

Planet-forming disks around stars naturally fade away over time. Some of the disk falls onto the star and some is heated up by X-ray and ultraviolet radiation from the star and evaporates in a wind. The latter process, known as “photoevaporation,” usually takes between 5 and 10 million years with average-sized stars before the disk disappears. If massive stars, which produce the most X-ray and ultraviolet radiation, are nearby, this process can be accelerated.

The researchers using this data found clear evidence that planet-forming disks around stars indeed disappear much faster when they are close to massive stars producing a lot of high-energy radiation. The disks also disappear more quickly in regions where the stars are more closely packed together.

For regions of Cygnus OB2 with less high-energy radiation and lower numbers of stars, the fraction of young stars with disks is about 40%. For regions with more high-energy radiation and higher numbers of stars, the fraction is about 18%. The strongest effect — meaning the worst place to be for a would-be planetary system — is within about 1.6 light-years of the most massive stars in the cluster.

A separate study by the same team examined the properties of the diffuse X-ray emission in the cluster. They found that the higher-energy diffuse emission comes from areas where winds of gas blowing away from massive stars have collided with each other. This causes the gas to become hotter and produce X-rays. The less energetic emission probably comes from gas in the cluster colliding with gas surrounding the cluster.

Two separate papers describing the Chandra data of Cygnus OB2 are available. The paper about the planetary danger zones, led by Mario Giuseppe Guarcello (National Institute for Astrophysics in Palermo, Italy), appeared in the November 2023 issue of the Astrophysical Journal Supplement Series, and is available here. The paper about the diffuse emission, led by Juan Facundo Albacete-Colombo (University of Rio Negro in Argentina) was published in the same issue of Astrophysical Journal Supplement, and is available here.

NASA's Marshall Space Flight Center in Huntsville, Alabama, manages the Chandra program. The Smithsonian Astrophysical Observatory's Chandra X-ray Center controls science operations from Cambridge, Massachusetts, and flight operations from Burlington, Massachusetts.

JPL managed the Spitzer Space Telescope mission for NASA’s Science Mission Directorate in Washington until the mission was retired in January 2020. Science operations were conducted at the Spitzer Science Center at Caltech. Spacecraft operations were based at Lockheed Martin Space in Littleton, Colorado. Data are archived at the Infrared Science Archive operated by IPAC at Caltech. Caltech manages JPL for NASA.


Visual Description:

This release features a composite image of the Cygnus OB2 star cluster, which resembles a night sky blanketed in orange, purple, and grey clouds.

The center of the square image is dominated by purple haze. This haze represents diffuse X-ray emissions, and young stars, detected by the Chandra X-ray observatory. Surrounding the purple haze is a mottled, streaky, brick orange cloud. Another cloud resembling a tendril of grey smoke stretches from our lower left to the center of the image. These clouds represent relatively cool dust and gas observed by the Spitzer Space Telescope.

Although the interwoven clouds cover most of the image, the thousands of stars within the cluster shine through. The lower-mass stars present as tiny specks of light. The massive stars gleam, some with long refraction spikes.


Fast Facts for Cygnus OB2:

Scale: Image is about 1.5 arcmin (120 light-years) across.
Category: Normal Stars & Star Clusters
Coordinates (J2000): RA 20h 33m 12s | Dec +41° 19´ 00"
Constellation: Cygnus
Observation Dates: 40 pointings between January 2004 and March 2010
Observation Time: 331 hours 30 minutes (13 days 19 hours 30 minutes)
Obs. ID: 4501, 4511, 7426, 10939-10974, 12099
Instrument: ACIS
References: Guarcell, M.G. et al, 2023, ApJS, 269, 13; Albacete-Colombo, J.F. et al, 2023, ApJS, 269, 14.
Color Code: X-ray: purple; Infrared (IRAC): red, green, blue; Infrared (MIPS): cyan;
Distance Estimate: About 4,600 light-years


Tuesday, October 15, 2024

Black Hole Destroys Star, Goes After Another, NASA Missions Find

AT2019qiz
Credit X-ray: NASA/CXC/Queen's Univ. Belfast/M. Nicholl et al.; Optical/IR: PanSTARRS, NSF/Legacy Survey/SDSS;
Illustration: Soheb Mandhai / The Astro Phoenix; Image Processing: NASA/CXC/SAO/N. Wolk


NASA’s Chandra X-ray Observatory and other telescopes have identified a supermassive black hole that has torn apart one star and is now using that stellar wreckage to pummel another star or smaller black hole, as described in our latest press release. This research helps connect two cosmic mysteries and provides information about the environment around some of the bigger types of black holes.

This artist’s illustration shows a disk of material (red, orange, and yellow) that was created after a supermassive black hole (depicted on the right) tore apart a star through intense tidal forces. Over the course of a few years, this disk expanded outward until it intersected with another object — either a star or a small black hole — that is also in orbit around the giant black hole. Each time this object crashes into the disk, it sends out a burst of X-rays detected by Chandra. The inset shows Chandra data (purple) and an optical image of the source from Pan-STARRS (red, green, and blue).

In 2019, an optical telescope in California noticed a burst of light that astronomers later categorized as a “tidal disruption event”, or TDE. These are cases where black holes tear stars apart if they get too close through their powerful tidal forces. Astronomers gave this TDE the name of AT2019qiz.

Meanwhile, scientists were also tracking instances of another type of cosmic phenomena occasionally observed across the Universe. These were brief and regular bursts of X-rays that were near supermassive black holes. Astronomers named these events “quasi-periodic eruptions,” or QPEs.

This latest study gives scientists evidence that TDEs and QPEs are likely connected. The researchers think that QPEs arise when an object smashes into the disk left behind after the TDE. While there may be other explanations, the authors of the study propose this is the source of at least some QPEs.

In 2023, astronomers used both Chandra and Hubble to simultaneously study the debris left behind after the tidal disruption had ended. The Chandra data were obtained during three different observations, each separated by about 4 to 5 hours. The total exposure of about 14 hours of Chandra time revealed only a weak signal in the first and last chunk, but a very strong signal in the middle observation.

Timelapse: X-ray Inset on Optical Background, 30 seconds
This series of images shows Chandra X-ray data of the area around AT2019qiz changing over time from December 9, 2023 at 10:44:59 UTC to December 9, 2023 at 20:09:07 UTC and then to December 10, 2023 at 14:49:06 UTC. Also included is a wide field optical image from Pan-STARRS. Chandra and other telescopes have identified this supermassive black hole that has torn apart one star and is now using that stellar wreckage to pummel another star or smaller black hole. Credit: NASA/CXC/A. Hobart

From there, the researchers used NASA’s Neutron Star Interior Composition Explorer (NICER) to look frequently at AT2019qiz for repeated X-ray bursts. The NICER data showed that AT2019qiz erupts roughly every 48 hours. Observations from NASA’s Neil Gehrels Swift Observatory and India’s AstroSat telescope cemented the finding.

The ultraviolet data from Hubble, obtained at the same time as the Chandra observations, allowed the scientists to determine the size of the disk around the supermassive black hole. They found that the disk had become large enough that if any object was orbiting the black hole and took about a week or less to complete an orbit, it would collide with the disk and cause eruptions.

This result has implications for searching for more quasi-periodic eruptions associated with tidal disruptions. Finding more of these would allow astronomers to measure the prevalence and distances of objects in close orbits around supermassive black holes. Some of these may be excellent targets for the planned future gravitational wave observatories.

The paper describing these results appears in the October 9, 2024 issue of the journal Nature. The first author of the paper is Matt Nicholl (Queen’s University Belfast in Ireland) and the full list of authors can be found in the paper, which is available online at: https://arxiv.org/abs/2409.02181

NASA's Marshall Space Flight Center manages the Chandra program. The Smithsonian Astrophysical Observatory's Chandra X-ray Center controls science operations from Cambridge, Massachusetts, and flight operations from Burlington, Massachusetts.


Visual Description:

This release features an artist's rendering that illustrates the destructive power of a supermassive black hole. The digital image depicts a disk of stellar material surrounding one such black hole. At its outer edge a neighboring star is colliding with and flying through the disk.

The black hole sits halfway down our right edge of the vertical image. It resembles a jet black semicircle with a domed cap of pale blue light. The bottom half of the circular black hole is hidden behind the disk of stellar material. In this illustration, the disk is viewed edge on. It resembles a band of swirling yellow, orange, and red gas, cutting diagonally from our middle right toward our lower left.

Near our lower left, the outer edge of the stellar debris disk overlaps with a bright blue sphere surrounded by luminous white swirls. This sphere represents a neighboring star crashing through the disk. The stellar disk is the wreckage of a destroyed star. An electric blue and white wave shows the hottest gas in the disk.

As the neighboring star crashes through the disk it leaves behind a trail of gas depicted as streaks of fine mist. Bursts of X-rays are released and are detected by Chandra.

Superimposed in the upper left corner of the illustration is an inset box showing a close up image of the source in X-ray and optical light. X-ray light is shown as purple and optical light is white and beige.


Fast Facts for AT2019qiz:

Scale: Image is about 5 arcmin (305,000 light-years) across. X-ray movie is about 1 arcminute (61,000 light-years) across.
Category: Black Holes, Quasars & Active Galaxies
Coordinates (J2000): RA 4h 46m 37.9s | Dec -10° 13´ 34.9"
Constellation: Eridanus
Observation Dates: 3 observations between Dec 09, 2023 and Dec 10, 2023
Observation Time: 13 hours 58 minutes
Obs. ID: 26788, 29099, 29100
Instrument: ACIS
References: Nicholl, M, et al., 2024, Nature; arXiv:2409.02181
Color Code: X-ray: purple; Optical/IR: red, green, and blue.
Distance Estimate: About 210 million light-years (z=0.0151)