Friday, February 17, 2017

Sidekick or star of the show?

Credit: ESA/Hubble & NASA


This image was captured by the NASA/ESA Hubble Space Telescope’s Advanced Camera for Surveys (ACS), a highly efficient wide-field camera covering the optical and near-infrared parts of the spectrum. While this lovely image contains hundreds of distant stars and galaxies, one vital thing is missing — the object Hubble was actually studying at the time! 

This is not because the target has disappeared. The ACS actually uses two detectors: the first captures the object being studied — in this case an open star cluster known as NGC 299 — while the other detector images the patch of space just ‘beneath’ it. This is what can be seen here.

Technically, this picture is merely a sidekick of the actual object of interest — but space is bursting with activity, and this field of bright celestial bodies offers plenty of interest on its own. It may initially seem to show just stars, but a closer look reveals many of these tiny objects to be galaxies. The spiral galaxies have arms curving out from a bright centre. The fuzzier, less clearly shaped galaxies might be ellipticals. Some of these galaxies contain millions and millions of stars, but are so distant that all of their starry residents are contained within just a small pinprick of light that appears to be the  same size as a single star!

The bright blue dots are very hot stars, sometimes distorted into crosses by the struts supporting Hubble’s secondary mirror. The redder dots are cooler stars, possibly in the red giant phase when a dying star cools and expands.


Thursday, February 16, 2017

Over 100 New Exoplanet Candidates Discovered With W. M. Keck Observatory

 HIRES instrument helps detect potential exoplanets. 
Artist’s conceptions of the probable planet orbiting a star called GJ 411 
Courtesy of Ricardo Ramirez.


International team of astronomers releases the largest-ever compilation of exoplanet-detecting observations, made from observatory atop Maunakea

Maunakea, Hawai'i  - An international team of astronomers today released a compilation of almost 61,000 individual measurements made on more than 1,600 stars, used to detect exoplanets elsewhere in our Milky Way galaxy. The compilation includes data on over 100 new potential exoplanets. The entire dataset was observed using one of the twin telescopes of the W. M. Keck Observatory on Maunakea over the past two decades. The search for new worlds elsewhere in our Milky Way galaxy is one of the most exciting frontiers in astronomy today. The paper is published in the Astronomical Journal.

HIRES instrument helps detect potential exoplanets 

"The work of this team and their willingness to share data and techniques unveils a world of new possibilities, vastly increasing the ability of astronomers everywhere to perform in-depth studies of these exoplanet systems," said Hilton Lewis, Keck Observatory Director. "Our observatory is proud to be the source of these discoveries, thanks to our cutting-edge instrumentation and the unparalleled observing conditions atop Maunakea."

The astronomers used a highly specialized instrument called the High Resolution Echelle Spectrometer, or HIRES, mounted on the 10-meter Keck-I telescope. The instrument detects tiny wobbles of nearby stars caused by the gravitational pull of planets orbiting those stars -a sensitive and challenging phenomenon to measure. Powerful instrumentation and sophisticated algorithms are needed to extract the signature of the exoplanets.

"HIRES is an incredible tool, part of the suite of sensitive instruments used to perform all kinds of extraordinary observations with our twin telescopes," said Greg Doppmann, Keck Observatory Support Astronomer. "Our scientific and technical support team brings their A-game daily-a precise focus on even the tiniest details-to ensure that these instruments are ready to deploy for each night of observing."

Contributors to the international team include representatives from the Carnegie Institution for Science, University of California at Santa Cruz, Yale University, University of Hertfordshire, and Universidad de Chile.

For more background information, please visit:

About W. M. Keck Observatory 

 The W. M. Keck Observatory operates the largest, most scientifically productive telescopes on Earth. The two, 10-meter optical/infrared telescopes near the summit of Mauna Kea on the Island of Hawai'i feature a suite of advanced instruments including imagers, multi-object spectrographs, high-resolution spectrographs, integral-field spectrographs and world-leading laser guide star adaptive optics systems. Keck Observatory is a private 501(c) 3 non-profit organization and a scientific partnership of the California Institute of Technology, the University of California and NASA. For additional information regarding W. M. Keck Observatory, please visit  http://www.keckobservatory.org/.

Contact:

Andrea Lum
Bennet Group Strategic Communications
808-286-9569
andrea@bennetgroup.com

Rich Matsuda
W. M. Keck Observatory
(808) 881-3822
communications@keck.hawaii.edu


The heart of a far-off star beats for its planet

For the first time, astronomers have observed a star pulsing in response to its orbiting planet. The star, HAT-P-2, pictured, is one of the most massive exoplanets known today. The planet, named HAT-P-2b, tracks its star in a highly eccentric orbit, flying extremely close to and around the star, then hurtling far out before eventually circling back around. Image courtesy of NASA (edited by MIT News)

Scientists observe first planet-induced stellar pulsations.

For the first time, astronomers from MIT and elsewhere have observed a star pulsing in response to its orbiting planet.

The star, which goes by the name HAT-P-2, is about 400 light years from Earth and is circled by a gas giant measuring eight times the mass of Jupiter — one of the most massive exoplanets known today. The planet, named HAT-P-2b, tracks its star in a highly eccentric orbit, flying extremely close to and around the star, then hurtling far out before eventually circling back around.

The researchers analyzed more than 350 hours of observations of HAT-P-2 taken by NASA’s Spitzer Space Telescope, and found that the star’s brightness appears to oscillate ever so slightly every 87 minutes. In particular, the star seems to vibrate at exact harmonics, or multiples of the planet’s orbital frequency — the rate at which the planet circles its star.

The precisely timed pulsations have lead the researchers to believe that, contrary to most theoretical model-based predictions of exoplanetary behavior, HAT-P-2b may be massive enough to periodically distort its star, making the star’s molten surface flare, or pulse, in response.

“We thought that planets cannot really excite their stars, but we find that this one does,” says Julien de Wit, a postdoc in MIT’s Department of Earth, Atmospheric and Planetary Sciences. “There is a physical link between the two, but at this stage, we actually can’t explain it. So these are mysterious pulsations induced by the star’s companion.”

De Wit is a the lead author of a paper detailing the results, published today in Astrophysical Journal Letters.

Getting a pulse

The team came upon the stellar pulsations by chance. Originally, the researchers sought to generate a precise map of an exoplanet’s temperature distribution as it orbits its star. Such a map would help scientists track how energy is circulated through a planet’s atmosphere, which can give clues to an atmosphere’s wind patterns and composition.

With this goal in mind, the team viewed HAT-P-2 as an ideal system: Because the planet has an eccentric orbit, it seesaws between temperature extremes, turning

cold as it moves far away from its star, then rapidly heating as it swings extremely close.

“The star dumps an enormous amount of energy onto the planet’s atmosphere, and our original goal was to see how the planet’s atmosphere redistributes this energy,” de Wit says.

The researchers obtained 350 hours of observations of HAT-P-2, taken intermittently by Spitzer’s infrared telescope between July 2011 and November 2015. The dataset represents one of the largest ever taken by Spitzer, giving de Wit and his colleagues plenty of observations to allow for detecting the incredibly tiny signals required to map an exoplanet’s temperature distribution.

The team processed the data and focused on the window in which the planet made its closest approach, passing first in front of and then behind the star. During these periods, the researchers measured the star’s brightness to determine the amount of energy, in the form of heat, transferred to the planet.

Each time the planet passed behind the star, the researchers saw something unexpected: Instead of a flat line, representing a momentary drop as the planet is masked by its star, they observed tiny spikes — oscillations in the star’s light, with a period of about 90 minutes, that happened to be exact multiples of the planet’s orbital frequency.

“They were very tiny signals,” de Wit says. “It was like picking up the buzzing of a mosquito passing by a jet engine, both miles away.”

Lots of theories, one big mystery

Stellar pulsations can occur constantly as a star’s surface naturally boils and turns over. But the tiny pulsations detected by de Wit and his colleagues seem to be in concert with the planet’s orbit. The signals, they concluded, must not be due to anything in the star itself, but to either the circling planet or an effect in Spitzer’s instruments.

The researchers ruled out the latter after modeling all the possible instrumental effects, such as vibration, that could have affected the measurements, and finding that none of the effects could have produced the pulsations they observed.

“We think these pulsations must be induced by the planet, which is surprising,” de Wit says. “We’ve seen this in systems with two rotating stars that are supermassive, where one can really distort the other, release the distortion, and the other one vibrates. But we did not expect this to happen with a planet — even one as massive as this.”

“This is really exciting because, if our interpretations are correct, it tells us that planets can have a significant impact on physical phenomena operating in their host-stars,” says co-author Victoria Antoci, a postdoc at Aarhus University in Denmark. “In other words, the star ‘knows’ about its planet and reacts to its presence.”

The team has some theories as to how the planet might be causing its star to pulse. For example, perhaps the planet’s transient gravitational pull is disturbing the star just enough to tip it toward a self-pulsating phase. There are stars that naturally pulse, and perhaps HAT-P-2b is pushing its star toward that state, the way adding salt to a simmering pot of water can trigger it to boil over. De Wit says this is just one of several possibilities, but getting to the root of the stellar pulsations will require much more work.

“It’s a mystery, but it’s great, because it demonstrates our understanding of how a planet affects its star is not complete,” de Wit says. “So we’ll have to move forward and figure out what’s going on there.”

This research was supported, in part, by NASA’s Jet Propulsion Laboratory and Caltech.


Wednesday, February 15, 2017

New Light on Dark Matter Halos

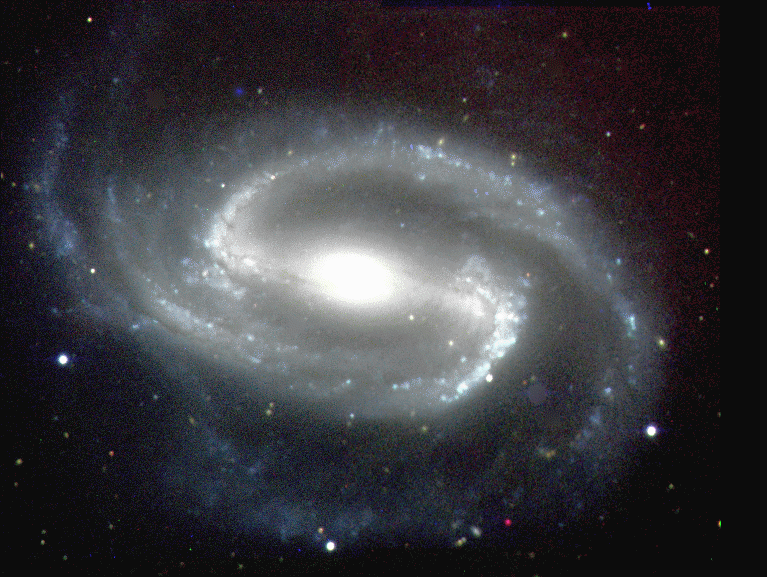
NGC 1300 is a classic barred spiral galaxy, similar to those observed in the present study. It is 17 Mpc away and relatively face-on, with an inclination of about 35 degrees. Shown here is a colour composition from B, V and I-band CCD images obtained using the Prime-Focus Camera on the Isaac Newton Telescope (INT) in 1996. Credit: J. A. López Aguerri, M. Prieto, C. Muñoz-Tuñón, and A. M. Varela (IAC). Large format: GIF


For the past twenty years observers have been trying to test the effects of the predicted dark matter halos on the bars in barred galaxies. The basic idea is that according to simulation models which include the halos, these should have acted as a gravitational brake and slowed down the rotation of the bars during the lifetimes of galaxy discs.

This could be tested by measuring the corotation radius corresponding to the bar, which is the radius at which the angular pattern speed of the bar is equal to the angular speed of the stars in the disc. Classical models as early as the 1980's showed that the corotation radius should be just outside the tip of the bar, while the simulations made just under 20 years ago suggested that the ratio of the corotation radius to the bar length should indeed be just bigger than unity, unless the bar has been slowed down by interaction with the halo.

In that case corotation would move progressively outwards in the disc. The simulators set a (somewhat arbitrary) criterion that if the ratio excedes 1.4 this is satisfactory evidence of braking by the halo, and this criterion has been used by observers as a test for the presence of halos.

The problem has been the difficulty of measuring the corotation radius. Until recently this had been done, by a few different methods, for only a few tens of galaxies, and the results were somewhat surprising. The ratio of corotation radius to bar length was, in almost all cases, below 1.4. The conclusion seemed to be that dark halos do not have the braking effect predicted.

However a group at the Instituto de Astrofísica de Canarias (IAC), including Joan Font and John Beckman, devised a new method for corotation, using data from high resolution two-dimensional spectra taken with Fabry-Perot spectrographs, the most accurate among them GHaFaS on the William Herschel Telescope (WHT). They previously published corotation measurements on over 100 galaxies, and then applied their measurements to find the corotation-bar length ratios, using Spitzer satellite infrared images for the bar lengths, to avoid problems of dust absorption.

In their results, they found ratios in the range 1 to 1.4, but that was not all. They also computed the ratio of the bar angular rotation velocity to those of the discs, and showed that many bars, notably long, massive bars, have small values for this ratio, suggesting that braking must have occurred

Puzzled by this, they asked themselves how these two opposite conclusions could be reconciled, and the only answer seemed to be that the bars, as well as slowing down, must be growing in length as the discs evolved, thus keeping the ratio of corotation radius to bar length below 1.4. They enlisted the help of Inma Martínez, a theorist at the IAC, who simulates bar evolution in galaxies, and she showed in her simulations that this is indeed what tends to occur, and had not been well taken into account in previous work.

The results of two of the simulations. They show the development of the corotation radius and the bar length with time. The wiggles are due to the fact that bars develop buckling instabilities which make their growth uneven. The green areas are those where the bar length would be called "fast" in previous studies. Although the corotation radius increases with time, in these simulations the bar length increases faster, so that at the end of the simulation, in both cases the bar would have been classfied as "fast" even though it has slowed down considerably. Large format: JPEG

The results of their joint study were published in the February 1st issue of the Astrophysical Journal. The overall conclusion is that dark matter halos are no longer threatened by observations of rotating bars.


More information:

"New evidence in favour of dark matter: the bars in galaxies are spinning more slowly than we thought", IAC press release, 7th February 2017.

J. Font, J. E. Beckman, I. Martínez-Valpuesta, A. S. Borlaff, P. A. James, S. Díaz-García, B. García-Lorenzo, A. Camps-Fariña, L. Gutiérrez, and P. Amram, 2017, "Kinematic Clues to Bar Evolution for Galaxies in the Local Universe: Why the Fastest Rotating Bars are Rotating Most Slowly", ApJ, 835, 279 [ Paper ].

GHaFaS web site.

Contact:

Javier Méndez
(Public Relations Officer)


Tuesday, February 14, 2017

Self-made stars

This composite image shows powerful radio jets from the supermassive black hole at the center of a galaxy in the Phoenix Cluster inflating huge "bubbles" in the hot, ionized gas surrounding the galaxy. The cavities inside the blue region were imaged by NASA's Chandra X-ray observatory. Hugging the outside of these bubbles, ALMA discovered an unexpected trove of cold gas, the fuel for star formation (red). The background image is from the Hubble Space Telescope.  Image: ALMA (ESO/NAOJ/NRAO) H.Russell, et al.; NASA/ESA Hubble; NASA/CXC/MIT/M.McDonald et al.; B. Saxton (NRAO/AUI/NSF)


Astronomers observe black hole producing cold, star-making fuel from hot plasma jets and bubbles.

The Phoenix cluster is an enormous accumulation of about 1,000 galaxies, located 5.7 billion light years from Earth. At its center lies a massive galaxy, which appears to be spitting out stars at a rate of about 1,000 per year. Most other galaxies in the universe are far less productive, squeaking out just a few stars each year, and scientists have wondered what has fueled the Phoenix cluster’s extreme stellar output.

Now scientists from MIT, the University of Cambridge, and elsewhere may have an answer. In a paper published today in the Astrophysical Journal, the team reports observing jets of hot, 10-million-degree gas blasting out from the central galaxy’s black hole and blowing large bubbles out into the surrounding plasma.

These jets normally act to quench star formation by blowing away cold gas — the main fuel that a galaxy consumes to generate stars. However, the researchers found that the hot jets and bubbles emanating from the center of the Phoenix cluster may also have the opposite effect of producing cold gas, that in turn rains back onto the galaxy, fueling further starbursts. This suggests that the black hole has found a way to recycle some of its hot gas as cold, star-making fuel.

“We have thought the role of black hole jets and bubbles was to regulate star formation and to keep cooling from happening,” says Michael McDonald, assistant professor of physics in MIT’s Kavli Institute for Astrophysics and Space Research. “We kind of thought they were one-trick ponies, but now we see they can actually help cooling, and it’s not such a cut-and-dried picture.”

The new findings help to explain the Phoenix cluster’s exceptional star-producing power. They may also provide new insight into how supermassive black holes and their host galaxies mutually grow and evolve.

McDonald’s co-authors include lead author Helen Russell, an astronomer at Cambridge University; and others from the University of Waterloo, the Harvard-Smithsonian Center for Astrophysics, the University of Illinois, and elsewhere.

Hot jets, cold filaments

The team analyzed observations of the Phoenix cluster gathered by the Atacama Large Millimeter Array (ALMA), a collection of 66 large radio telescopes spread over the desert of northern Chile. In 2015, the group obtained permission to direct the telescopes at the Phoenix cluster to measure its radio emissions and to detect and map signs of cold gas.

The researchers looked through the data for signals of carbon monoxide, a gas that is present wherever there is cold hydrogen gas. They then converted the carbon monoxide emissions to hydrogen gas, to generate a map of cold gas near the center of the Phoenix cluster. The resulting picture was a puzzling surprise.

“You would expect to see a knot of cold gas at the center, where star formation happens,” McDonald says. “But we saw these giant filaments of cold gas that extend 20,000 light years from the central black hole, beyond the central galaxy itself. It’s kind of beautiful to see.”

The team had previously used NASA’s Chandra X-Ray Observatory to map the cluster’s hot gas. These observations produced a picture in which powerful jets flew out from the black hole at close to the speed of light. Further out, the researchers saw that the jets inflated giant bubbles in the hot gas.
When the team superimposed its picture of the Phoenix cluster’s cold gas onto the map of hot gas, they found a “perfect spatial correspondence”: The long filaments of frigid, 10-kelvins gas appeared to be draped over the bubbles of hot gas.

“This may be the best picture we have of black holes influencing the cold gas,” McDonald says.

Feeding the black hole

What the researchers believe to be happening is that, as jet inflate bubbles of hot, 10-million-degree gas near the black hole, they drag behind them a wake of slightly cooler, 1-million-degree gas. The bubbles eventually detach from the jets and float further out into the galaxy cluster, where each bubble’s trail of gas cools, forming long filaments of extremely cold gas that condense and rain back onto the black hole as fuel for star formation.

“It’s a very new idea that the bubbles and jets can actually influence the distribution of cold gas in any way,” McDonald says.

Scientists have estimated that there is enough cold gas near the center of the Phoenix cluster to keep producing stars at a high rate for another 30 to 40 million years. Now that the researchers have identified a new feedback mechanism that may supply the black hole with even more cold gas, the cluster’s stellar output may continue for much longer.

“As long as there’s cold gas feeding it, the black hole will keep burping out these jets,” McDonald says. “But now we’ve found that these jets are making more food, or cold gas. So you’re in this cycle that, in theory, could go on for a very long time.”

He suspects the reason the black hole is able to generate fuel for itself might have something to do with its size. If the black hole is relatively small, it may produce jets that are too weak to completely blast cold gas away from the cluster.

“Right now [the black hole] may be pretty small, and it’d be like putting a civilian in the ring with Mike Tyson,” McDonald says. “It’s just not up to the task of blowing this cold gas far enough away that it would never come back.”

The team is hoping to determine the mass of the black hole, as well as identify other, similarly extreme starmakers in the universe.


Hubble finds big brother of Halley's Comet ripped apart by white dwarf

This artist's impression shows a massive, comet-like object falling towards a white dwarf. New observations with the NASA/ESA Hubble Space Telescope show evidence for a belt of comet-like bodies orbiting the white dwarf, similar to the Kuiper Belt in our own Solar System. The findings also suggest the presence of one or more unseen surviving planets around the white dwarf which may have perturbed the belt sufficiently to hurl icy objects into the burned-out star. Credit: NASA, ESA, and Z. Levy (STScI)


The international team of astronomers observed the white dwarf WD 1425+540, about 170 light-years from Earth in the constellation Boötes (the Herdsman) [1]. While studying the white dwarf's atmosphere using both the NASA/ESA Hubble Space Telescope and the W. M. Keck Observatory the team found evidence that an object rather like a massive comet was falling onto the star, getting tidally disrupted while doing so.

The team determined that the object had a chemical composition similar to the famous Halley's Comet in our own Solar System, but it was 100 000 times more massive and had twice the proportion of water as its local counterpart. Spectral analysis showed that the destroyed object was rich in the elements essential for life, including carbon, oxygen, sulphur and even nitrogen [2].

This makes it the first detection of nitrogen in the debris falling onto a white dwarf. Lead author Siyi Xu of the European Southern Observatory, Germany, explains the importance of the discovery: "Nitrogen is a very important element for life as we know it. This particular object is quite rich in nitrogen, more so than any object observed in our Solar System."

There are already more than a dozen white dwarfs known to be polluted with infalling debris from rocky, asteroid-like objects, but this is the first time a body made of icy, comet-like material has been seen polluting a white dwarf's atmosphere. These findings are evidence for a belt of comet-like bodies, similar to our Solar System's Kuiper Belt, orbiting the white dwarf. These icy bodies apparently survived the star's evolution from a main sequence star – similar to our Sun – to a red giant and its final collapse to a small, dense white dwarf.

The team that made this discovery also considered how this massive object got from its original, distant orbit onto a collision course with its parent star [3]. The change in the orbit could have been caused by the gravitational distribution by so far undetected, surviving planets which have perturbed the belt of comets. Another explanation could be that the companion star of the white dwarf disturbed the belt and caused objects from the belt to travel toward the white dwarf. The change in orbit could also have been caused by a combination of these two scenarios.

The Kuiper Belt in the Solar System, which extends outward from Neptune's orbit, is home to many dwarf planets, comets, and other small bodies left over from the formation of the Solar System. The new findings now provide observational evidence to support the idea that icy bodies are also present in other planetary systems and have survived throughout the history of the star's evolution.


Notes

[1] The white dwarf was first found in 1974 and is part of a wide binary system, with a companion star separated by 2000 times the distance that the Earth is from the Sun.

[2] The measurements of carbon, nitrogen, oxygen, silicon, sulphur, iron and nickel and hydrogen come from the Cosmic Origins Spectrograph (COS), installed at the NASA/ESA Hubble Space Telescope. The W. M. Keck Telescopes provided the calcium, magnesium, and hydrogen.

[3] The team calculated that the accreted object originally resided about 300 astronomical units – 300 times the distance Earth-Sun – away from the white dwarf. This is seven times further out than the Kuiper-Belt objects in the Solar System.


More information

The Hubble Space Telescope is a project of international cooperation between ESA and NASA.


The international team of astronomers in this study consists of S. Xu (ESO, Germany), B. Zuckerman (Department of Physics and Astronomy, University of California, Los Angeles, USA), P. Dufour (Institut de Recherche sur les Exoplanètes, Université de Montréal, Canada), E. D. Young (Department of Earth, Planetary, and Space Sciences, University of California, Los Angeles), B. Klein (Department of Physics and Astronomy, University of California, Los Angeles, USA), M. Jura (Department of Physics and Astronomy, University of California, Los Angeles, USA)


Contacts

Siyi Xu
European Southern Observatory
Garching bei München, Germany
Tel: +49 89 3200 6298
Email: sxu@eso.org

Mathias Jäger
ESA/Hubble, Public Information Officer
Garching, Germany
Tel: +49 176 62397500
Email: mjaeger@partner.eso.org

Source: ESA/Hubble 

Monday, February 13, 2017

Scientists estimate solar nebula’s lifetime

By studying the magnetic orientations in ancient meteorites, an MIT team has determined that the solar nebula — the vast of disc of gas and dust that ultimately gave rise to the solar system — lasted around 3 to 4 million years. Image: NASA/JHUAPL


Study finds the swirling gas disk disappeared within the solar system’s first 4 million years

About 4.6 billion years ago, an enormous cloud of hydrogen gas and dust collapsed under its own weight, eventually flattening into a disk called the solar nebula. Most of this interstellar material contracted at the disk’s center to form the sun, and part of the solar nebula’s remaining gas and dust condensed to form the planets and the rest of our solar system.

Now scientists from MIT and their colleagues have estimated the lifetime of the solar nebula — a key stage during which much of the solar system evolution took shape.

This new estimate suggests that the gas giants Jupiter and Saturn must have formed within the first 4 million years of the solar system’s formation. Furthermore, they must have completed gas-driven migration of their orbital positions by this time.

“So much happens right at the beginning of the solar system’s history,” says Benjamin Weiss, professor of earth, atmospheric, and planetary sciences at MIT. “Of course the planets evolve after that, but the large-scale structure of the solar system was essentially established in the first 4 million years.”

Weiss and MIT postdoc Huapei Wang, the first author of this study, report their results today in the journal Science. Their co-authors are Brynna Downey, Clement Suavet, and Roger Fu from MIT; Xue-Ning Bai of the Harvard-Smithsonian Center for Astrophysics; Jun Wang and Jiajun Wang of Brookhaven National Laboratory; and Maria Zucolotto of the National Museum in Rio de Janeiro.

Spectacular recorders

By studying the magnetic orientations in pristine samples of ancient meteorites that formed 4.653 billion years ago, the team determined that the solar nebula lasted around 3 to 4 million years. This is a more precise figure than previous estimates, which placed the solar nebula’s lifetime at somewhere between 1 and 10 million years.

The team came to its conclusion after carefully analyzing angrites, which are some of the oldest and most pristine of planetary rocks. Angrites are igneous rocks, many of which are thought to have erupted onto the surface of asteroids very early in the solar system’s history and then quickly cooled, freezing their original properties — including their composition and paleomagnetic signals — in place.

Scientists view angrites as exceptional recorders of the early solar system, particularly as the rocks also contain high amounts of uranium, which they can use to precisely determine their age.
“Angrites are really spectacular,” Weiss says. “Many of them look like what might be erupting on Hawaii, but they cooled on a very early planetesimal.”

Weiss and his colleagues analyzed four angrites that fell to Earth at different places and times.

“One fell in Argentina, and was discovered when a farm worker was tilling his field,” Weiss says. “It looked like an Indian artifact or bowl, and the landowner kept it by this house for about 20 years, until he finally decided to have it analyzed, and it turned out to be a really rare meteorite.”

The other three meteorites were discovered in Brazil, Antarctica, and the Sahara Desert. All four meteorites were remarkably well-preserved, having undergone no additional heating or major compositional changes since they originally formed.

Measuring tiny compasses

The team obtained samples from all four meteorites. By measuring the ratio of uranium to lead in each sample, previous studies had determined that the three oldest formed around 4.653 billion years ago. The researchers then measured the rocks’ remnant magnetization using a precision magnetometer in the MIT Paleomagnetism Laboratory.

“Electrons are little compass needles, and if you align a bunch of them in a rock, the rock becomes magnetized,” Weiss explains. “Once they’re aligned, which can happen when a rock cools in the presence of a magnetic field, then they stay that way. That’s what we use as records of ancient magnetic fields.”

When they placed the angrites in the magnetometer, the researchers observed very little remnant magnetization, indicating there was very little magnetic field present when the angrites formed.
The team went a step further and tried to reconstruct the magnetic field that would have produced the rocks’ alignments, or lack thereof. To do so, they heated the samples up, then cooled them down again in a laboratory-controlled magnetic field.

“We can keep lowering the lab field and can reproduce what’s in the sample,” Weiss says. “We find only very weak lab fields are allowed, given how little remnant magnetization is in these three angrites.”

Specifically, the team found that the angrites’ remnant magnetization could have been produced by an extremely weak magnetic field of no more than 0.6 microteslas, 4.653 billion years ago, or, about 4 million years after the start of the solar system.

In 2014, Weiss’ group analyzed other ancient meteorites that formed within the solar system’s first 2 to 3 million years, and found evidence of a magnetic field that was about 10-100 times stronger — about 5-50 microtesla.

“It’s predicted that once the magnetic field drops by a factor of 10-100 in the inner solar system, which we’ve now shown, the solar nebula goes away really quickly, within 100,000 years,” Weiss says. “So even if the solar nebula hadn’t disappeared by 4 million years, it was basically on its way out.”

The planets align

The researchers’ new estimate is much more precise than previous estimates, which were based on observations of faraway stars.

“What’s more, the angrites’ paleomagnetism constrains the lifetime of our own solar nebula, while astronomical observations obviously measure other faraway solar systems,” Wang adds. “Since the solar nebula lifetime critically affects the final positions of Jupiter and Saturn, it also affects the later formation of the Earth, our home, as well as the formation of other terrestrial planets.”

Now that the scientists have a better idea of how long the solar nebula persisted, they can also narrow in on how giant planets such as Jupiter and Saturn formed. Giant planets are mostly made of gas and ice, and there are two prevailing hypotheses for how all this material came together as a planet. One suggests that giant planets formed from the gravitational collapse of condensing gas, like the sun did. The other suggests they arose in a two-stage process called core accretion, in which bits of material smashed and fused together to form bigger rocky, icy bodies. Once these bodies were massive enough, they could have created a gravitational force that attracted huge amounts of gas to ultimately form a giant planet.

According to previous predictions, giant planets that form through gravitational collapse of gas should complete their general formation within 100,000 years. Core accretion, in contrast, is typically thought to take much longer, on the order of 1 to several million years. Weiss says that if the solar nebula was around in the first 4 million years of solar system formation, this would give support to the core accretion scenario, which is generally favored among scientists.

“The gas giants must have formed by 4 million years after the formation of the solar system,” Weiss says. “Planets were moving all over the place, in and out over large distances, and all this motion is thought to have been driven by gravitational forces from the gas. We’re saying all this happened in the first 4 million years.”

This research was supported, in part, by NASA and a generous gift from Thomas J. Peterson, Jr.

Jennifer Chu | MIT News Office

Source: MIT/News

Sunday, February 12, 2017

When Stars Explode

Credit: ESO
Acknowledgement: Flickr user Josh Barrington


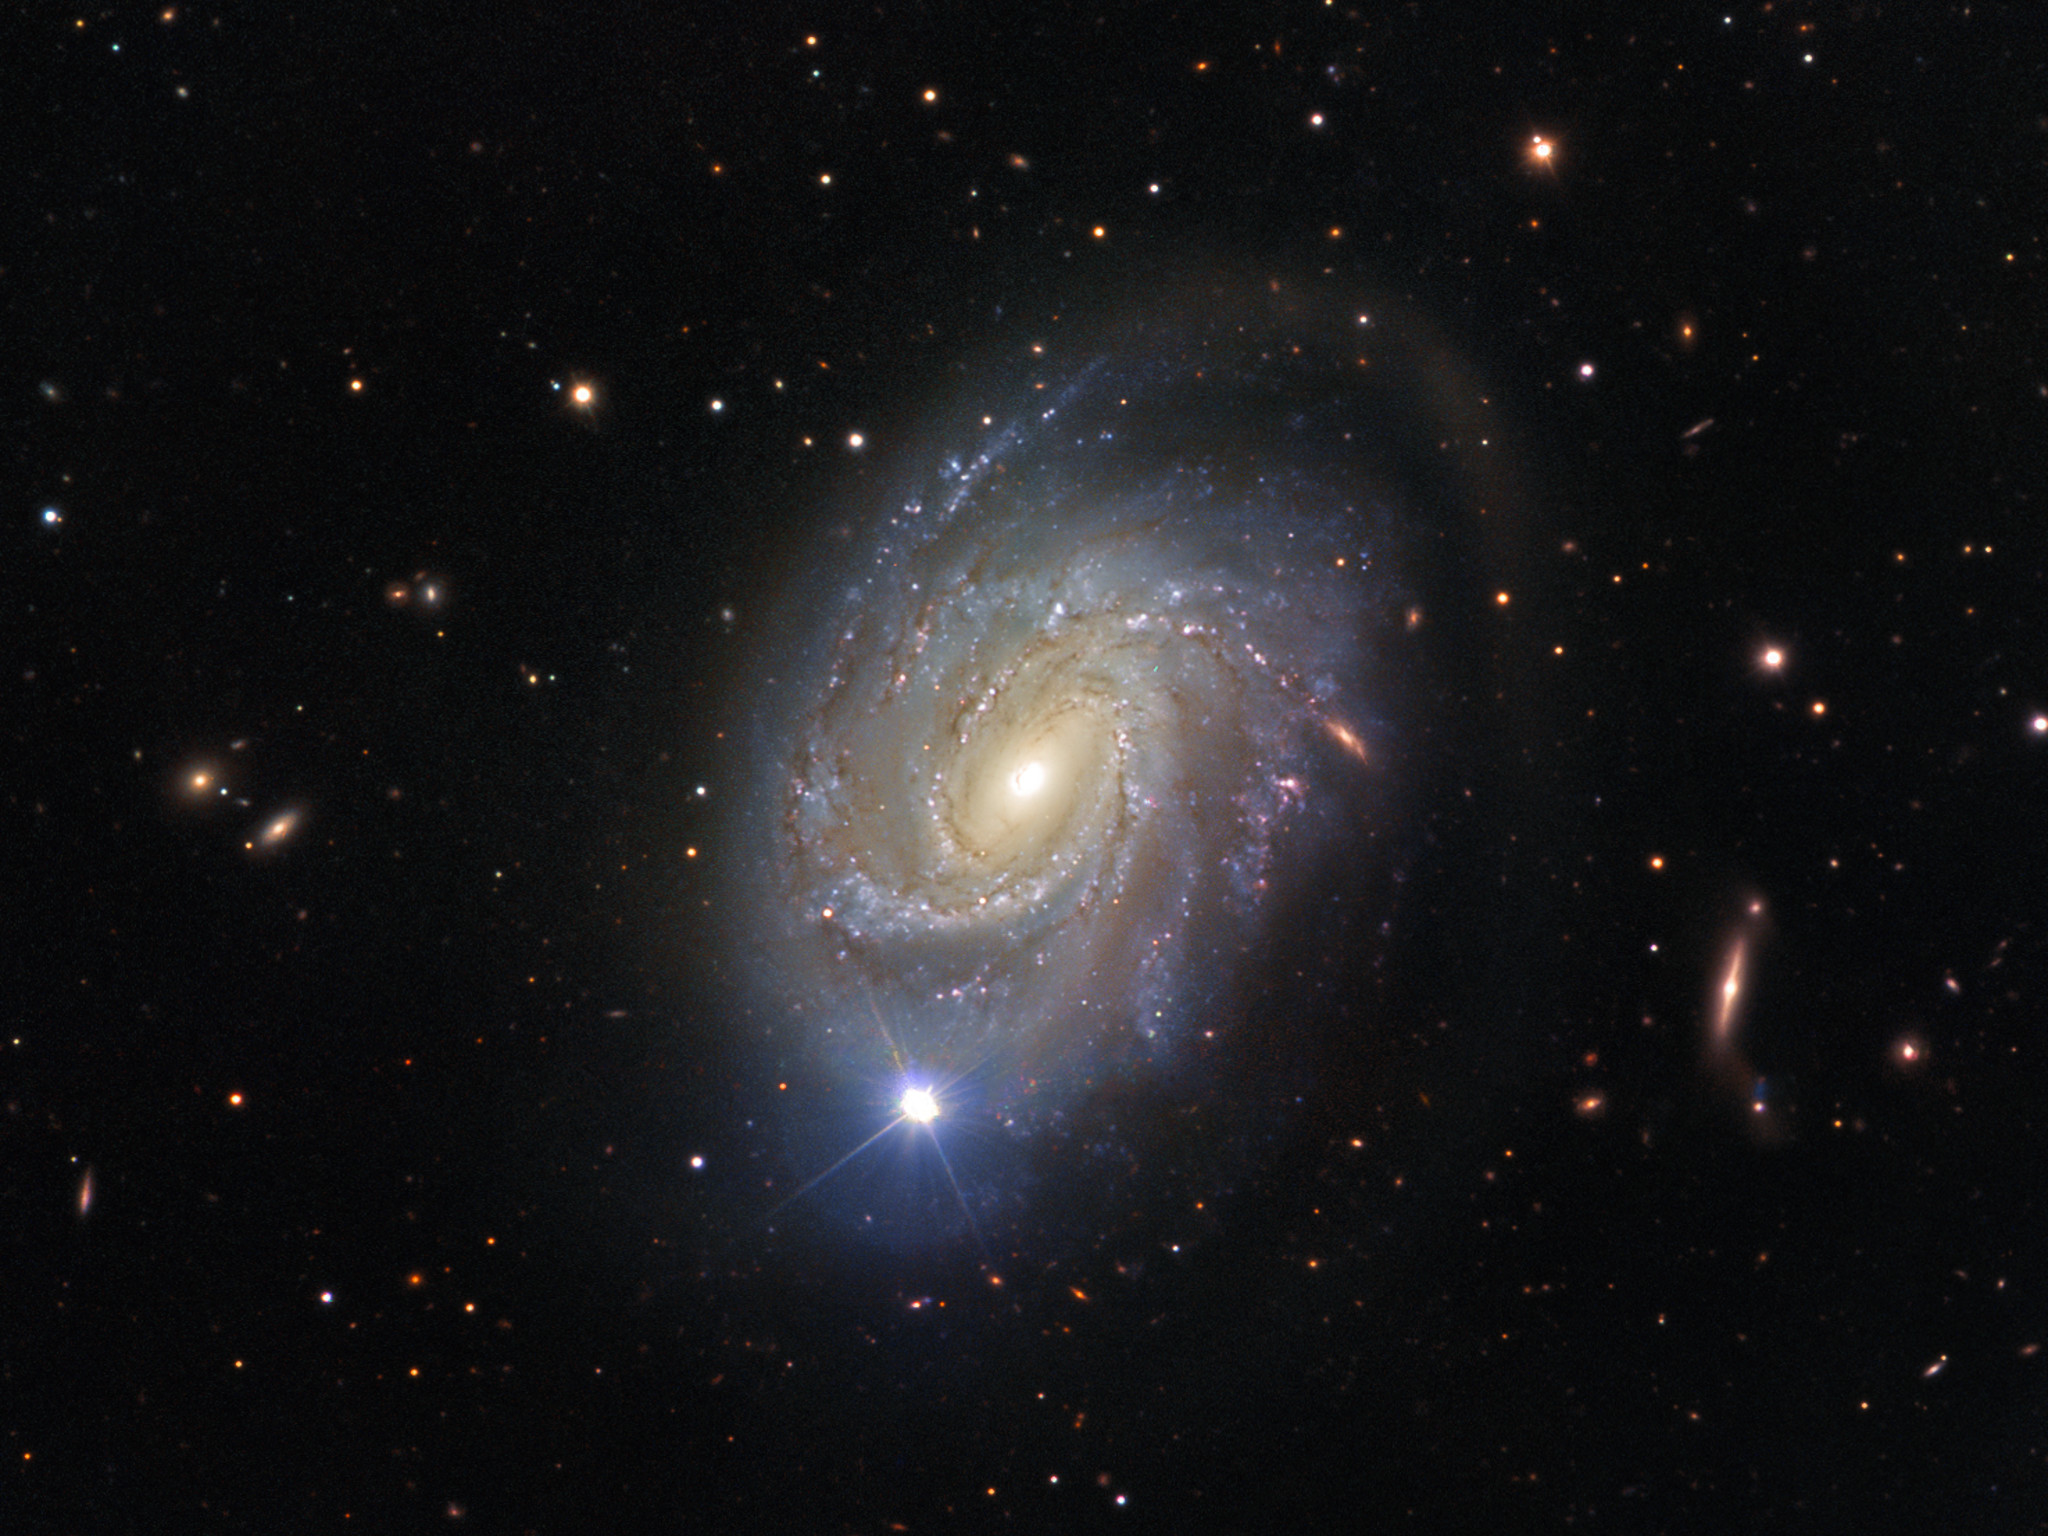
Over 75 million light-years away in the constellation of Virgo (The Virgin) lies NGC 4981 — a spiral galaxy with a rather explosive past.

NGC 4981 was discovered on 17 April 1784 by William Herschel, and subsequently documented in John Dreyer’s New General Catalogue. Over a century later, on 23 April 1968, the galaxy once again made it into the records when a Type la supernova — a stellar explosion in a binary star system — occurred within its confines: SN 1968I. SN 1968I, however, was not to be the galaxy’s only supernova. Decades later, the core collapse of a massive star led to supernova SN 2007c.

This spectacular shot of NGC 4981 — not showing any of the supernovae explosions; the bright star visible in the image is a foreground star — was captured by FORS, the visible and near-UV FOcal Reducer and low dispersion Spectrograph for ESO’s Very Large Telescope (VLT). FORS is the Swiss Army knife of ESO’s instruments — it is able to study many different astronomical objects in many different ways, and is responsible for some of the most iconic photos ever captured with the VLT (see eso9948f and eso0202a).

The data to create this image was selected from the ESO archive by Josh Barrington as part of the Hidden Treasures competition.


Source: ESO/images

Saturday, February 11, 2017

Blue jets studied from Space Station

Blue jets studied from Space Station
Copyright ESA/NAS

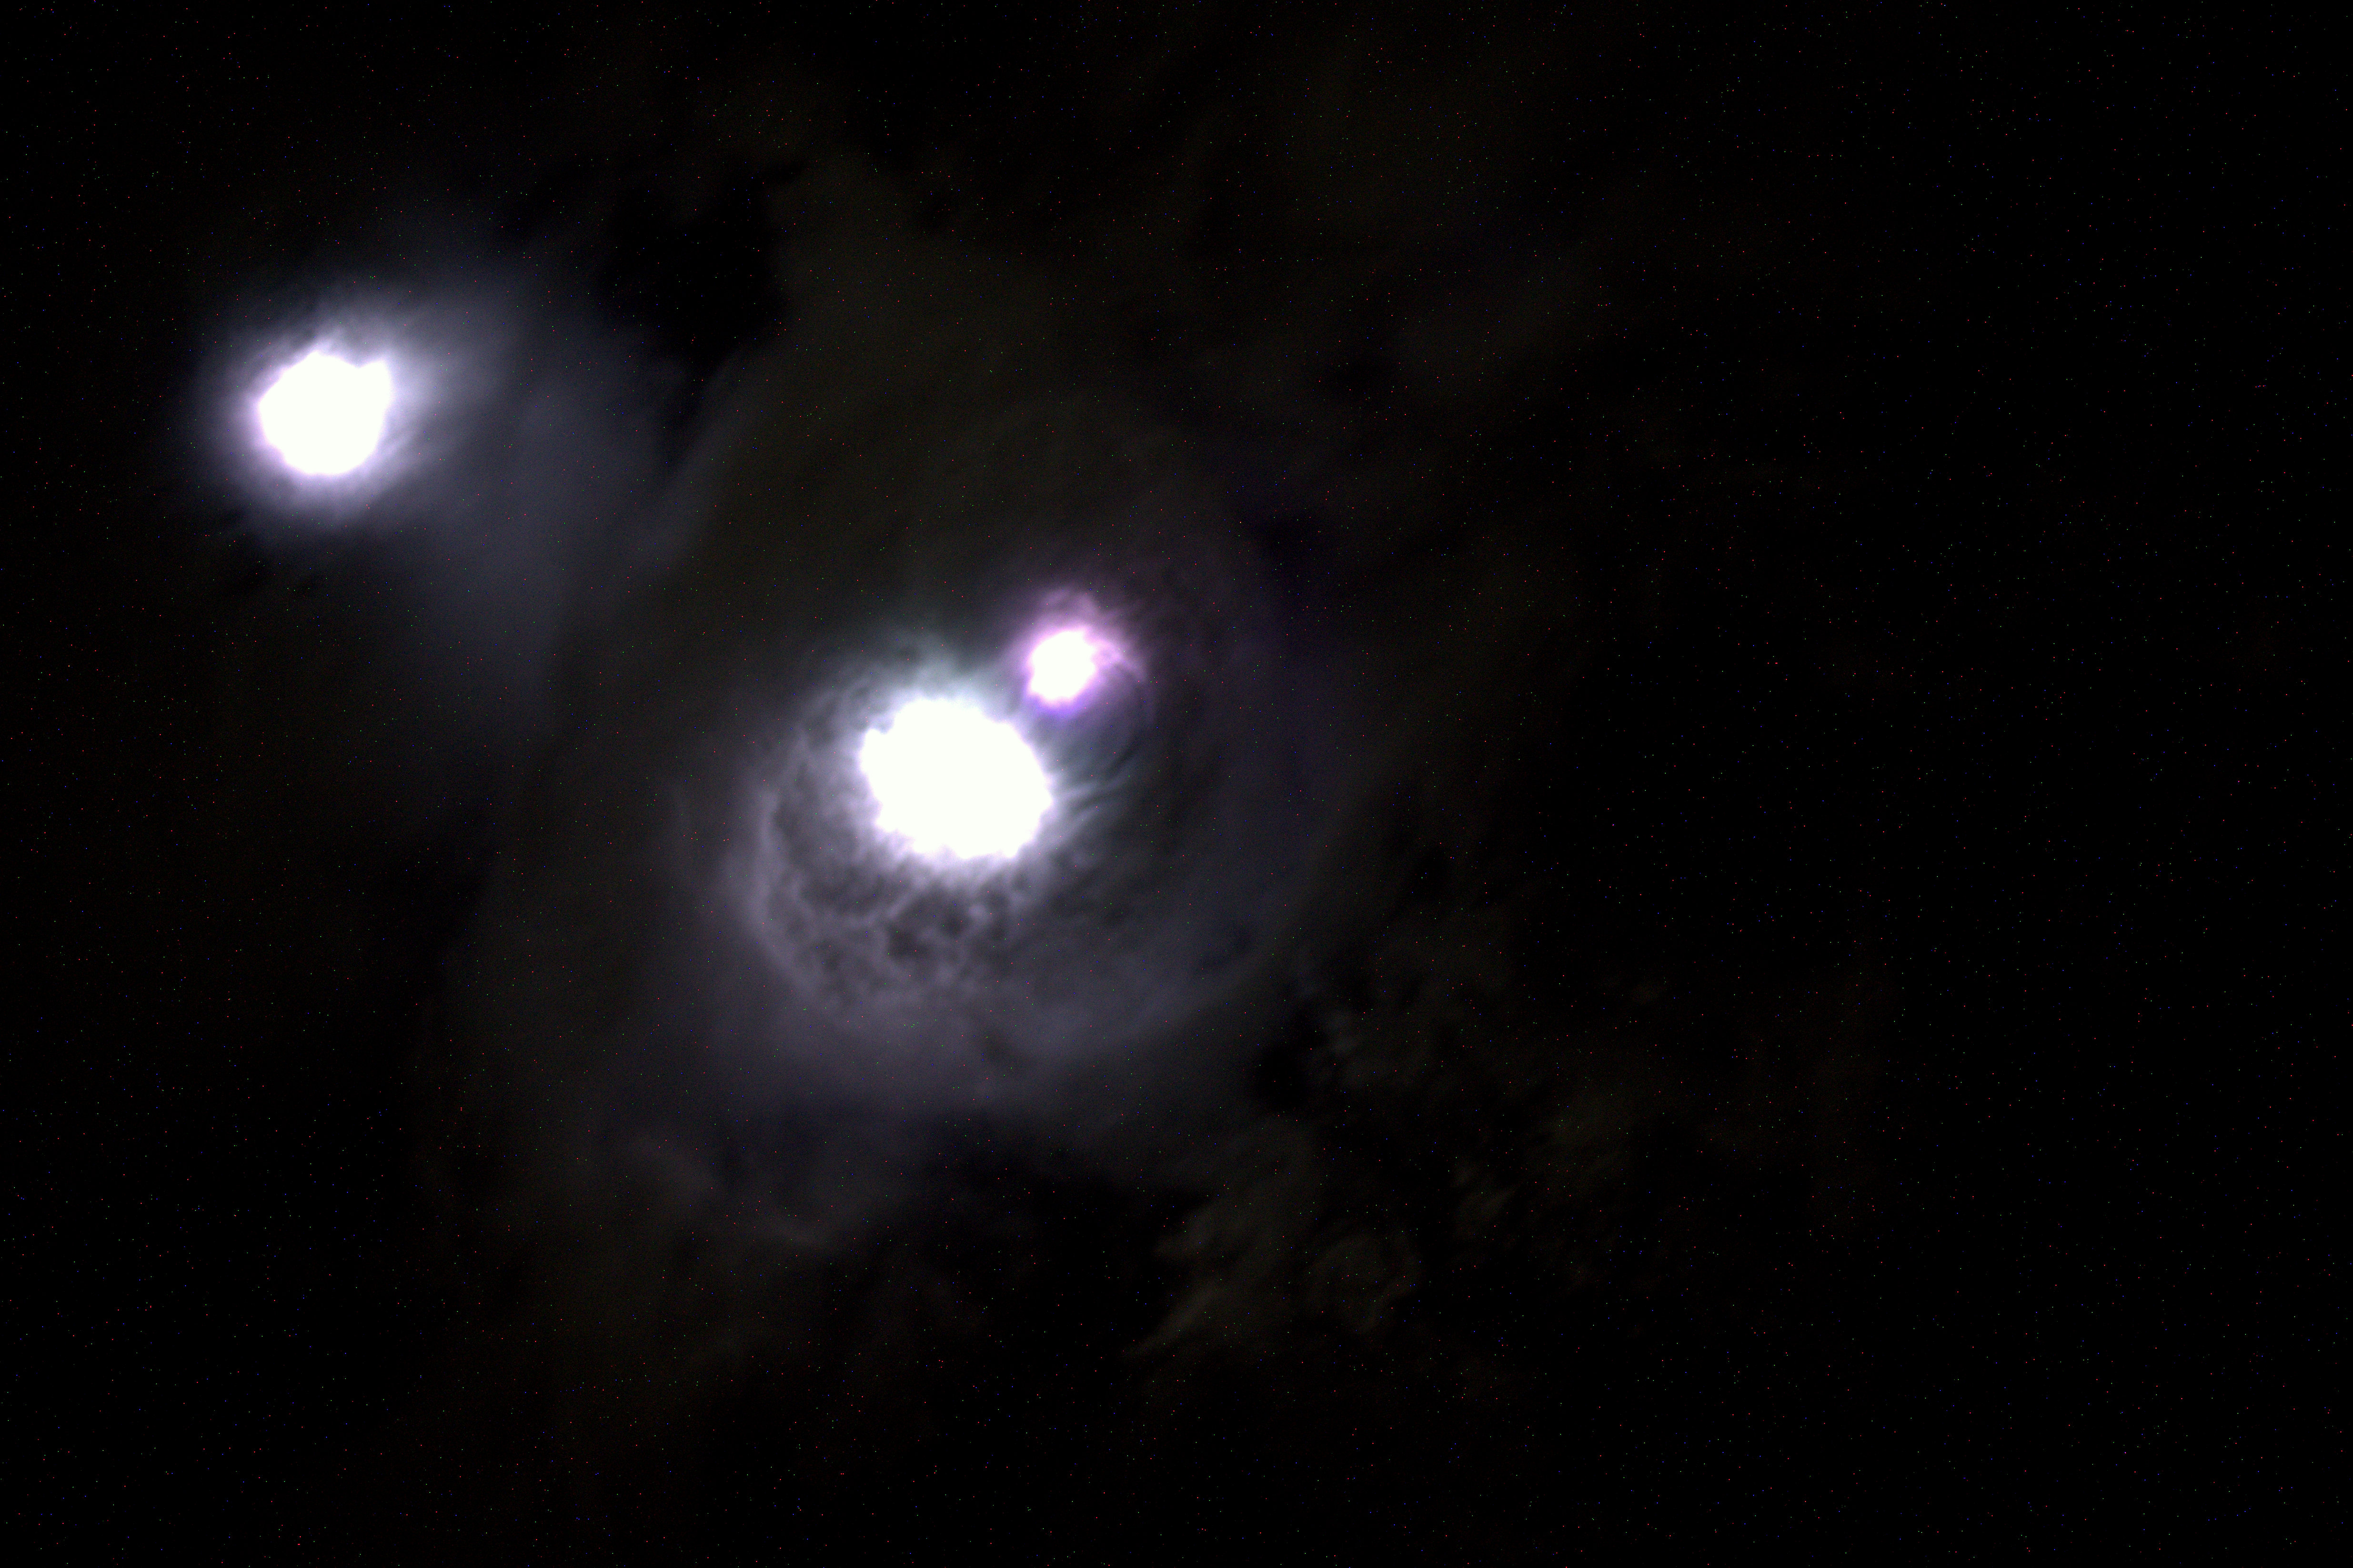
For years, their existence has been debated: elusive electrical discharges in the upper atmosphere that sport names such as red sprites, blue jets, pixies and elves. Reported by pilots, they are difficult to study as they occur above thunderstorms.

ESA astronaut Andreas Mogensen during his mission on the International Space Station in 2015 was asked to take pictures over thunderstorms with the most sensitive camera on the orbiting outpost to look for these brief features.

Denmark’s National Space Institute has now published the results, confirming many kilometre-wide blue flashes around 18 km altitude, including a pulsating blue jet reaching 40 km. A video recorded by Andreas as he flew over the Bay of Bengal at 28 800 km/h on the Station shows the electrical phenomena clearly – a first of its kind.

Andreas Mogensen captures gigantic lightning from the International Space Station
Youtube
 DTUBroadcast
 
Copyright: NASA

Satellites had probed these events but their viewing angle is not ideal for gathering data on the scale of the blue jets and smaller blue discharges. In contrast, the Station’s lower orbit is ideally placed to capture the sprites and jets. 

Andreas aimed for cloud turrets – cloud pillars extending into the upper atmosphere – and shot a 160 second video showing 245 blue flashes from the top of a turret that drifted from the Bay of Bengal’s thunderstorm.  

The blue discharges and jets are examples of a little-understood part of our atmosphere. Electrical storms reach into the stratosphere and have implications for how our atmosphere protects us from radiation.

Copyright: ESA/NASA 

Copyright: ESA

Permanent observation 

This experiment confirms that the Space Station is a suitable base for observing these phenomena. As a follow-up, the Atmosphere–Space Interactions Monitor is being prepared for launch later this year for installation outside Europe’s Columbus laboratory to monitor thunderstorms continuously to gather information about such ‘transient luminous events’.

Andreas concludes, “It is not every day that you get to capture a new weather phenomenon on film, so I am very pleased with the result – but even more so that researchers will be able to investigate these intriguing thunderstorms in more detail soon.

Source: ESA/IRISS

Friday, February 10, 2017

A spiral in Andromeda A spiral in Andromeda

Credit: ESA/Hubble & NASA


Not to be confused with our neighbouring Andromeda Galaxy, the Andromeda constellation is one of the 88 modern constellations. More importantly for this image, it is home to the pictured NGC 7640.

Many different classifications are used to identify galaxies by shape and structure — NGC 7640 is a barred spiral type. These are recognisable by their spiral arms, which fan out not from a circular core, but from an elongated bar cutting through the galaxy’s centre. Our home galaxy, the Milky Way, is also a barred spiral galaxy. NGC 7640 might not look much like a spiral in this image, but this is due to the orientation of the galaxy with respect to Earth — or to Hubble, which acted as photographer in this case! We often do not see galaxies face on, which can make features such as spiral arms less obvious. 

There is evidence that NGC 7640 has experienced some kind of interaction in its past. Galaxies contain vast amounts of mass, and therefore affect one another via gravity. Sometimes these interactions can be mild, and sometimes hugely dramatic, with two or more colliding and merging into a new, bigger galaxy. Understanding the history of a galaxy, and what interactions it has experienced, helps astronomers to improve their understanding of how galaxies — and the stars within them — form.

Source: ESA/ News

Thursday, February 09, 2017

Protostar displays a strange geometry


Figure 1: Integrated intensity distribution of CCH, superposed on the 0.8 mm dust continuum map. The infalling rotating envelope traced by CCH is broadened inward of the radius of about 150 au.Credit: Sakai et al. (RIKEN) .  Click to enlarge


One of the big puzzles in astrophysics is how stars like the sun manage to form from collapsing molecular clouds in star-forming regions of the universe. The puzzle is known technically as the angular momentum problem in stellar formation. The problem essentially is that the gas in the star-forming cloud have some rotation, which gives each element of the gas an amount of angular momentum. As they collapse inward, eventually they reach a state where the gravitational pull of the nascent star is balanced by the centrifugal force, so that they will no longer collapse inward of a certain radius unless they can shed some of the angular momentum. This point is known as the centrifugal barrier.

Now, using measurements taken by radio antennas, a group led by Nami Sakai of the RIKEN Star and Planet Formation Laboratory has found clues as to how the gas in the cloud can find their way to the forming star. To gain a better understanding of the process, Sakai and her group turned to the ALMA observatory, a network of 66 radio dishes located high in the Atacama Desert of northern Chile. The dishes are connected together in a carefully choreographed configuration so that they can provide images on radio emissions from protostellar regions around the sky. 

The group chose to observe a protostar designated as L1527, located in a nearby star-forming region known as the Taurus Molecular Cloud. The protostar, located about 450 light years away, has a spinning protoplanetary disk, almost edge-on to our view, embedded in a large envelope of molecules and dust. 

Previously, Sakai had discovered, from observations of molecules around the same protostar, that unlike the commonly held hypothesis, the transition from envelope to the inner disk--which later forms into planets--was not smooth but very complex. "As we looked at the observational data," says Sakai, "we realized that the region near the centrifugal barrier--where particles can no longer infall--is quite complex, and we realized that analyzing the movements in this transition zone could be crucial for understanding how the envelope collapses. Our observations showed that there is a broadening of the envelope at that place, indicating something like a 'traffic jam' in the region just outside the centrifugal barrier, where the gas heats up as the result of a shock wave. It became clear from the observations that a significant part of the angular momentum is lost by gas being cast in the vertical direction from the flattened protoplanetary disk that formed around the protostar."

Figure 2: Artist's impression of L1527
Credit: RIKEN 

This behavior accorded well with calculations the group had done using a purely ballistic model, where the particles behave like simple projectiles that do not need to be influenced by magnetic or other forces. 

According to Sakai, "We plan to continue to use observations from the powerful ALMA array to further refine our understanding of the dynamics of stellar formation and fully explain how matter collapses onto the forming star. This work could also help us to better understand the evolution of our own solar system."


Paper and Research team

These observation results were published as Sakai et al. "Vertical Structure of the Transition Zone from Infalling Rotating Envelope to Disk in the Class 0 Protostar, IRAS04368+2557" in the Monthly Notices of the Royal Astronomical Society in February 2017.

The research team members are:

Nami Sakai (The Institute of Physical and Chemical Research (RIKEN)), Yoko Oya (The University of Tokyo), Aya E. Higuchi (RIKEN), Yuri Aikawa (University of Tsukuba), Tomoyuki Hanawa (Chiba University), Cecilia Ceccarelli (Laboratoire d'Astrophysique de Grenoble), B. Lefloch (Laboratoire d'Astrophysique de Grenoble), Ana López-Sepulcre (The University of Tokyo / Institut de Radioastronomie Millimétrique), Yoshimasa Watanabe (The University of Tokyo), Takeshi Sakai (The University of Electro-Communications), Tomoya Hirota (National Astronomical Observatory of Japan), Emmanuel Caux (Universite de Toulouse), Charlotte Vastel (Universite de Toulouse), Claudine Kahane (Laboratoire d'Astrophysique de Grenoble), Satoshi Yamamoto (The University of Tokyo)

This research was supported by a Grant-in-Aid from the Japan Society for the Promotion of Science and the Ministry of Education, Culture, Sports, Science and Technology, Japan (No. 25400223, 25108005, 16H03964).

ALMA array from the air
Credit: Clem & Adri Bacri-Normier (wingsforscience.com)/ESO


ALMA


The Atacama Large Millimeter/submillimeter Array (ALMA), an international astronomy facility, is a partnership of the European Organisation for Astronomical Research in the Southern Hemisphere (ESO), the U.S. National Science Foundation (NSF) and the National Institutes of Natural Sciences (NINS) of Japan in cooperation with the Republic of Chile. ALMA is funded by ESO on behalf of its Member States, by NSF in cooperation with the National Research Council of Canada (NRC) and the National Science Council of Taiwan (NSC) and by NINS in cooperation with the Academia Sinica (AS) in Taiwan and the Korea Astronomy and Space Science Institute (KASI).

ALMA construction and operations are led by ESO on behalf of its Member States; by the National Radio Astronomy Observatory (NRAO), managed by Associated Universities, Inc. (AUI), on behalf of North America; and by the National Astronomical Observatory of Japan (NAOJ) on behalf of East Asia. The Joint ALMA Observatory (JAO) provides the unified leadership and management of the construction, commissioning and operation of ALMA.


Wednesday, February 08, 2017

NASA Finds Planets of Red Dwarf Stars May Face Oxygen Loss in Habitable Zones

In this artist’s concept, X-ray and extreme ultraviolet light from a young red dwarf star cause ions to escape from an exoplanet’s atmosphere. Scientists have developed a model that estimates the oxygen ion escape rate on planets around red dwarfs, which plays an important role in determining an exoplanet’s habitability. Credits: NASA Goddard/Conceptual Image Lab, Michael Lentz, animator/Genna Duberstein, producer. Download this video in HD formats from NASA Goddard's Scientific Visualization Studio


The search for life beyond Earth starts in habitable zones, the regions around stars where conditions could potentially allow liquid water – which is essential for life as we know it – to pool on a planet’s surface. New NASA research suggests some of these zones might not actually be able to support life due to frequent stellar eruptions – which spew huge amounts of stellar material and radiation out into space – from young red dwarf stars.

Now, an interdisciplinary team of NASA scientists wants to expand how habitable zones are defined, taking into account the impact of stellar activity, which can threaten an exoplanet’s atmosphere with oxygen loss. This research was published in The Astrophysical Journal Letters on Feb. 6, 2017.

"If we want to find an exoplanet that can develop and sustain life, we must figure out which stars make the best parents,” said Vladimir Airapetian, lead author of the paper and a solar scientist at NASA’s Goddard Space Flight Center in Greenbelt, Maryland. “We’re coming closer to understanding what kind of parent stars we need.”

To determine a star’s habitable zone, scientists have traditionally considered how much heat and light the star emits. Stars more massive than our sun produce more heat and light, so the habitable zone must be farther out. Smaller, cooler stars yield close-in habitable zones.

But along with heat and visible light, stars emit X-ray and ultraviolet radiation, and produce stellar eruptions such as flares and coronal mass ejections – collectively called space weather. One possible effect of this radiation is atmospheric erosion, in which high-energy particles drag atmospheric molecules – such as hydrogen and oxygen, the two ingredients for water – out into space. Airapetian and his team's new model for habitable zones now takes this effect into account.

The search for habitable planets often hones in on red dwarfs, as these are the coolest, smallest and most numerous stars in the universe – and therefore relatively amenable to small planet detection.

"On the downside, red dwarfs are also prone to more frequent and powerful stellar eruptions than the sun," said William Danchi, a Goddard astronomer and co-author of the paper. "To assess the habitability of planets around these stars, we need to understand how these various effects balance out."

Another important habitability factor is a star's age, say the scientists, based on observations they've gathered from NASA’s Kepler mission. Every day, young stars produce superflares, powerful flares and eruptions at least 10 times more powerful than those observed on the sun. On their older, matured counterparts resembling our middle-aged sun today, such superflares are only observed once every 100 years.

“When we look at young red dwarfs in our galaxy, we see they’re much less luminous than our sun today,” Airapetian said. “By the classical definition, the habitable zone around red dwarfs must be 10 to 20 times closer-in than Earth is to the sun. Now we know these red dwarf stars generate a lot of X-ray and extreme ultraviolet emissions at the habitable zones of exoplanets through frequent flares and stellar storms.”

Superflares cause atmospheric erosion when high-energy X-ray and extreme ultraviolet emissions first break molecules into atoms and then ionize atmospheric gases. During ionization, radiation strikes the atoms and knocks off electrons. Electrons are much lighter than the newly formed ions, so they escape gravity’s pull far more readily and race out into space.

Opposites attract, so as more and more negatively charged electrons are generated, they create a powerful charge separation that lures positively charged ions out of the atmosphere in a process called ion escape.

“We know oxygen ion escape happens on Earth at a smaller scale since the sun exhibits only a fraction of the activity of younger stars,” said Alex Glocer, a Goddard astrophysicist and co-author of the paper. “To see how this effect scales when you get more high-energy input like you’d see from young stars, we developed a model.”

The model estimates the oxygen escape on planets around red dwarfs, assuming they don’t compensate with volcanic activity or comet bombardment. Various earlier atmospheric erosion models indicated hydrogen is most vulnerable to ion escape. As the lightest element, hydrogen easily escapes into space, presumably leaving behind an atmosphere rich with heavier elements such as oxygen and nitrogen.

But when the scientists accounted for superflares, their new model indicates the violent storms of young red dwarfs generate enough high-energy radiation to enable the escape of even oxygen and nitrogen – building blocks for life’s essential molecules. 

“The more X-ray and extreme ultraviolet energy there is, the more electrons are generated and the stronger the ion escape effect becomes,” Glocer said. “This effect is very sensitive to the amount of energy the star emits, which means it must play a strong role in determining what is and is not a habitable planet.”

Considering oxygen escape alone, the model estimates a young red dwarf could render a close-in exoplanet uninhabitable within a few tens to a hundred million years. The loss of both atmospheric hydrogen and oxygen would reduce and eliminate the planet’s water supply before life would have a chance to develop.

“The results of this work could have profound implications for the atmospheric chemistry of these worlds,” said Shawn Domagal-Goldman, a Goddard space scientist not involved with the study. “The team’s conclusions will impact our ongoing studies of missions that would search for signs of life in the chemical composition of those atmospheres.”

Modeling the oxygen loss rate is the first step in the team’s efforts to expand the classical definition of habitability into what they call space weather-affected habitable zones. When exoplanets orbit a mature star with a mild space weather environment, the classical definition is sufficient. When the host star exhibits X-ray and extreme ultraviolet levels greater than seven to 10 times the average emissions from our sun, then the new definition applies. The team’s future work will include modeling nitrogen escape, which may be comparable to oxygen escape since nitrogen is just slightly lighter than oxygen.

The new habitability model has implications for the recently discovered planet orbiting the red dwarf Proxima Centauri, our nearest stellar neighbor. Airapetian and his team applied their model to the roughly Earth-sized planet, dubbed Proxima b, which orbits Proxima Centauri 20 times closer than Earth is to the sun.

Considering the host star’s age and the planet’s proximity to its host star, the scientists expect that Proxima b is subjected to torrents of X-ray and extreme ultraviolet radiation from superflares occurring roughly every two hours. They estimate oxygen would escape Proxima b’s atmosphere in 10 million years. Additionally, intense magnetic activity and stellar wind – the continuous flow of charged particles from a star – exacerbate already harsh space weather conditions. The scientists concluded that it’s quite unlikely Proxima b is habitable.   

“We have pessimistic results for planets around young red dwarfs in this study, but we also have a better understanding of which stars have good prospects for habitability,” Airapetian said. “As we learn more about what we need from a host star, it seems more and more that our sun is just one of those perfect parent stars, to have supported life on Earth.”


Related:


Editor: Rob Garner


Tuesday, February 07, 2017

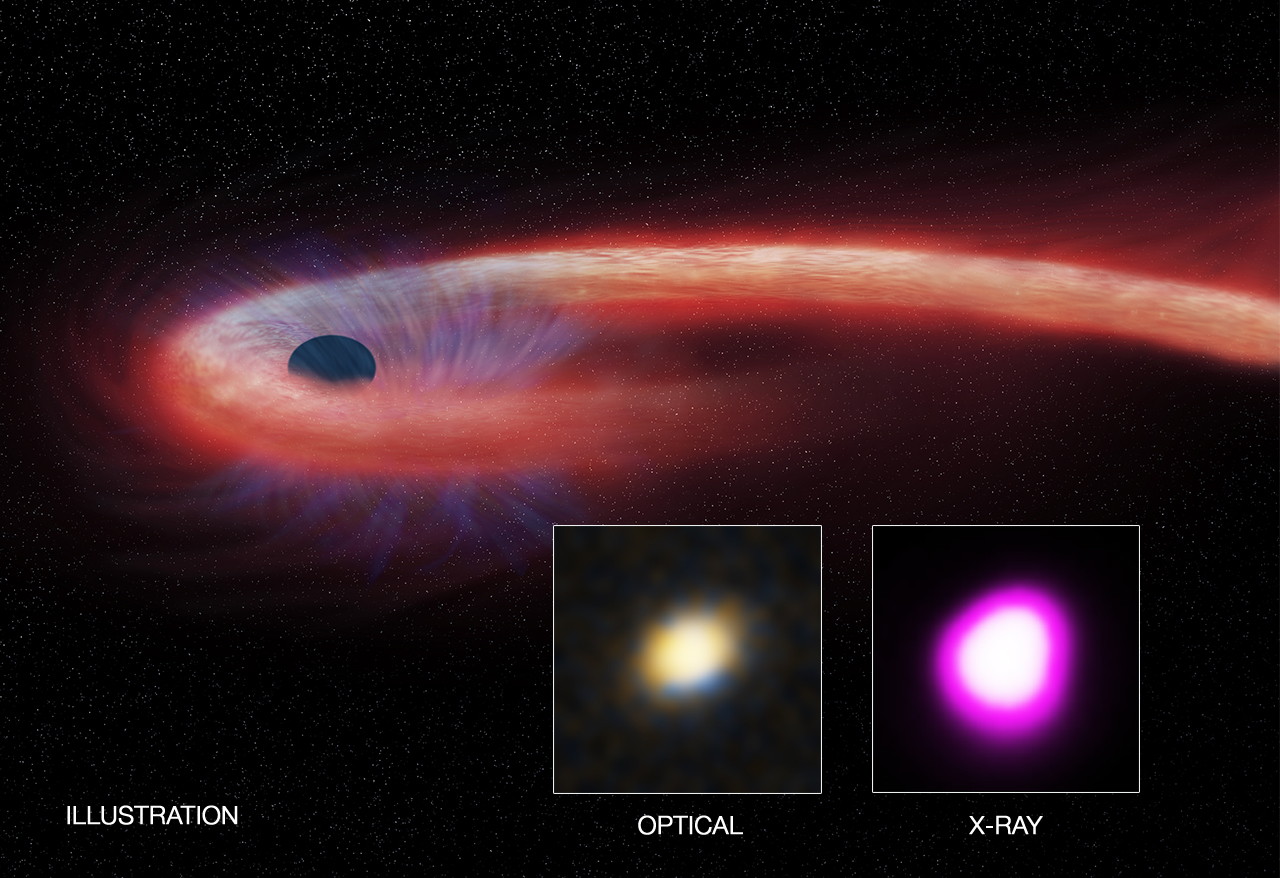
XJ1500+0154: Black Hole Meal Sets Record for Length and Size

XJ1500+0154
Credit: X-ray: NASA/CXC/UNH/D.Lin et al, Optical: CFHT,
 Illustration: NASA/CXC/M.Weiss


A Quick Look at XJ1500+0154

A trio of X-ray observatories has captured a remarkable event in their data: a decade-long binge by a black hole almost two billion light years away. This discovery was made using data from NASA's Chandra X-ray Observatory, Swift Observatory, and ESA's XMM-Newton, as reported in our press release

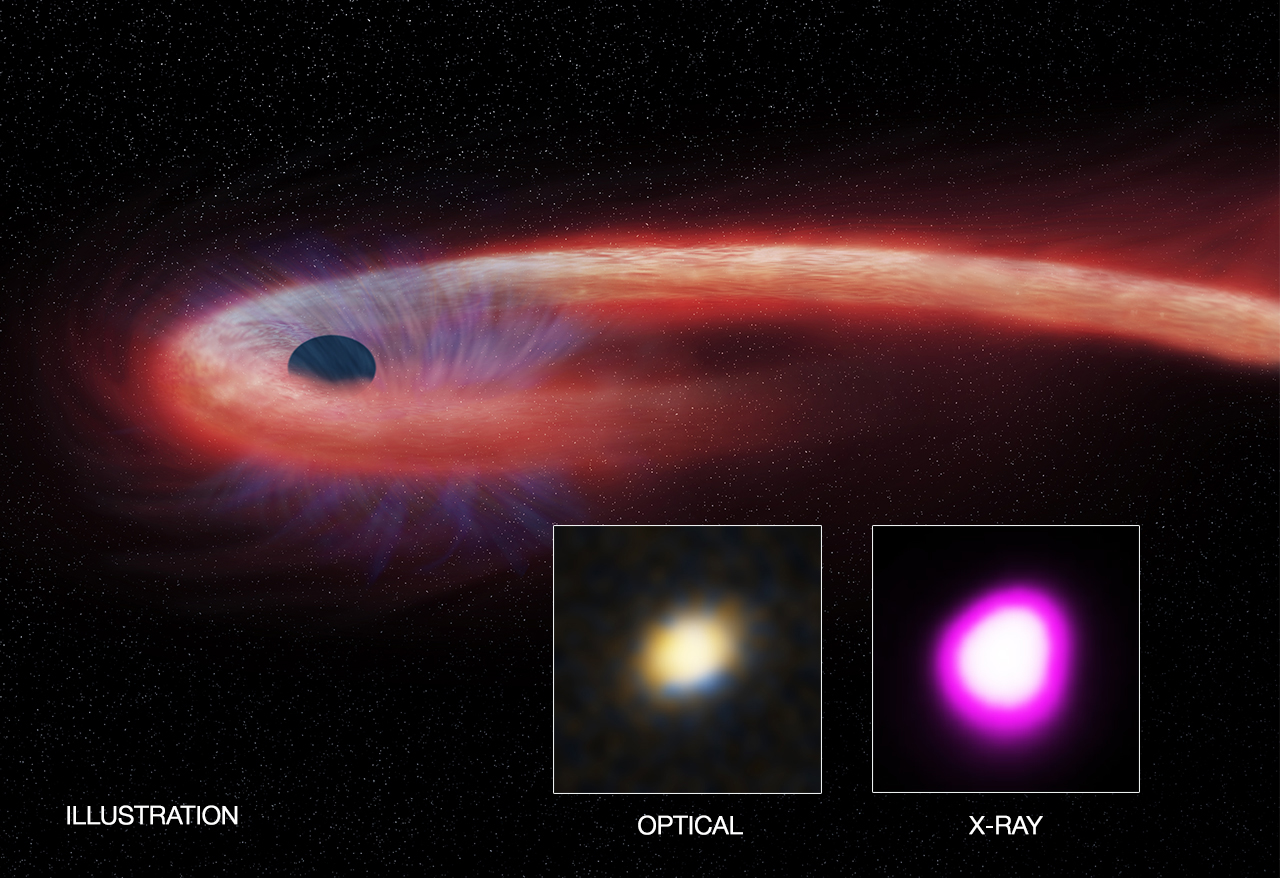
This artist's illustration depicts what astronomers call a "tidal disruption event," or TDE. This is when an object, such as a star, wanders too close to a black hole and is destroyed by tidal forces generated from the black hole's intense gravitational forces. During a TDE, some of the stellar debris is flung outward at high speeds, while the rest (shown as the red material in the illustration) becomes hotter as it falls toward the black hole, generating a distinct X-ray flare. A wind blowing away from this infalling material is shown in blue. 

Among observed TDEs, this event involved either the most massive star to be completely ripped apart and devoured by a black hole or the first instance where a smaller star was completely ripped apart. The resulting X-ray source is known as XJ1500+154 and is located in a small galaxy about 1.8 billion light years from Earth. The optical image in the left inset shows this galaxy and a cross to mark the location of XJ1500+0154. This image reveals that XJ1500+0154 is found in the center of the galaxy, implying that the source likely originates from a supermassive black hole that resides there. The image on the right shows XJ1500+0154 in the Chandra image covering the same field. 

The source was not detected in a Chandra observation on April 2, 2005, but was detected in an XMM-Newton observation on July 23, 2005, and reached peak brightness in a Chandra observation on June 5, 2008. These observations show that the source became at least 100 times brighter in X-rays. Since then, Chandra, Swift, and XMM-Newton have observed it multiple times. 

The X-ray data also indicate that radiation from material surrounding this black hole has consistently surpassed the so-called Eddington limit, defined by a balance between the outward pressure of radiation from the hot gas and the inward pull of the gravity of the black hole.

This TDE may help answer the question as to how supermassive black holes in the early universe grow. If supermassive black holes can grow, from TDEs or other means, at rates above those corresponding to the Eddington limit, this could explain how supermassive black holes were able to reach masses about a billion times higher than the sun when the universe was only about a billion years old. 

A paper describing these results appears in the February 6th issue of Nature Astronomy. The authors are Dacheng Lin (University of New Hampshire), James Guillochon (Harvard-Smithsonian Center for Astrophysics), Stefanie Komossa (QianNan Normal University for Nationalities), Enrico Ramirez-Ruiz (University of California, Santa Cruz), Jimmy Irwin (University of Alabama), Peter Maksym (Harvard-Smithsonian), Dirk Grupe (Morehead State University), Olivier Godet (CNRS), Natalie Webb (CNRS), Didier Barret (CNRS), Ashley Zauderer (New York University), Pierre-Alain Duc (CEA-Saclay), Eleazar Carrasco (Gemini Observatory), and Stephen Gwyn (Herzberg Institute of Astrophysics). 

NASA's Marshall Space Flight Center in Huntsville, Alabama, manages the Chandra program for NASA's Science Mission Directorate in Washington. The Smithsonian Astrophysical Observatory in Cambridge, Massachusetts, controls Chandra's science and flight operations.


Fast Facts for XJ1500+0154:

Scale: Inset images are 11 arcsec across (about about 92,000 light years)
Category: Quasars & Active Galaxies
Coordinates (J2000): RA 15h 00m 52.10s | Dec Dec: +01 54 53.00
Constellation: Virgo
Observation Date: 23 Feb 2015
Observation Time: 10 hours
Obs. ID: 6601
Instrument: ACIS
References: Lin, D. et al, 2017, Nature Astronomy (accepted)
Color Code: X-ray (Pink); Optical (Red, Green, Blue)  
Distance Estimate: About 1.8 billion light years