Thursday, January 31, 2013

Stars can be late parents

Weighing the planet-forming disc around a nearby star 

Using the unique capabilities of ESA’s Herschel space observatory, astronomers have accurately ‘weighed’ a star’s disc, finding it still has enough mass to spawn 50 Jupiter-sized planets, several million years after most other stars have already given birth.

Proto-planetary discs contain all the raw ingredients for building planets. They are composed mainly of cold molecular hydrogen gas, which is highly transparent and essentially invisible.

Usually, it is much easier to measure the emission from ‘contaminants’ such as the small fraction of dust mixed in the gas, or other gas constituents, to make estimates of the total disc mass.

In the past, this technique has caused significant uncertainties in the estimations of molecular hydrogen mass, but thanks to the far-infrared wavelength capabilities and sensitivity of Herschel, astronomers have used a new, more accurate method, using a close relative of molecular hydrogen called hydrogen deuteride, or ‘heavy’ molecular hydrogen.

Since the ratio of ‘normal’ and ‘heavy’ molecular hydrogen gas is extremely well known from measurements in our local solar neighbourhood, this approach provides a means to ‘weigh’ a star’s total disc mass with ten times higher accuracy than ever before.

Using this technique, a substantial mass of gas was detected in a disc encircling TW Hydrae, a young star just 176 light-years away in the constellation of Hydra.

“We did not expect to find so much gas around this 10-million-year-old star,” says Professor Edwin Bergin of the University of Michigan, lead author of the report published in Nature.

“This star has significantly more mass than required to make our own Solar System and could make a much more exotic system with planets more massive than Jupiter.”

Observing such a massive disc around TW Hydrae is unusual for stars of this age because, within a few million years, most material is typically incorporated into the central star or giant planets, or has been swept away by its strong stellar wind.

“With a more refined mass, we can learn more about this system in terms of its planet-bearing potential and the availability of ingredients that might be able to support a planet with life,” adds Professor Bergin.

Indeed, in a separate Herschel survey, scientists had already identified TW Hydrae as a star with a disc that contains enough water to fill the equivalent of several thousand Earth oceans.

The new method of ‘weighing’ a disc means that the volume of materials available – including water – could have been underestimated, in this system and in others.

A re-evaluation of the masses of discs around other stars of varying ages will provide more insight into the planet-building process. 

“There may be different outcomes regarding planet formation for systems of varying ages,” says co-author Professor Thomas Henning of the Max Planck Institute for Astronomy, Germany.

“Just as the ages at which people have children span a range, TW Hydrae seems to lie at the edge of that range for stars, showing that this particular system may have needed longer to form planets, and that it might be a late parent.”

“The detection of heavy molecular hydrogen was made possible thanks to the new observing capabilities offered by Herschel, providing this leap forward in weighing the disc around this star,” adds Göran Pilbratt, ESA’s Herschel project scientist.


“An old disk that can still form a planetary system,” by E. Bergin et al, is published in Nature, 31 January 2013. 
The survey was conducted as part of an open time Herschel Programme using the Photoconductor Array Camera and Spectrometer (PACS), which operates in the wavelength range 55–210 microns. 
Herschel is an ESA space observatory with science instruments provided by European-led Principal Investigator consortia and with important participation from NASA. PACS was designed and built by a nationally funded consortium led by the Max Planck Institute for Extraterrestrial Physics (Garching, Germany); the consortium includes institutes from Belgium, Austria, France, Italy and Spain. 

For further information, please contact:
 
Markus Bauer
ESA Science and Robotic Exploration Communication Officer
Tel: +31 71 565 6799
Mob: +31 61 594 3 954
Email: markus.bauer@esa.int

Edwin Bergin
University of Michigan, USA
Email: ebergin@umich.edu

Thomas Henning
Max-Planck-Institut für Astronomie, Germany
Email: henning@mpia.de

Göran Pilbratt
ESA Herschel Project Scientist
Tel: +31 71 565 3621

Email: gpilbratt@rssd.esa.int

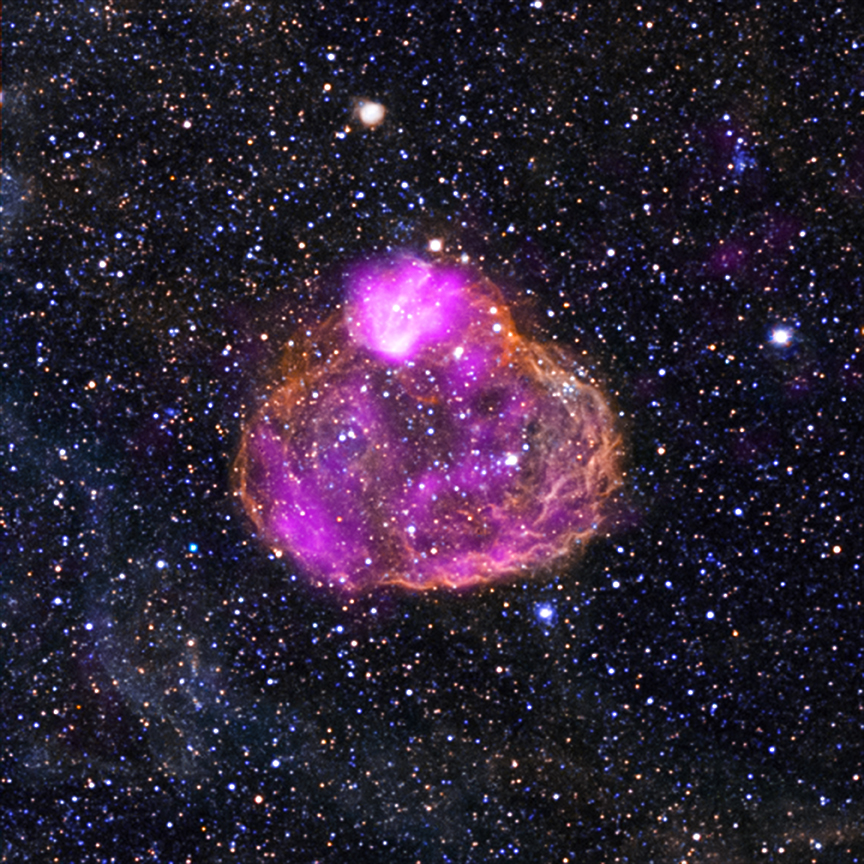
Giant, Magnetized Outflows from our Galactic Center

 A false-color image of our Milky Way as seen in a projection that shows the galactic center at the center of the image, the plane of the galaxy stretching across the central band, and the two arc-shaped radio lobes of emission seen extending north and south of the plane. Several of the newly discovered magnetic structures are labeled.  Credit: Carretti et al., and Nature.  Low Resolution Image (jpg)

Two years ago, CfA astronomers reported the discovery of giant, twin lobes of gamma-ray emission protruding about 50,000 light-years above and below the plane of our Milky Way galaxy, and centered on the supermassive black hole at our galaxy's core. The scientists argued then that the bubbles were produced either by an eruption from the black hole sometime in the past, or else by a burst of star formation in that vicinity. 

It now appears that these giant bubbles of hot gas can be seen at radio wavelengths as well. Writing in the new issue of the journal Nature, CfA astronomer Gianni Bernardi and eight of his colleagues describe finding humongous lobes of radio emission emanating from the Galactic Center. Moreover, the emission is polarized, a general property that electromagnetic radiation can have; some sunglasses take advantage of the fact that reflected sunlight becomes polarized. In the case of radio wavelengths, the explanation for polarization is the presence of strong magnetic fields. 

The scientists calculate that the radio lobes, which closely match the gamma-ray lobes in overall dimensions but which contain three ridge-like substructures, are probably polarized by the presence of strong magnetic fields that extend out of the galactic plane in both directions for tens of thousands of light-years, and which contain an energy roughly equivalent to the total current output of the Sun for a time equal to the lifetime of the universe. They argue that the activity is driven by star-formation activity, rather than black-hole activity, and that it originates in a region around the Galactic Center about 650 light-years in size. Not least, the scientists argue that the ridges seen in the magnetically-shaped outflow are the result of several episodes of star-formation that constitute a phonograph-like record of star formation in this region over at least the past ten million years. 


Wednesday, January 30, 2013

When a planet behaves like a comet

 Comet-like ionosphere at Venus
Copyright ESA/Wei et al. (2012)

ESA’s Venus Express has made unique observations of Venus during a period of reduced solar wind pressure, discovering that the planet’s ionosphere balloons out like a comet’s tail on its nightside.   

The ionosphere is a region of weakly electrically charged gas high above the main body of a planet’s atmosphere. Its shape and density are partly controlled by the internal magnetic field of the planet. 

For Earth, which has a strong magnetic field, the ionosphere is relatively stable under a range of solar wind conditions. By comparison, Venus does not have its own internal magnetic field and relies instead on interactions with the solar wind to shape its ionosphere. 

The extent to which this shaping depends on the strength of the solar wind has been controversial, but new results from Venus Express reveal for the first time the effect of a very low solar wind pressure on the ionosphere of an unmagnetised planet. 

The observations were made in August 2010 when NASA’s Stereo-B spacecraft measured a drop in solar wind density to 0.1 particles per cubic centimetre, around 50 times lower than normally observed; this persisted for about 18 hours.  

As this significantly reduced solar wind hit Venus, Venus Express saw the planet’s ionosphere balloon outwards on the planet’s ‘downwind’ nightside, much like the shape of the ion tail seen streaming from a comet under similar conditions. 

“The teardrop-shaped ionosphere began forming within 30–60 minutes after the normal high pressure solar wind diminished. Over two Earth days, it had stretched to at least two Venus radii into space,” says Yong Wei of the Max Planck Institute for Solar System Research in Germany, lead author of the new findings.
The new observations settle a debate about how the strength of the solar wind affects the way in which ionospheric plasma is transported from the dayside to the nightside of Venus.
Usually, this material flows along a thin channel in the ionosphere, but scientists were unsure what happens under low solar wind conditions. Does the flow of plasma particles increase as the channel widens due to the reduced confining pressure, or does it decrease because less force is available to push plasma through the channel?
“We now finally know that the first effect outweighs the second, and that the ionosphere expands significantly during low solar wind density conditions,” says Markus Fraenz, also of the Max Planck Institute and co-author on the paper. 

A similar effect is also expected to occur around Mars, the other non-magnetised planet in our inner Solar System. 

“We often talk about the effects of solar wind interaction with planetary atmospheres during periods of intense solar activity, but Venus Express has shown us that even when there is a reduced solar wind, the Sun can still significantly influence the environment of our planetary neighbours,” adds Håkan Svedhem, ESA’s Venus Express project scientist. 


 “A teardrop-shaped ionosphere at Venus in tenuous solar wind” by Y. Wei et al is published in Planetary and Space Science 73, 2012. 

For further information, please contact:
 
Markus Bauer 


ESA Science and Robotic Exploration Communication Officer


Tel: +31 71 565 6799 


Mob: +31 61 594 3 954 


Email: markus.bauer@esa.int


Yong Wei
Max Planck Institute for Solar System Research
E-mail: wei@mps.mpg.de

Markus Fraenz
Max Planck Institute for Solar System Research
E-mail: fraenz@mps.mpg.de
Tel: +49 555 6979 441


Håkan Svedhem
Venus Express Project Scientist
Email: H.Svedhem@esa.int
Tel: +31 71 565 3370

The Origin and Maintenance of a Retrograde Exoplanet

Astronomers have used the Subaru Telescope to show that the HAT-P-7 planetary system, which is about 1040 light years from Earth in the constellation Cygnus, includes at least two giant planets and one companion star (Figure 1). The discovery of a previously unknown companion (HAT-P-7B) to the central star (HAT-P-7) as well as confirmation of another giant planet (HAT-P-7c) orbiting outside of the retrograde planet HAT-P-7b offer new insights into how retrograde planets (Notes 1 and 2) may form and endure.

 figure

Figure 1: Artist's rendition of the HAT-P-7 system. Researchers used rhe Subaru Telescope to discover the retrograde planet (nearest the central star), another giant planet (in the foreground), and a companion star (upper right) in this system. (Credit: NAOJ)

A Japanese collaboration led by Norio Narita (National Astronomical Observatory of Japan) used the Subaru Telescope in 2008 to discover the first evidence of a retrograde orbit of an extrasolar planet, HAT-P-7b. Although retrograde planets, which have orbits that run counter to the spin of their central stars, are absent in our Solar System, they occur in other planetary systems in the Universe. However, scientists did not know how such retrograde planets formed.

Since his team's initial discovery of the retrograde planet HAT-P-7b, Narita has pursued his quest to explain its origin. As participants in the SEEDS (Strategic Exploration of Exoplanets and Disks with the Subaru Telescope, Note 3) Project, he and his colleagues, Yasuhiro Takahashi, Masayuki Kuzuhara, and Teruyuki Hirano (all from the University of Tokyo), took high contrast images of the HAT-P-7 system (Figure 2) with HiCIAO (High Contrast Instrument for the Subaru Next Generation Adaptive Optics) to develop a more complete picture of it.

 figure

Figure 2: Images of HAT-P-7 and its companion star obtained with the Subaru Telescope. IRCS (Infrared Camera and Spectrograph) captured the images in J band (1.25 micron), K band (2.20 micron), and L' band (3.77 micron) in August 2011, and HiCIAO captured the image in H band (1.63 micron) in July 2012. North is up and east is left. The star in the middle is the central star HAT-P-7, and the one on the east (left) side is the companion star HAT-P-7B, which is separated from HAT-P-7 by more than about 1200 AU (1AU Astronomical Unit, which corresponds to the distance from the Sun to the eEarth). The companion is a star with a low mass only a quarter of that of the Sun. The object on the west (right) side is a very distant, unrelated background star. (Credit: NAOJ)

The team first discovered two companion candidates around the HAT-P-7 system in 2009 and measured their proper motion (Figure 3) over a three-year period until 2012. They confirmed that one of the two candidates is a common proper motion stellar companion to HAT-P-7, named HAT-P-7B.


 figure

Figure 3: An illustration of the concept of proper motion. Proper motion is the actual motion of a star across the sky. Two or more stars have "common proper motion" if they move together through space. If a companion candidate is a background star, it does not move together with the central star. Therefore, their relative configuration changes over time. In contrast, when the companion candidate is a true companion, these two objects have the same proper motion and move together. Thus their relative configuration does not change over time. (Credit: NAOJ)
 
The team also confirmed a long-term radial velocity (Note 4) trend for HAT-P-7. This indicated the existence of another giant planet, HAT-P-7c, orbiting between the orbits of HAT-P-7b (the retrograde planet) and HAT-P-7B (the stellar companion).

The question remained: How did the retrograde orbit of the planet develop? In a 2012 research report, Dr. Simon Albrecht pointed out that certain gravitational effects between the central star and HAT-P-7b would prevent the long-term maintenance of its retrograde orbit. The current team thinks that the existence of the companion star (HAT-P-7B) and the newly confirmed outer planet (HAT-P-7c) are likely to play an important role in forming and maintaining the retrograde orbit of the inner planet (HAT-P-7b) via the Kozai mechanism, a long-term process during which a more massive object has an effect on the orbit of another. In the case of HAT-P-7b, the team posited so-called "sequential Kozai migration" as an explanation of this retrograde planet. They suggest that the companion star (HAT-P-7B) first affected the orbit of the newly confirmed outer planet (HAT-P-7c) through the Kozai mechanism, causing it to tilt. When the orbit of that planet inclined enough, HAT-P7c altered the orbit of the inner planet (HAT-P-7b) through the Kozai mechanism, so that it became retrograde. This sequential orbital evolution of the planet is one of the scenarios that could explain the origin of retrograde/tilted/eccentric planets.

Narita's team has demonstrated the importance of conducting high-contrast direct imaging observations for known planetary systems to check for the presence of outer faint companions, which may play an important role in understanding the entire picture of planetary migration. The findings provide important clues for understanding the origin of a variety of planetary systems, including those with highly tilted and eccentric orbits.

References:
Albrecht, S., et al. 2012, ApJ, 757, 18.
Narita, N., Takahashi, Y.H., Kuzuhara, M., Hirano, T. et al. 2012,
“A Common Proper Motion Stellar Companion to HAT-P-7”
Publ. Astron. Soc. Japan, Vol. 64, L7


Acknowledgements:
This research was supported in part by the following:
  • Japan Society for the Promotion of Science (JSPS), Japan
  • Ministry of Education, Culture, Sports, and Technology (MEXT), Japan
  • National Institute of Natural Sciences (NINS), Japan
  • National Science Foundation (NSF), USA


Notes:
  1. A retrograde planet is a planet with an orbit that runs counter (over 90 degrees) to the direction of the spin of the central star. Previous observations have revealed that about a third of hot Jupiters, exoplanets with characteristics similar to Jupiter but orbiting very close to their host stars, have tilted or even retrograde orbits relative to the spin of their central star.
  2. The letters after the name of a star are consistent ways that astronomers label parts of a planetary system. The planetary system is named for the central star (HAT-P-7), and a companion star is labeled with an upper case B (HAT-P-7B). The first planet discovered in the system is designated by a lower case b (HAT-P-7b), and the next, with a lower case c (HAT-P-7c), and so on.
  3. SEEDS (Strategic Exploration of Exoplanets and Disks with Subaru Telescope) is a large-scale, five-year strategic project led by Motohide Tamura (National Astronomical Observatory of Japan). Using a total of 120 observing nights at the Subaru Telescope, the project focuses on exploring hundreds of nearby stars in an effort to directly image extrasolar planets and protoplanetary/debris disks around stars.
  4. Radial velocity is a measure of the rate of change in the distance of an astronomical object. When a planet orbits around a star, it causes a tiny shift in the star's spectrum which can be measured with a high-precision spectrograph and and used to infer the presence of a planet. 

Tuesday, January 29, 2013

Cool, New Views of Andromeda Galaxy

The ring-like swirls of dust filling the Andromeda galaxy stand out colorfully in this new image from the Herschel Space Observatory, a European Space Agency mission with important NASA participation. Image credit: ESA/NASA/JPL-Caltech/NHSC . › Full image and caption

In this new view of the Andromeda galaxy from the Herschel space observatory, cool lanes of forming stars are revealed in the finest detail yet. Herschel is a European Space Agency mission with important NASA participation. Image credit: ESA/Herschel/PACS & SPIRE Consortium, O. Krause, HSC, H. Linz . › Full image and caption  -  enlarge image

Two new eye-catching views from the Herschel space observatory are fit for a princess. They show the elegant spiral galaxy Andromeda, named after the mythical Greek princess known for her beauty.

The Andromeda galaxy, also known as Messier 31, lies 2 million light-years away, and is the closest large galaxy to our own Milky Way. It is estimated to have up to one trillion stars, whereas the Milky Way contains hundreds of billions. Recent evidence suggests Andromeda's overall mass may in fact be less than the mass of the Milky Way, when dark matter is included.

Herschel, a European Space Agency mission with important NASA contributions, sees the longer-wavelength infrared light from the galaxy, revealing its rings of cool dust. Some of this dust is the very coldest in the galaxy -- only a few tens of degrees above absolute zero.

In both views, warmer dust is highlighted in the central regions by different colors. New stars are being born in this central, crowded hub, and throughout the galaxy's rings in dusty knots. Spokes of dust can also be seen between the rings.

One view, seen at http://www.jpl.nasa.gov/spaceimages/details.php?id=PIA16682 , is a mosaic of data from Herschel's Photodetecting Array Camera and Spectrometer (PACS) and spectral and photometric imaging receiver (SPIRE).

The second view, seen at http://www.jpl.nasa.gov/spaceimages/details.php?id=PIA16681 , shows data from only the SPIRE instrument, which captures the longest of wavelengths detectable by Herschel.

Herschel is a European Space Agency cornerstone mission, with science instruments provided by consortia of European institutes and with important participation by NASA. NASA's Herschel Project Office is based at NASA's Jet Propulsion Laboratory, Pasadena, Calif. JPL contributed mission-enabling technology for two of Herschel's three science instruments. The NASA Herschel Science Center, part of the Infrared Processing and Analysis Center at the California Institute of Technology in Pasadena, supports the United States astronomical community. Caltech manages JPL for NASA.


Whitney Clavin 818-354-4673
Jet Propulsion Laboratory, Pasadena, Calif.
 whitney.clavin@jpl.nasa.gov

An Intergalactic Heavyweight

 Abell 901/902
Credit: ESO

This deep-field image shows what is known as a supercluster of galaxies — a giant group of galaxy clusters which are themselves clustered together. This one, known as Abell 901/902, comprises three separate main clusters and a number of filaments of galaxies, typical of such super-structures. One cluster, Abell 901a, can be seen above and just to the right of the prominent red foreground star near the middle of the image. Another, Abell 901b, is further to the right of Abell 901a, and slightly lower. Finally, the cluster Abell 902 is directly below the red star, towards the bottom of the image.   

The Abell 901/902 supercluster is located a little over two billion light-years from Earth, and contains hundreds of galaxies in a region about 16 million light-years across. For comparison, the Local Group of galaxies — which contains our Milky Way among more than 50 others — measures roughly ten million light-years across.

This image was taken by the Wide Field Imager (WFI) camera on the MPG/ESO 2.2-metre telescope, located at the La Silla Observatory in Chile. Using data from the WFI and from the NASA/ESA Hubble Space Telescope, in 2008 astronomers were able to precisely map the distribution of dark matter in the supercluster, showing that the clusters and individual galaxies which comprise the super-structure reside within vast clumps of dark matter. To do this, astronomers looked at how the light from 60 000 faraway galaxies located behind the supercluster was being distorted by the gravitational influence of the dark matter it contains, thus revealing its distribution. The mass of the four main dark matter clumps of Abell 901/902 is thought to be around ten trillion times that of the Sun.

The observations shown here are part of the COMBO-17 survey, a survey of the sky undertaken in 17 different optical filters using the WFI camera. The COMBO-17 project has so far found over 25 000 galaxies.

Links

Source: ESO

Monday, January 28, 2013

DEM L50: Stellar Effervescence on Display

 The superbubble DEM L50 (Labeled)
Credit X-ray: NASA/CXC/Univ of Michigan/A.E.Jaskot,
Optical: NOAO/CTIO/MCELS 


This composite image shows the superbubble DEM L50 (a.k.a. N186) located in the Large Magellanic Cloud about 160,000 light years from Earth. Superbubbles are found in regions where massive stars have formed in the last few million years. The massive stars produce intense radiation, expel matter at high speeds, and race through their evolution to explode as supernovas . The winds and supernova shock waves carve out huge cavities called superbubbles in the surrounding gas.

X-rays from NASA's Chandra X-ray Observatory are shown in pink and optical data from the Magellanic Cloud Emission Line Survey (MCELS) are colored in red, green and blue. The MCELS data were obtained with the University of Michigan's 0.9-meter Curtis Schmidt telescope at Cerro Tololo Inter-American Observatory (CTIO). The shape of DEM L50 is approximately an ellipse, with a supernova remnant named SNR N186 D located on its northern edge.

Like another superbubble in the LMC, N44 (see last year's press release), DEM L50 gives off about 20 times more X-rays than expected from standard models for the evolution of superbubbles. A Chandra study published in 2011 showed that there are two extra sources of the bright X-ray emission: supernova shock waves striking the walls of the cavities, and hot material evaporating from the cavity walls.

The Chandra study of DEM L50 was led by Anne Jaskot from the University of Michigan in Ann Arbor. The co-authors were Dave Strickland from Johns Hopkins University in Baltimore, MD, Sally Oey from University of Michigan, You-Hua Chu from University of Illinois and Guillermo Garcia-Segura from Instituto de Astronomia-UNAM in Ensenada, Mexico.

NASA's Marshall Space Flight Center in Huntsville, Ala., manages the Chandra program for NASA's Science Mission Directorate in Washington. The Smithsonian Astrophysical Observatory controls Chandra's science and flight operations from Cambridge, Mass.

Fast Facts for DEM L50: 

  • Scale: Image is 20.5 arcmin across (950 light years) 
  • Coordinates (J2000): RA 04h 59m 49.00s | Dec -70º 10' 28.00" 
  • Observation Date: Jan 1, 2003 
  • Observation Time: 10 hours 29 min 
  • Obs. ID: 3355 
  • Instrument: ACIS 
  • Color Code: X-ray (Magenta); Optical (Red, Green, Blue)

Chameleon Pulsar Baffles Astronomers

This illustration shows the pulsar with glowing cones of radiation stemming from its magnetic poles – a state referred to as 'radio-bright' mode. Credit: ESA/ATG medialab. For all images and full captions see below.

A pulsar that is able, without warning, to dramatically change the way in which it shines has been identified by an international team including scientists from the University of Manchester. 

Using a satellite X-ray telescope combined with terrestrial radio telescopes the pulsar was found to flip on a roughly half-hour timescale between two extreme states; one dominated by X-ray pulses, the other by a highly organised pattern of radio pulses. 

The research was led by Professor Wim Hermsen from The Netherlands Institute for Space Research and the University of Amsterdam and will appear in the journal Science on the 25th January 2012. 

Researchers from Jodrell Bank as well as institutions around the world used simultaneous observations with the X-ray satellite XMM-Newton and two radio telescopes; the LOw Frequency Array (LOFAR) in the Netherlands and the Giant Meter Wave Telescope (GMRT) in India to reveal this so far unique behaviour.
Pulsars are small spinning stars that are about the size of a city, around 20 km in diameter. They emit oppositely directed beams of radiation from their magnetic poles. Just like a lighthouse, as the star spins and the beam sweeps repeatedly past the Earth we see a brief flash. Some pulsars produce radiation across the entire electromagnetic spectrum, including at X-ray and radio wavelengths. Despite being discovered more than 45 years ago the exact mechanism by which pulsars shine is still unknown. 

It has been known for some time that some radio-emitting pulsars flip their behaviour between two (or even more) states, changing the pattern and intensity of their radio pulses. The moment of flip is both unpredictable and sudden. It is also known from satellite-borne telescopes that a handful of radio pulsars can also be detected at X-ray frequencies. However, the X-ray signal is so weak that nothing is known of its variability.
To find out if the X-rays could also flip the scientists studied a particular pulsar called PSR B0943+10, one of the first to be discovered. It has radio pulses which change in form and brightness every few hours with some of the changes happening within about a second. 

Dr Ben Stappers from Manchester’s School of Physics & Astronomy says: “The behaviour of this pulsar is quite startling, it’s as if it has two distinct personalities. As PSR B0943+10 is one of the few pulsars also known to emit X-rays, finding out how this higher energy radiation behaves as the radio changes could provide new insight into the nature of the emission process.” 

Since the source is a weak X-ray emitter, the team used the most sensitive X-ray telescope in existence, the European Space Agency’s XMM-Newton on board a spacecraft orbiting the Earth. The observations took place over six separate sessions of about six hours in duration. To identify the exact moment of flip in the pulsar’s radio behaviour the X-ray observations were tracked simultaneously with two of the largest radio telescopes in the world, LOFAR and the GMRT. 

What the scientists found was that whilst the X-rays did indeed change their behaviour at the same time as the radio emission, as might have been expected, in the state where the radio signal is strong and organised the X-rays were weak, and when the radio emission switched to weak the X-rays got brighter. 

Commenting on the study’s findings the project leader Wim Hermsen says: “To our surprise we found that when the brightness of the radio emission halved, the X-ray emission brightened by a factor of two! Furthermore the intense X-rays have a very different character from those in the radio-bright state, since they seem to be thermal in origin and to pulse with the neutron star’s rotation period.” 

Dr Stappers says this is an exciting discovery: “As well as brightening in the X-rays we discovered that the X-ray emission also shows pulses, something not seen when the radio emission is bright. This was the opposite of what we had expected. I’ve likened the changes in the pulsar to a chameleon. Like the animal the star changes in reaction to its environment, such as a change in temperature.” 

Geoff Wright from the University of Sussex adds: “Our observations strongly suggest that a temporary "hotspot” appears close to the pulsar’s magnetic pole which switches on and off with the change of state. But why a pulsar should undergo such dramatic and unpredictable changes is completely unknown.”
The next step for the researchers is to look at other objects which have similar behaviour to investigate what happens to the X-ray emission. Later this year there will be another round of simultaneous X-ray and radio observations of a second pulsar. These observations will include the Lovell telescope at Jodrell Bank Observatory. 

Notes

Dr Ben Stappers co-leads the radio pulsar project with the LOFAR telescope.
This research was a global project spanning a number of countries. The research was led by Wim Hermsen (SRON Netherlands Institute for Space Research, UvA), Lucien Kuiper and Jelle de Plaa (SRON), Jason Hessels and Joeri van Leeuwen (ASTRON en UvA), Dipanjan Mitra (NCFRA-TIFR, Pune, India), Joanna Rankin (University of Vermont, Burlington, VS), Ben Stappers (University of Manchester, UK), Geoffrey Wright (University of Sussex, UK). The Pulsar Working Group and the Builders Group from the LOFAR-telescope, which was at the time still in the commissioning phase, gave support to these observations.
The results of this research, entitled: Synchronous X-ray and Radio Mode Switches: a Rapid Transformation of the Pulsar Magnetosphere will be published in Science on Friday 25 January. 

For more information contact: 

Daniel Cochlin
Media Relations Officer
Faculty of Engineering and Physical Sciences
The University of Manchester
Tel: 0161 275 8387
Email:
Daniel.Cochlin@manchester.ac.uk
  

Full captions to images

Artist's impression of a pulsar in radio-bright mode
 
This illustration shows a pulsar with glowing cones of radiation stemming from its magnetic poles – a state referred to as 'radio-bright' mode. 

Pulsars were discovered in 1967 as flickering sources of radio waves and soon after interpreted as rapidly rotating and strongly magnetised neutron stars. There is a general agreement about the origin of the radio emission from pulsars: it is caused by highly energetic electrons, positrons and ions moving along the field lines of the pulsar's magnetic field. When they are accelerated to very high energies, particles radiate at radio wavelengths. The radio emission is concentrated in cones that stem from the pulsar's magnetic poles, and we see it pulsate because the rotation and magnetic axes are misaligned. 

Many pulsars exhibit a rather erratic behaviour: in the space of a few seconds, their radio emission becomes weaker or even disappears for a while, then returns to the previous level after some hours. The mechanisms causing this switch between what are usually referred to as 'radio-bright' and 'radio-quiet' states are still largely unknown. 

Observations of the five-million year-old pulsar known as PSR B0943+10, performed simultaneously with ESA's XMM-Newton X-ray observatory and ground-based radio telescopes, revealed that this source exhibits variations in its X-ray emission that mimic in reverse the changes seen in radio waves. No current model is able to predict what could cause such sudden and drastic changes to the pulsar's entire magnetosphere and result in such a curious emission.  Credit: ESA/ATG medialab 


Artist's impression of a pulsar in X-ray-bright/radio-quiet mode
 
This illustration shows a pulsar with glowing 'hot-spots' that are located at its magnetic poles, the likely sites of X-ray emission from old pulsars. In particular, the illustration shows the pulsar in a state characterised by bright X-ray emission, arising from the polar caps, and relatively low radio emission from the cones that stem from the pulsar's magnetic poles ('X-ray-bright/radio-quiet' mode). 

Pulsars were discovered in 1967 as flickering sources of radio waves and soon after interpreted as rapidly rotating and strongly magnetised neutron stars. There is a general agreement about the origin of the radio emission from pulsars: it is caused by highly energetic electrons, positrons and ions moving along the field lines of the pulsar's magnetic field. When they are accelerated to very high energies, particles radiate at radio wavelengths. The radio emission is concentrated in cones that stem from the pulsar's magnetic poles, and we see it pulsate because the rotation and magnetic axes are misaligned. 

Many pulsars exhibit a rather erratic behaviour: in the space of a few seconds, their radio emission becomes weaker or even disappears for a while, then returns to the previous level after some hours. The mechanisms causing this switch between what are usually referred to as 'radio-bright' and 'radio-quiet' states are still largely unknown. 

When they are young, pulsars also shine in X-rays because the surface of the neutron star is still very hot. Old pulsars are much weaker sources of X-rays, because the surface of the neutron star has cooled down. Astronomers know of only a handful of old pulsars that shine in X-rays and believe that this emission comes from the magnetic poles – the sites on the neutron star's surface where the acceleration of charged particles is triggered. 

Observations of the five-million year-old pulsar known as PSR B0943+10, performed simultaneously with ESA's XMM-Newton X-ray observatory and ground-based radio telescopes, revealed that this source exhibits variations in its X-ray emission that mimic in reverse the changes seen in radio waves. No current model is able to predict what could cause such sudden and drastic changes to the pulsar's entire magnetosphere and result in such a curious emission.  Credit: ESA/ATG medialab
 

The two states of pulsar PSR B0943+10 as observed with XMM-Newton and LOFAR
 
This illustration shows the two states of emission observed from pulsar PSR B0943+10, which is well known for switching between a 'bright' and 'quiet' mode at radio wavelengths. Observations of PSR B0943+10, performed simultaneously with ESA's XMM-Newton X-ray observatory and ground-based radio telescopes, revealed that this source exhibits variations in its X-ray emission that mimic in reverse the changes seen in radio waves. No current model is able to predict what could cause such sudden and drastic changes to the pulsar's entire magnetosphere and result in such a curious emission. 

In the upper part of the illustration, the artist's impression on the left shows the pulsar with glowing cones of radiation stemming from its magnetic poles – a state referred to as 'radio-bright' mode. Radio emission from pulsars is known to arise from these cones, and we see it pulsate because the pulsar's rotation and magnetic axes are misaligned. The graphs on the right side show data from X-ray observations, performed with XMM-Newton (upper graph), and from radio observations, performed with the Low Frequency Array (LOFAR; lower graph). The upper graph shows that, in the 'radio-bright' mode, the pulsar does not shine brightly in X-rays. The lower graph shows a bright and pulsating emission at radio wavelengths. 

In the lower part of the illustration, the artist's impression on the left shows the pulsar in a different state, with glowing 'hot-spots' that are located at its magnetic poles. In particular, the illustration shows the pulsar in a state characterised by bright X-ray emission, arising from the polar caps, and relatively low radio emission from the cones that stem from the pulsar's magnetic poles ('X-ray-bright/radio-quiet' mode). The graphs on the right side show how, in this mode, the pulsar exhibits a brighter and pulsating X-ray emission, whereas the radio emission is fainter but still pulsating.  Credit: ESA/ATG medialab; ESA/XMM-Newton; ASTRON/LOFAR

Jodrell Bank Centre for Astrophysics


Friday, January 25, 2013

Appearances can be deceptive

Credit: ESA/Hubble & NASA

Globular clusters are roughly spherical collections of extremely old stars, and around 150 of them are scattered around our galaxy. Hubble is one of the best telescopes for studying these, as its extremely high resolution lets astronomers see individual stars, even in the crowded core. The clusters all look very similar, and in Hubble’s images it can be quite hard to tell them apart – and they all look much like NGC 411, pictured here.

And yet appearances can be deceptive: NGC 411 is in fact not a globular cluster, and its stars are not old. It isn’t even in the Milky Way.

NGC 411 is classified as an open cluster. Less tightly bound than a globular cluster, the stars in open clusters tend to drift apart over time as they age, whereas globulars have survived for well over 10 billion years of galactic history. NGC 411 is a relative youngster — not much more than a tenth of this age. Far from being a relic of the early years of the Universe, the stars in NGC 411 are in fact a fraction of the age of the Sun.

The stars in NGC 411 are all roughly the same age, having formed in one go from one cloud of gas. But they are not all the same size. Hubble’s image shows a wide range of colours and brightnesses in the cluster’s stars. These tell astronomers many facts about the stars, including their mass, temperature and evolutionary phase. Blue stars, for instance, have higher surface temperatures than red ones.

The image is a composite produced from ultraviolet, visible and infrared observations made by Hubble’s Wide Field Camera 3. This filter set lets the telescope “see” colours slightly further beyond red and the violet ends of the spectrum.

Source: ESA/Hubble - Space Telescope


Thursday, January 24, 2013

NIFTY: Numerical information field theory for everyone - Scientists present a software package for all types of imaging

Fig. 1: Signal reconstruction with NIFTY in one, two and spherical dimensions (upper, middle and lower rows). In each row, the original signal is shown on the left, the noisy data in the center and the signal reconstruction from the data on the right. The same NIFTY code generated all three examples.

Fig. 2: NIFTY reconstruction of a highly distorted photograph of the lunar surface. Top row from left to right: original image (Source: USC-SIPI database), data, and reconstruction. Bottom row shows disturbances in the data, from left to right: grain size of the smoothing, patterned mask and inhomogeneous structure of the noise distribution.

Signal reconstruction algorithms can now be developed more elegantly because scientists at the Max Planck Institute for Astrophysics released a new software package for data analysis and imaging, NIFTY, that is useful for mapping in any number of dimensions or spherical projections without encoding the dimensional information in the algorithm itself. The advantage is that once a special method for image reconstruction has been programmed with NIFTY it can easily be applied to many other applications. Although it was originally developed with astrophysical imaging in mind, NIFTY can also be used in other areas such as medical imaging. 

Behind most of the impressive telescopic images that capture events at the depths of the cosmos is a lot of work and computing power. The raw data from many instruments are not vivid enough even for experts to have a chance at understanding what they mean without the use of highly complex imaging algorithms. A simple radio telescope scans the sky and provides long series of numbers. Networks of radio telescopes act as interferometers and measure the spatial vibration modes of the brightness of the sky rather than an image directly. Space-based gamma ray telescopes identify sources by the pattern that is generated by the shadow mask in front of the detectors. There are sophisticated algorithms necessary to generate images from the raw data in all of these examples. The same applies to medical imaging devices, such as computer tomographs and magnetic resonance scanners.

Previously each of these imaging problems needed a special computer program that is adapted to the specifications and geometry of the survey area to be represented. But many of the underlying concepts behind the software are generic and ideally would just be programmed once if only the computer could automatically take care of the geometric details.

With this in mind, the researchers in Garching have developed and now released the software package NIFTY that makes this possible. An algorithm written using NIFTY to solve a problem in one dimension can just as easily be applied, after a minor adjustment, in two or more dimensions or on spherical surfaces. NIFTY handles each situation while correctly accounting for all geometrical quantities. This allows imaging software to be developed much more efficiently because testing can be done quickly in one dimension before application to higher dimensional spaces, and code written for one application can easily be recycled for use in another.

NIFTY stands for "Numerical Information Field Theory". The relatively young field of Information Field Theory aims to provide recipes for optimal mapping, completely exploiting the information and knowledge contained in data. NIFTY now simplifies the programming of such formulas for imaging and data analysis, regardless of whether they come from the information field theory or from somewhere else, by providing a natural language for translating mathematics into software.

The NIFTY software release is accompanied by a publication in which the mathematical principles are illustrated using examples (see Figures 1 & 2). In addition, the researchers provide an extensive online documentation. The versatility of NIFTY has already been demonstrated in an earlier scientific publication on nonlinear signal reconstruction and will certainly be helpful in developing better and more accurate imaging methods in astronomy, medical technology and earth observation.

Background information:

NIFTY has been developed by Marco Selig, Michael Bell, Henrik Junklewitz, Niels Oppermann, Martin Reinecke, Carlos Pachajoa, Maksim Greiner and Torsten Enßlin at the Max Planck Institute for Astrophysics. Marco Selig, the main developer, is currently a PhD student under the guidance of Torsten Enßlin investigating information field theory-based imaging for high-energy photons. NIFTY is an object-oriented Python library that relies on complex numerical operations on extremely powerful external routines in C, C++ and Cython. The code is freely available under a GPL open source license. Information field theory is a focus of the research group of Torsten Enßlin.

References:

Marco Selig, Michael R. Bell, Henrik Junklewitz, Niels Oppermann, Martin Reinecke, Maksim Greiner, Carlos Pachajoa, Torsten A. Enßlin:
NIFTY - Numerical Information Field Theory - a versatile Python library for signal inference submitted to IEEE Transactions on Signal Processing
arXiv:1301.4499

Further Information:


Contact:

Marco Selig
phone 089 30000-2298
email
:
mselig@mpa-garching.mpg.de

Torsten Enßlin
phone 089 30000-2243
email:
tensslin@mpa-garching.mpg.de

Hannelore Hämmerle
phone 089 30000-3980
email:
pr@mpa-garching.mpg.de 

Wednesday, January 23, 2013

Space Instrument Adds Big Piece to the Solar Corona Puzzle

This is one of the highest-resolution images ever taken of the solar corona, or outer atmosphere. It was captured by NASA's High Resolution Coronal Imager, or Hi-C, in the ultraviolet wavelength of 19.3 nanometers. Hi-C showed that the Sun is dynamic, with magnetic fields constantly warping, twisting, and colliding in bursts of energy. Added together, those energy bursts can boost the temperature of the corona to 7 million degrees Fahrenheit when the Sun is particularly active.  Credit: NASA . High Resolution Image (jpg) - Low Resolution Image (jpg)

Hi-C found interweaved magnetic fields that were braided just like hair. When those braids relax and straighten, they release energy. Hi-C witnessed one such event during its flight, shown in this time series. Credit: NASA . Low Resolution Image (jpg)
 
Hi-C also detected an area where magnetic field lines crossed in an X, then straightened out as the fields reconnected. Minutes later, that spot erupted with a mini solar flare. Images of the same location taken with the Atmospheric Imaging Assembly (AIA) aboard the Solar Dynamics Observatory show the superior resolution of Hi-C. Credit: NASA  Low Resolution Image (jpg)

Cambridge, MA - The Sun's visible surface, or photosphere, is 10,000 degrees Fahrenheit. As you move outward from it, you pass through a tenuous layer of hot, ionized gas or plasma called the corona. The corona is familiar to anyone who has seen a total solar eclipse, since it glimmers ghostly white around the hidden Sun. 

But how can the solar atmosphere get hotter, rather than colder, the farther you go from the Sun's surface? This mystery has puzzled solar astronomers for decades. A suborbital rocket mission that launched in July 2012 has just provided a major piece of the puzzle.

The High-resolution Coronal Imager, or Hi-C, revealed one of the mechanisms that pumps energy into the corona, heating it to temperatures up to 7 million degrees F. The secret is a complex process known as magnetic reconnection.

"This is the first time we've had images at high enough resolution to directly observe magnetic reconnection," explained Smithsonian astronomer Leon Golub (Harvard-Smithsonian Center for Astrophysics). "We can see details in the corona five times finer than any other instrument."

"Our team developed an exceptional instrument capable of revolutionary image resolution of the solar atmosphere. Due to the level of activity, we were able to clearly focus on an active sunspot, thereby obtaining some remarkable images," said heliophysicist Jonathan Cirtain (Marshall Space Flight Center).

Magnetic braids and loops
 
The Sun's activity, including solar flares and plasma eruptions, is powered by magnetic fields. Most people are familiar with the simple bar magnet, and how you can sprinkle iron filings around one to see its field looping from one end to the other. The Sun is much more complicated.

The Sun's surface is like a collection of thousand-mile-long magnets scattered around after bubbling up from inside the Sun. Magnetic fields poke out of one spot and loop around to another spot. Plasma flows along those fields, outlining them with glowing threads.

The images from Hi-C showed interweaved magnetic fields that were braided just like hair. When those braids relax and straighten, they release energy. Hi-C witnessed one such event during its flight.
It also detected an area where magnetic field lines crossed in an X, then straightened out as the fields reconnected. Minutes later, that spot erupted with a mini solar flare.

Hi-C showed that the Sun is dynamic, with magnetic fields constantly warping, twisting, and colliding in bursts of energy. Added together, those energy bursts can boost the temperature of the corona to 7 million degrees F when the Sun is particularly active.

Selecting the target
 
The telescope aboard Hi-C provided a resolution of 0.2 arcseconds - about the size of a dime seen from 10 miles away. That allowed astronomers to tease out details just 100 miles in size. (For comparison, the Sun is 865,000 miles in diameter.)

Hi-C photographed the Sun in ultraviolet light at a wavelength of 19.3 nanometers - 25 times shorter than wavelengths of visible light. That wavelength is blocked by Earth's atmosphere, so to observe it astronomers had to get above the atmosphere. The rocket's suborbital flight allowed Hi-C to collect data for just over 5 minutes before returning to Earth.

Hi-C could only view a portion of the Sun, so the team had to point it carefully. And since the Sun changes hourly, they had to select their target at the last minute - the day of the launch. They chose a region that promised to be particularly active.

"We looked at one of the largest and most complicated active regions I've ever seen on the Sun," said Golub. "We hoped that we would see something really new, and we weren't disappointed."

Next steps
 
Golub said that data from Hi-C continues to be analyzed for more insights. Researchers are hunting areas where other energy release processes were occurring.

In the future, the scientists hope to launch a satellite that could observe the Sun continuously at the same level of sharp detail.

"We learned so much in just five minutes. Imagine what we could learn by watching the Sun 24/7 with this telescope," said Golub.

This research is being published in the journal Nature in a paper co-authored by Cirtain, Golub, A. Winebarger (Marshall), B. De Pontieu (Lockheed Martin), K. Kobayashi (University of Alabama - Huntsville), R. Moore (Marshall), R. Walsh (University of Central Lancashire), K. Korreck, M. Weber and P. McCauley (CfA), A. Title (Lockheed Martin), S. Kuzin (Lebedev Physical Institute), and C. DeForest (Southwest Research Institute).

Headquartered in Cambridge, Mass., the Harvard-Smithsonian Center for Astrophysics (CfA) is a joint collaboration between the Smithsonian Astrophysical Observatory and the Harvard College Observatory. CfA scientists, organized into six research divisions, study the origin, evolution and ultimate fate of the universe.

For more information, contact:

David A. Aguilar
Director of Public Affairs
Harvard-Smithsonian Center for Astrophysics
617-495-7462

daguilar@cfa.harvard.edu

 
Christine Pulliam
Public Affairs Specialist
Harvard-Smithsonian Center for Astrophysics
617-495-7463
cpulliam@cfa.harvard.edu
 

Setting the Dark on Fire

 
Setting the Dark on Fire

Reflection Nebula NGC 1999 in Orion

The wide-field area around NGC 1999 in Orion

Videos

Setting the Dark on Fire (zoom)

Setting the Dark on Fire (pan)

A new image from the Atacama Pathfinder Experiment (APEX) telescope in Chile shows a beautiful view of clouds of cosmic dust in the region of Orion. While these dense interstellar clouds seem dark and obscured in visible-light observations, APEX’s LABOCA camera can detect the heat glow of the dust and reveal the hiding places where new stars are being formed. But one of these dark clouds is not what it seems.

In space, dense clouds of cosmic gas and dust are the birthplaces of new stars. In visible light, this dust is dark and obscuring, hiding the stars behind it. So much so that, when astronomer William Herschel observed one such cloud in the constellation of Scorpius in 1774, he thought it was a region empty of stars and is said to have exclaimed, "Truly there is a hole in the sky here!" [1]

In order to better understand star formation, astronomers need telescopes that can observe at longer wavelengths, such as the submillimetre range, in which the dark dust grains shine rather than absorb light. APEX, on the Chajnantor Plateau in the Chilean Andes, is the largest single-dish submillimetre-wavelength telescope operating in the southern hemisphere, and is ideal for astronomers studying the birth of stars in this way.

Located in the constellation of Orion (The Hunter), 1500 light-years away from Earth, the Orion Molecular Cloud Complex is the closest region of massive star formation to Earth, and contains a treasury of bright nebulae, dark clouds and young stars. The new image shows just part of this vast complex in visible light, with the APEX observations overlaid in brilliant orange tones that seem to set the dark clouds on fire. Often, the glowing knots from APEX correspond to darker patches in visible light — the tell-tale sign of a dense cloud of dust that absorbs visible light, but glows at submillimetre wavelengths, and possibly a site of star formation.

The bright patch below of the centre of the image is the nebula NGC 1999. This region — when seen in visible light — is what astronomers call a reflection nebula, where the pale blue glow of background starlight is reflected from clouds of dust. The nebula is mainly illuminated by the energetic radiation from the young star V380 Orionis [2] lurking at its heart. In the centre of the nebula is a dark patch, which can be seen even more clearly in a well-known image from the NASA/ESA Hubble Space Telescope.

Normally, a dark patch such as this would indicate a dense cloud of cosmic dust, obscuring the stars and nebula behind it. However, in this image we can see that the patch remains strikingly dark, even when the APEX observations are included. Thanks to these APEX observations, combined with infrared observations from other telescopes, astronomers believe that the patch is in fact a hole or cavity in the nebula, excavated by material flowing out of the star V380 Orionis. For once, it truly is a hole in the sky!

The region in this image is located about two degrees south of the large and well-known Orion Nebula (Messier 42), which can be seen at the top edge of the wider view in visible light from the Digitized Sky Survey.

The APEX observations used in this image were led by Thomas Stanke (ESO), Tom Megeath (University of Toledo, USA), and Amy Stutz (Max Planck Institute for Astronomy, Heidelberg, Germany). APEX is a collaboration between the Max Planck Institute for Radio Astronomy (MPIfR), the Onsala Space Observatory (OSO) and ESO. Operation of APEX at Chajnantor is entrusted to ESO.

Notes

[1] In German, "Hier ist wahrhaftig ein Loch im Himmel!"
[2] V380 Orionis has a high surface temperature of about 10 000 Kelvin (about the same in degrees Celsius), nearly twice that of our own Sun. Its mass is estimated to be 3.5 times that of the Sun. 

More information

The year 2012 marks the 50th anniversary of the founding of the European Southern Observatory (ESO). ESO is the foremost intergovernmental astronomy organisation in Europe and the world’s most productive ground-based astronomical observatory by far. It is supported by 15 countries: Austria, Belgium, Brazil, the Czech Republic, Denmark, France, Finland, Germany, Italy, the Netherlands, Portugal, Spain, Sweden, Switzerland and the United Kingdom. ESO carries out an ambitious programme focused on the design, construction and operation of powerful ground-based observing facilities enabling astronomers to make important scientific discoveries. ESO also plays a leading role in promoting and organising cooperation in astronomical research. ESO operates three unique world-class observing sites in Chile: La Silla, Paranal and Chajnantor. At Paranal, ESO operates the Very Large Telescope, the world’s most advanced visible-light astronomical observatory and two survey telescopes. VISTA works in the infrared and is the world’s largest survey telescope and the VLT Survey Telescope is the largest telescope designed to exclusively survey the skies in visible light. ESO is the European partner of a revolutionary astronomical telescope ALMA, the largest astronomical project in existence. ESO is currently planning the 39-metre European Extremely Large optical/near-infrared Telescope, the E-ELT, which will become “the world’s biggest eye on the sky”.

Links

  • The research into the dark patch in NGC 1999 discussed above is described in a paper by T. Stanke et al., A&A 518, L94 (2010), also available as a preprint.

Contacts

Thomas Stanke
ESO
Garching, Germany
Tel: +49 89 3200 6116
Email: tstanke@eso.org

Douglas Pierce-Price
ESO ALMA/APEX Public Information Officer
Garching, Germany
Tel: +49 89 3200 6759
Email: dpiercep@eso.org