Monday, April 20, 2020

Gemini Detects Most Energetic Wind from Distant Quasar

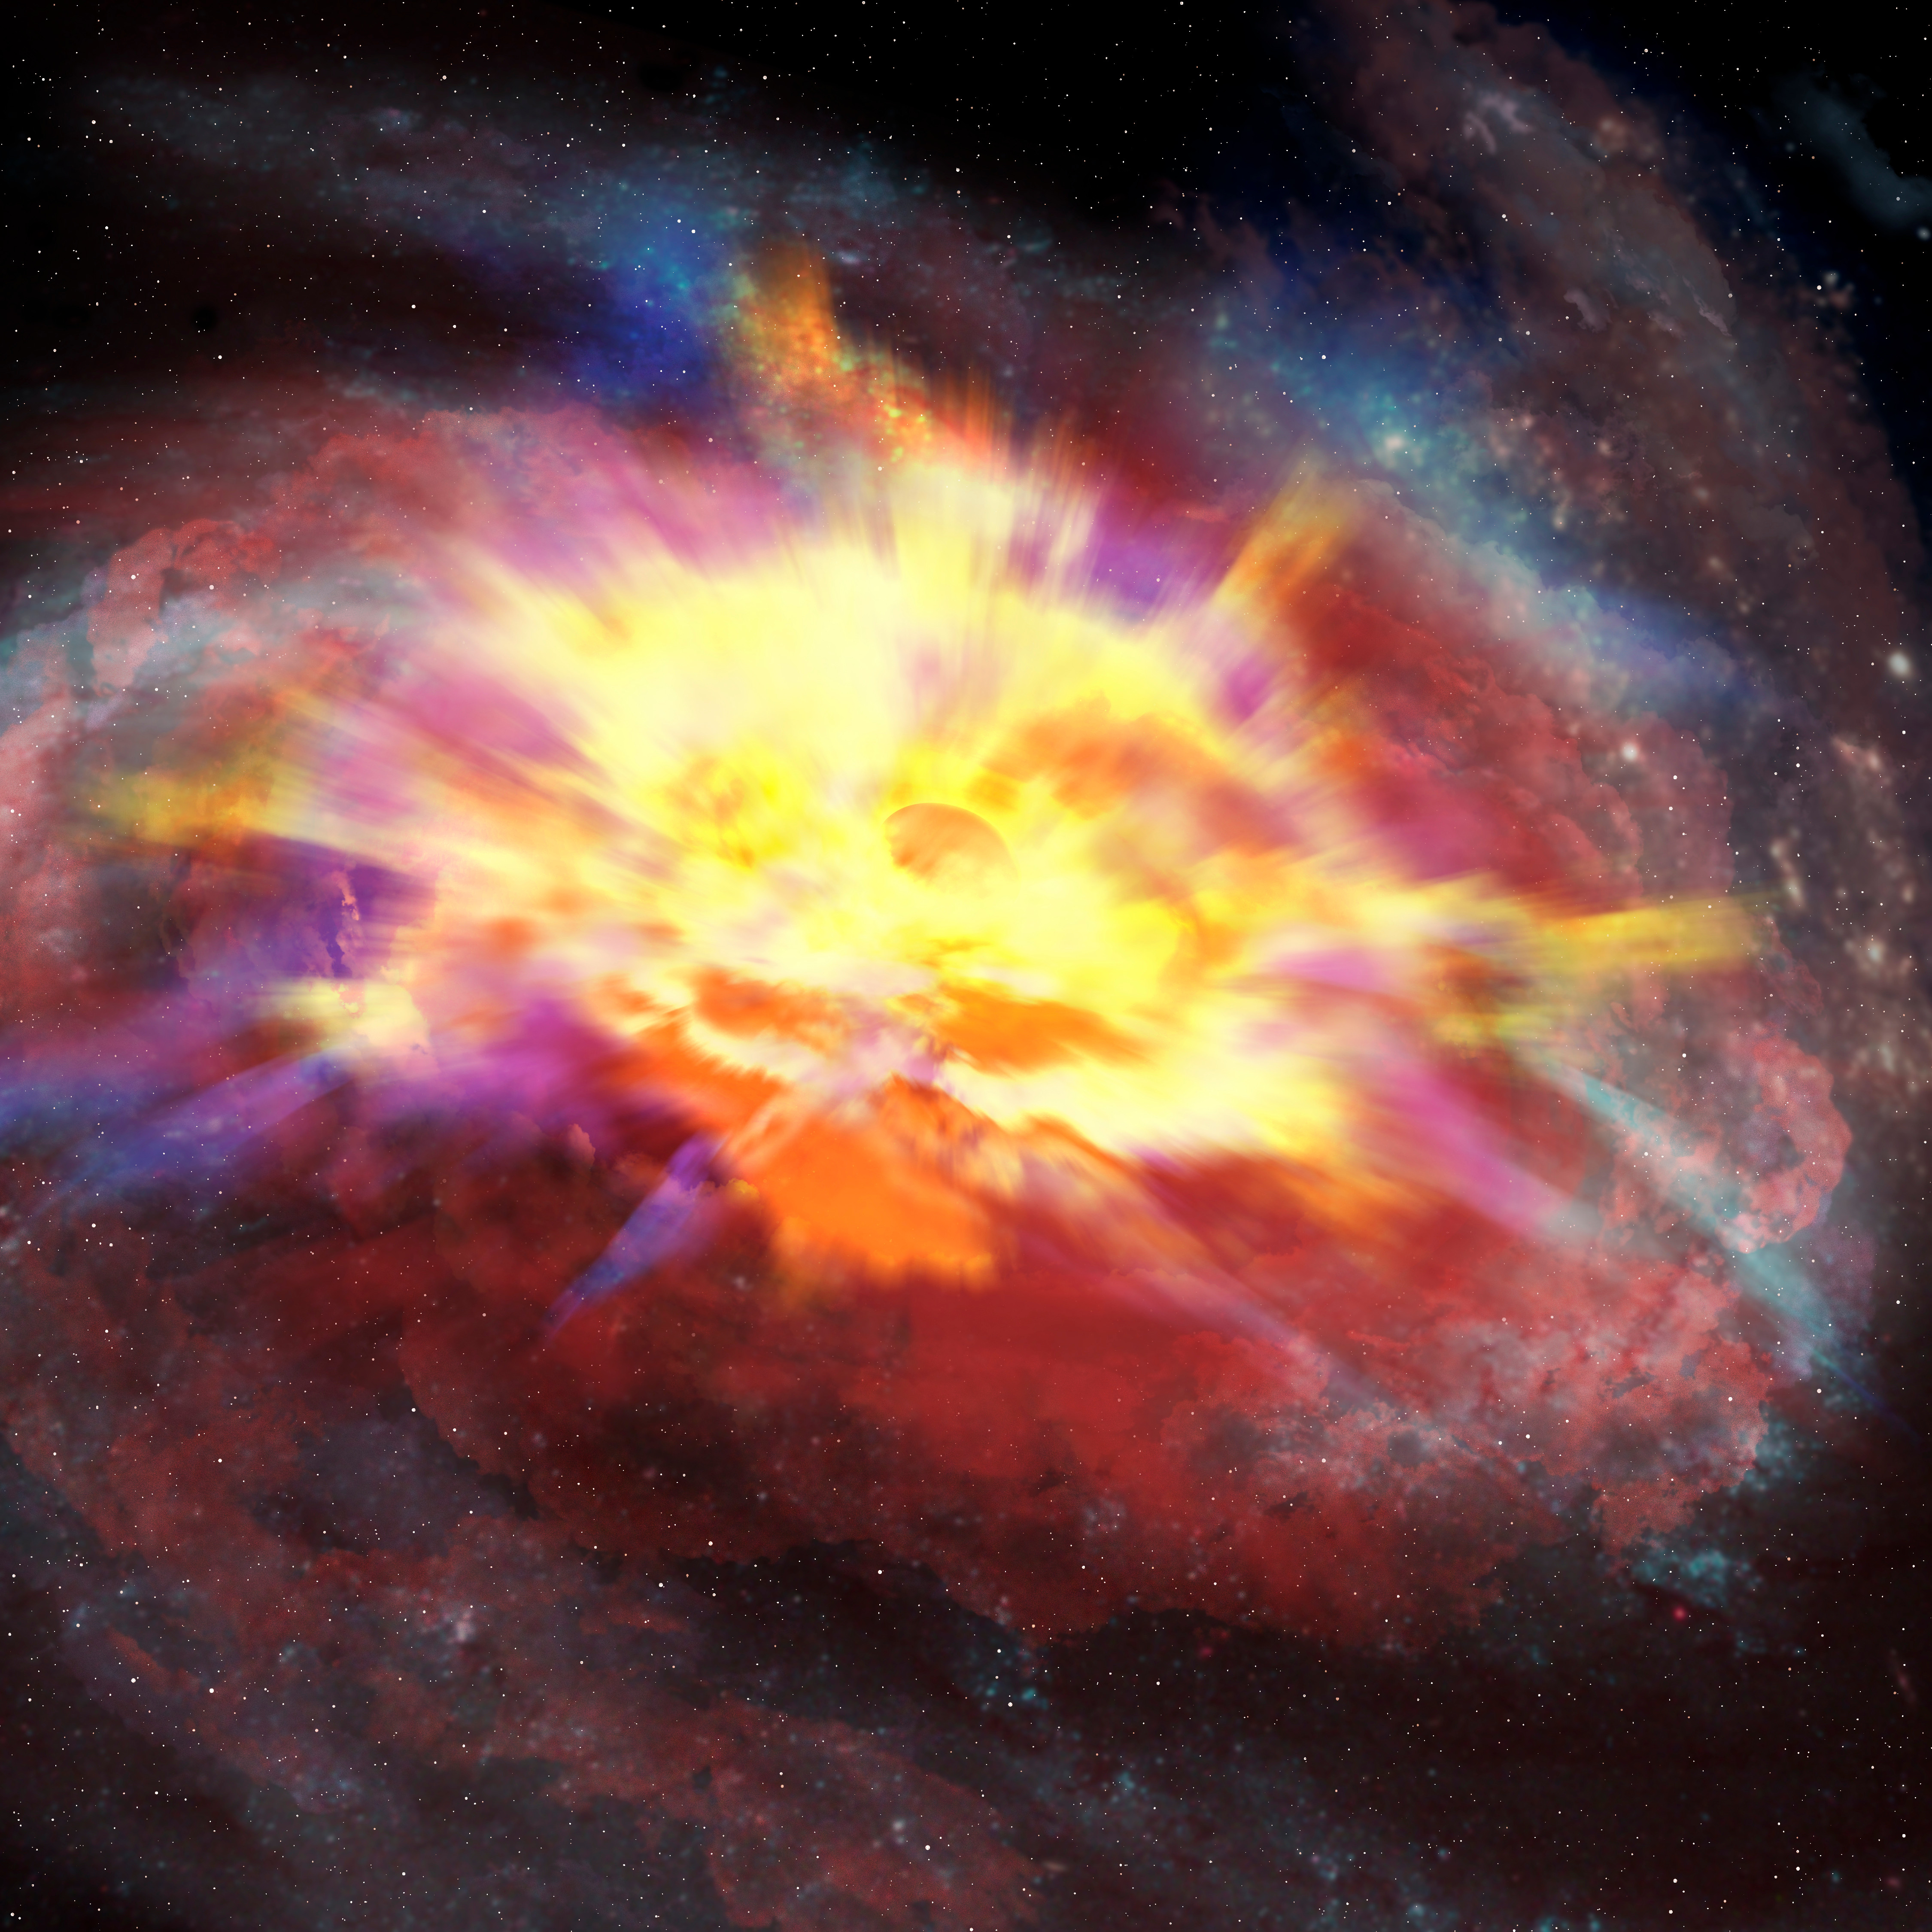
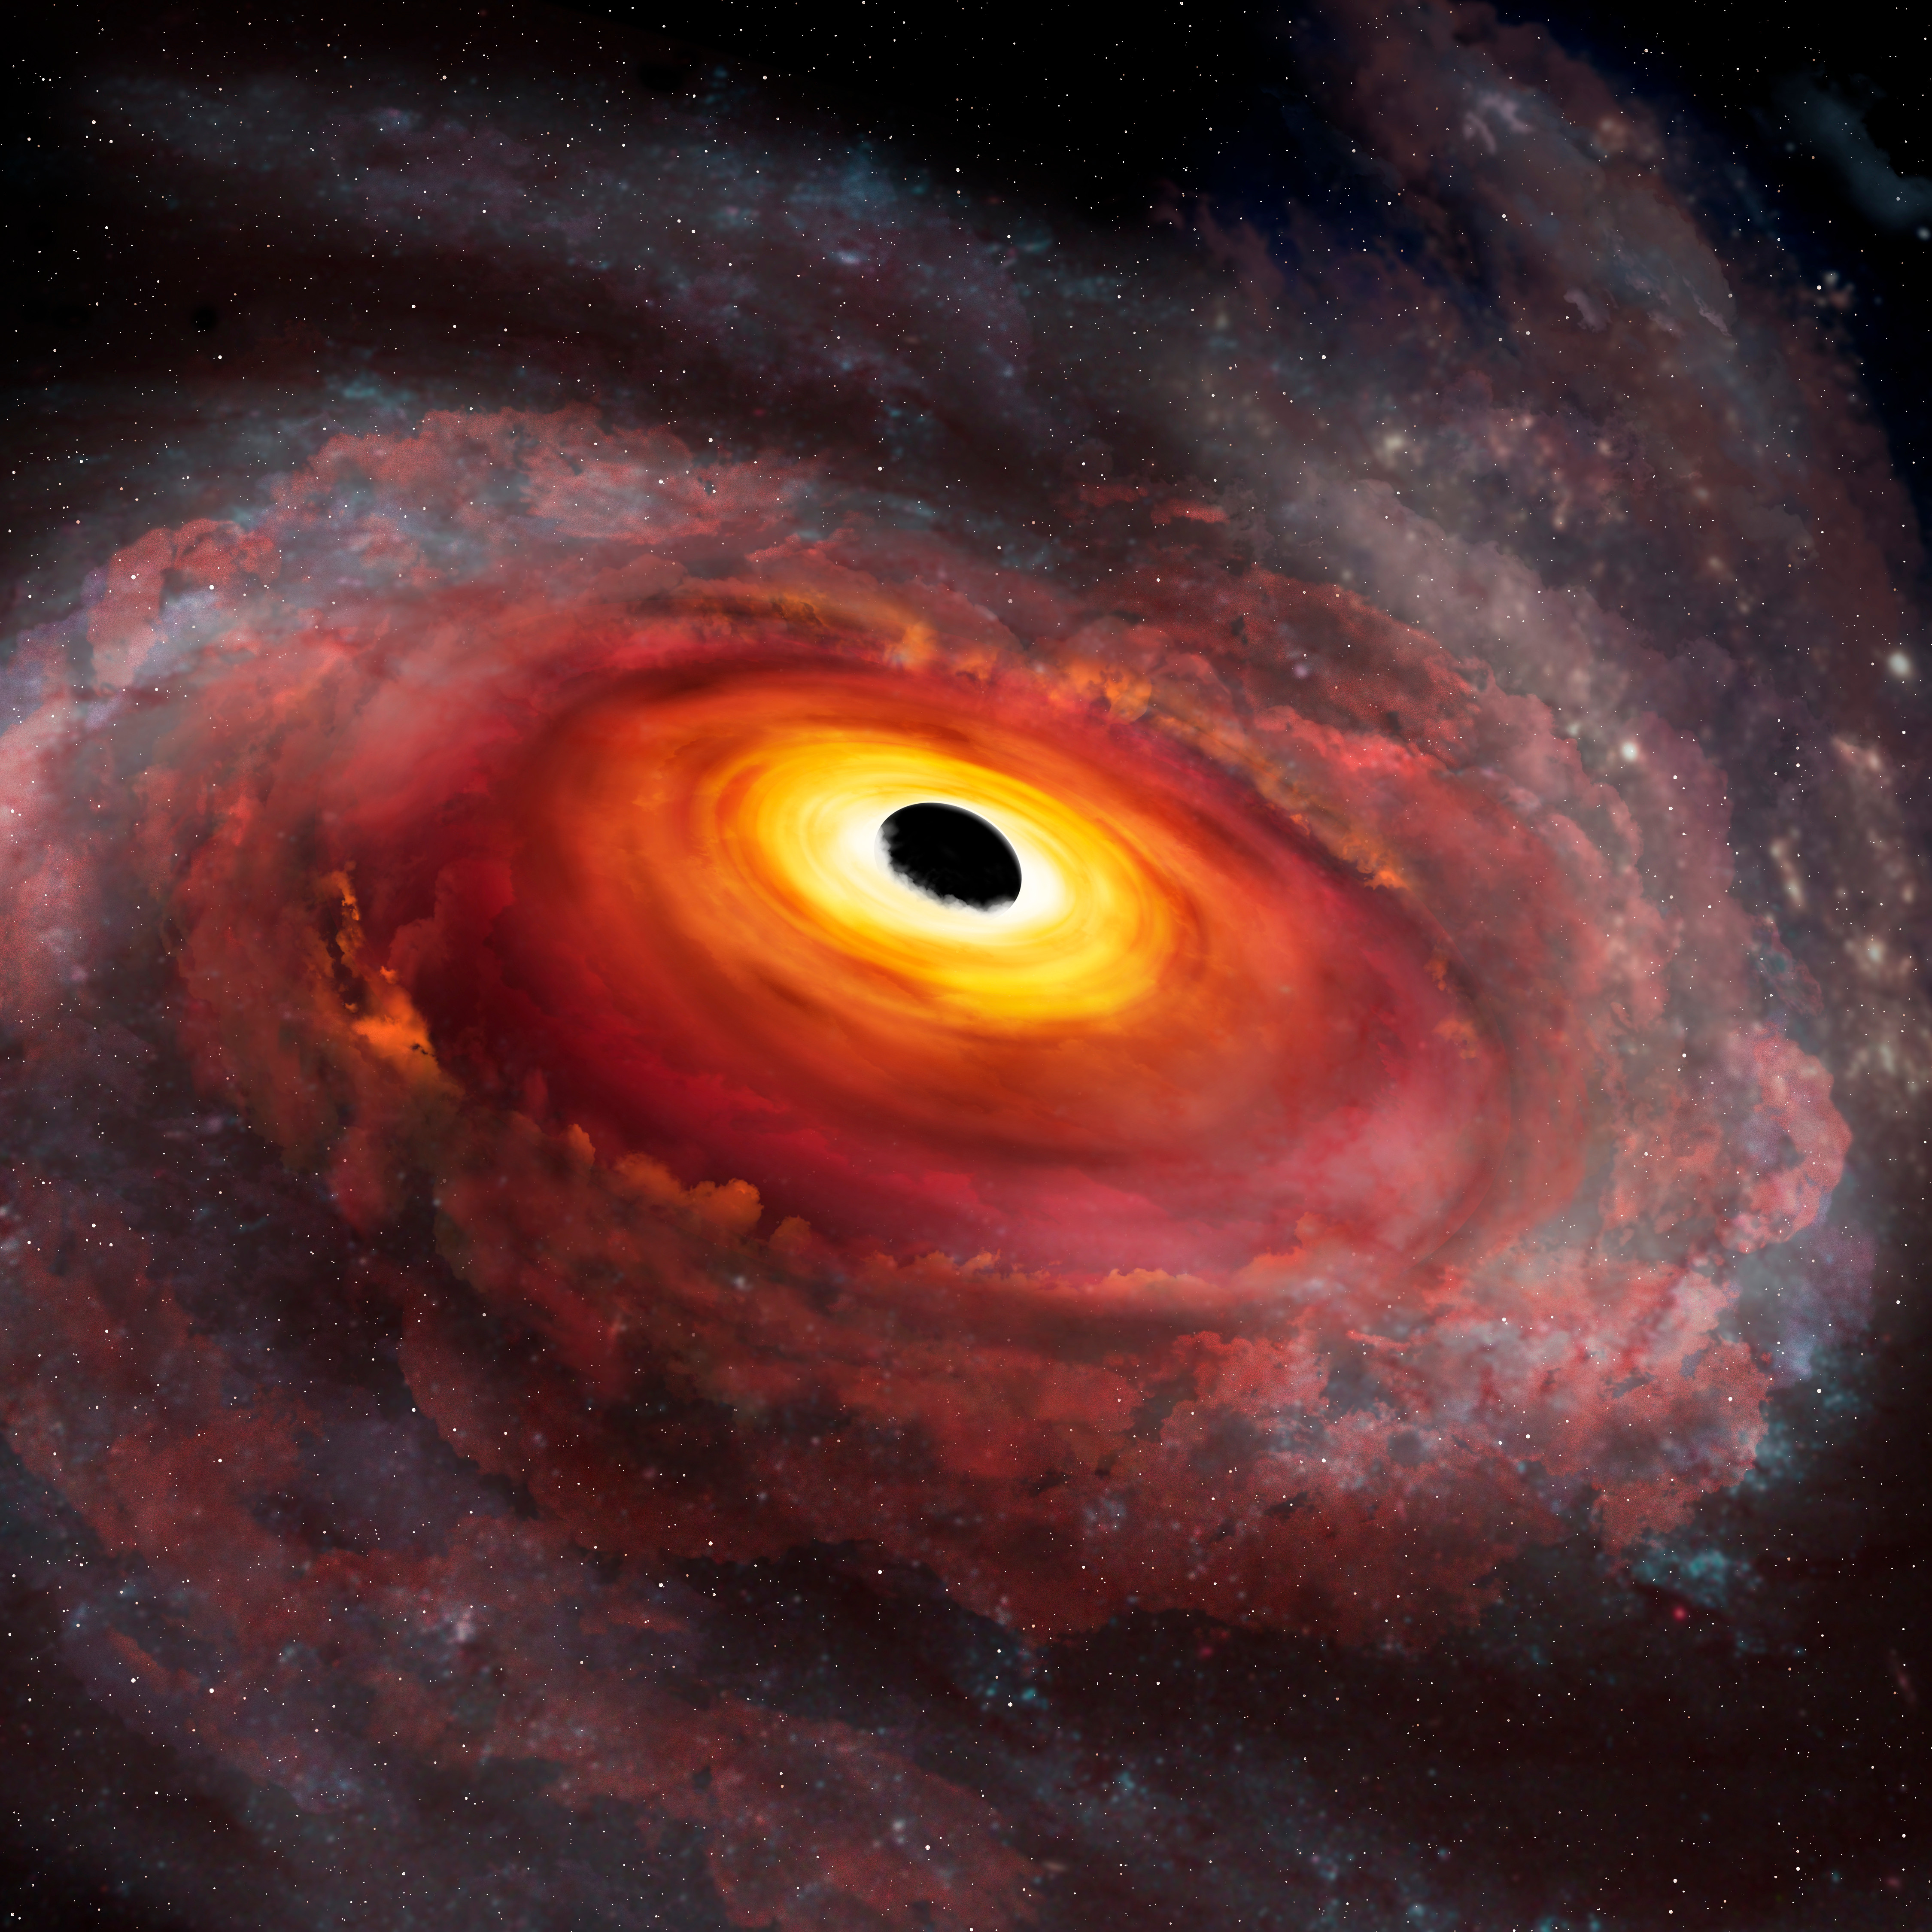
The image at left shows an artist’s conception of the central portion of the galaxy that hosts the quasar SDSS J135246.37+423923.5 viewed at optical wavelengths. Thick winds obscure our view, and imprint signatures of the energetic outflow on the SDSS spectrum. The image at right shows the same artist’s view at infrared wavelengths, as seen by the Gemini GNIRS detector. The thick outflow is transparent at infrared wavelengths, giving us a clear line of sight to the quasar. The infrared spectrum yields the quasar redshift, and from that reference frame, we measured the record-breaking outflow velocity. Credit: International Gemini Observatory/NOIRLab/NSF/AURA/P. Marenfeld
download: left image TIFF | JPEG, right image TIFF | JPEG

Researchers using the Gemini North telescope on Hawaiʻi’s Maunakea have detected the most energetic wind from any quasar ever measured. Credits: International Gemini Observatory/NOIRLab/NSF/AURA/P. Marenfeld/J. Pollard/ESA/Hubble/M.Kornmesser/ESO. Video

Researchers using the Gemini North telescope on Hawaiʻi’s Maunakea have detected the most energetic wind from any quasar ever measured. This outflow, which is travelling at nearly 13% of the speed of light, carries enough energy to dramatically impact star formation across an entire galaxy. The extragalactic tempest lay hidden in plain sight for 15 years before being unveiled by innovative computer modeling and new data from the international Gemini Observatory.

The most energetic wind from a quasar has been revealed by a team of astronomers using observations from the international Gemini Observatory, a program of NSF’s NOIRLab. This powerful outflow is moving into its host galaxy at almost 13% of the speed of light, and stems from a quasar known as SDSS J135246.37+423923.5 which lies roughly 60 billion light-years from Earth.

“While high-velocity winds have previously been observed in quasars, these have been carrying only a relatively small amount of mass,” explains Sarah Gallagher, an astronomer at Western University (Canada) who led the Gemini observations. “The outflow from this quasar, in comparison, sweeps along a tremendous amount of mass at incredible speeds. This wind is crazy powerful, and we don’t know how the quasar can launch something so substantial”. [1]

As well as measuring the outflow from SDSS J135246.37+423923.5, the team was also able to infer the mass of the supermassive black hole powering the quasar. This monstrous object is 8.6 billion times as massive as the Sun — about 2000 times the mass of the black hole in the center of our Milky Way and 50% more massive than the well-known black hole in the galaxy Messier 87.

This result is published in The Astrophysical Journal and the quasar studied here now holds the record for the most energetic quasar wind measured to date, with a wind more energetic than those recently reported in a study of 13 quasars [2].

Despite its mass and energetic outflow, the discovery of this powerhouse languished in a quasar survey for 15 years before the combination of Gemini data and the team’s innovative computer modeling method allowed it to be studied in detail.

“We were shocked — this isn’t a new quasar, but no one knew how amazing it was until the team got the Gemini spectra,” explains Karen Leighly, an astronomer at the University of Oklahoma who was one of the scientific leads for this research. “These objects were too hard to study before our team developed our methodology and had the data we needed, and now it looks like they might be the most interesting kind of windy quasars to study.”

Quasars — also known as quasi-stellar objects — are a type of extraordinarily luminous astrophysical object residing in the centres of massive galaxies [3]. Consisting of a supermassive black hole surrounded by a glowing disk of gas, quasars can outshine all the stars in their host galaxy and can drive winds powerful enough to influence entire galaxies [4].

“Some quasar-driven winds have enough energy to sweep the material from a galaxy that is needed to form stars and thus quench star formation,” explains Hyunseop (Joseph) Choi, a graduate student at the University of Oklahoma and the first author of the scientific paper on this discovery. “We studied a particularly windy quasar, SDSS J135246.37+423923.5, whose outflow is so thick that it’s difficult to detect the signature of the quasar itself at visible wavelengths.”

Despite the obstruction, the team was able to get a clear view of the quasar using the Gemini Near-Infrared Spectrograph (GNIRS) on Gemini North to observe at infrared wavelengths. Using a combination of high-quality spectra from Gemini and a pioneering computer modeling approach, the astronomers uncovered the nature of the outflow from the object — which proved, remarkably, to be more energetic than any quasar outflow previously measured.

The team’s discovery raises important questions, and also suggests there could be more of these quasars waiting to be found. “We don’t know how many more of these extraordinary objects are in our quasar catalogs that we just don't know about yet,” concludes Choi “Since automated software generally identifies quasars by strong emission lines or blue color — two properties our object lacks — there could be more of these quasars with tremendously powerful outflows hidden away in our surveys.”

“This extraordinary discovery was made possible with the resources provided by the international Gemini Observatory; the discovery opens new windows and opportunities to explore the Universe further in the years to come,” said Martin Still, an astronomy program director at the National Science Foundation, which funds Gemini Observatory from the U.S. as part of an international collaboration. “The Gemini Observatory continues to advance our knowledge of the Universe by providing the international science community with forefront access to telescope instrumentation and facilities.”


Notes

[1] The colossal energy carried by the quasar outflow is a product of both the speed of the wind and the amount of mass it carries. An intuitive way to understand this is to compare a freight train and a champion sprinter — while both travel at roughly the same speed, the more massive freight train has far more momentum and energy.

[2] This result is independent of the recent NASA/STScI press release on quasar winds which focused on strong winds in 13 other quasars.

[3] Quasars take their name from their first identification in the 1950’s at radio wavelengths. Quasar is a contraction of quasi-stellar radio source, a name chosen to reflect the starlike appearance of these radio sources when viewed at visible wavelengths.

[4] The gas feeding a quasar surrenders energy in the form of light as it falls into the central black hole. This emitted light is both the origin of a quasar’s luminosity and the source of the energy that drives outflows.


More information

This research was presented in the paper Discovery of a Remarkably Powerful Broad Absorption Line Quasar Outflow in SDSS J135246.37+423923.5 in The Astrophysical Journal.

The team was composed of Hyunseop Choi (The University of Oklahoma, USA) Karen M. Leighly (The University of Oklahoma, USA), Donald M. Terndrup (The University of Oklahoma, USA and The Ohio State University, USA), Sarah C. Gallagher (Western University, Canada, and the Canadian Space Agency), and Gordon T. Richards (Drexel University, USA).


Media Contact:

Peter Michaud
NewsTeam Manager
NSF’s NOIRLab
Gemini Observatory, Hilo HI
Cell: +1 808-936-6643
Email: pmichaud@gemini.edu

Science Contacts:

Karen Leighly
Professor
The University of Oklahoma
Email: leighly@ou.edu


Saturday, April 18, 2020

Discovery of a Young Blazar Produced by the Merger of Two Galaxies

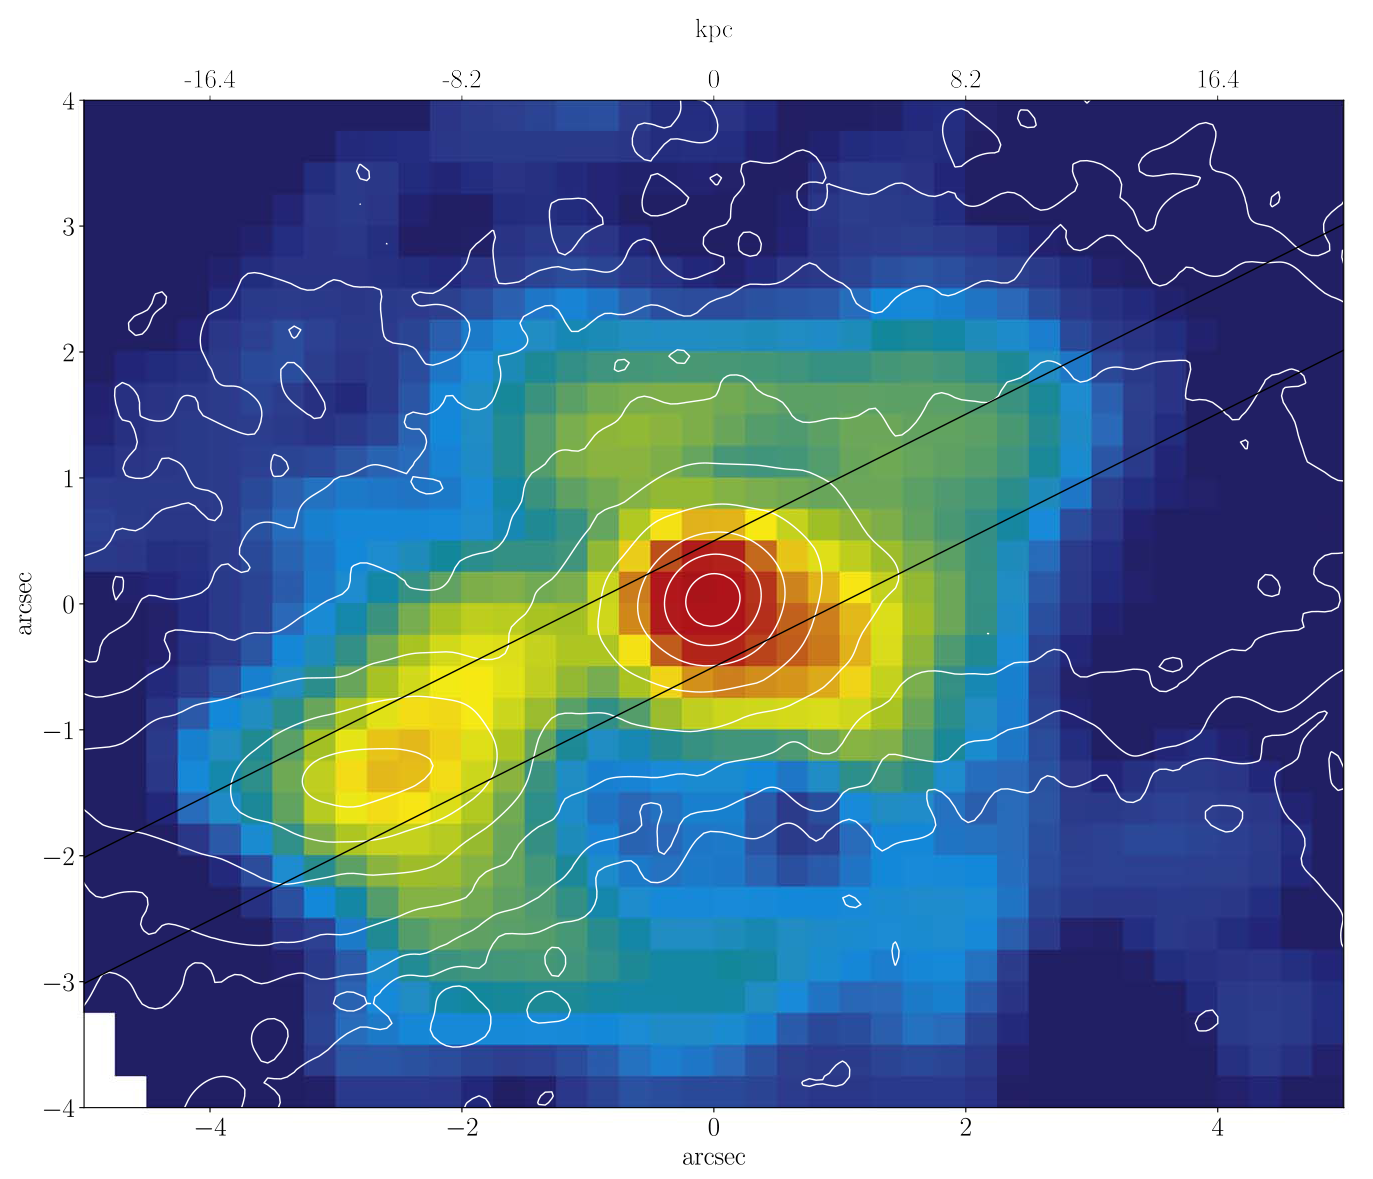
The galaxy TXS 2116-077 (seen on the right) collides with another spiral-shaped galaxy of similar mass, creating a relativistic jet in TXS 2116-077's centre. Both galaxies have AGNs. Shown here is an image of the emission in the H-alpha line with superposed isophotes of the infrared emission in the J band. Also shown in black lines is the region where a spectrum was obtained with ISIS on the WHT and OSIRIS on the Gran Telescopio Canarias (GTC). Figure extracted from Paliya et al., 2020, ApJ, 892, 133. Large format: PNG. 

A blazar is a particular type of active galactic nucleus (AGN) with a central supermassive black hole which emits a jet, a flux of highly energetic particles and radiation moving almost at the velocity of light, and which is aligned along the observer's line-of-sight. An international team of researchers has observed the birth of one of these objects for the first time by combining observations from several telescopes, among them the William Herschel Telescope (WHT). 

As a point of reference, scientists believe all large galaxies have centrally located massive black holes, but only about one per cent of these have active nuclei. For example, our Milky Way's massive black hole is dormant. The emission from an AGN can often exceed that of the host galaxy, and originates from the central black hole accreting circumnuclear gas. But not all this gas is accreted onto the black hole; some gets accelerated and spewed out in the form of narrow, bi-polar jets.

"Active galaxies which have jets are usually big, old elliptical galaxies which, according to the models, are formed by the merger of two or more smaller galaxies, so that we think that these mergers are the cause of the activation of the jets" says Rubén García-Benito, a researcher at the Instituto de Astrofísica de Andalucía (IAA-CSIC), who has participated in the discovery. "A galactic collision is a very efficient way to make large masses of gas fall to the centre of a galaxy, which feeds the supermassive black hole and can produce the emergence of the jet". 

Now, astronomers have imaged the formation of a jet from two younger, spiral-shaped galaxies, in the process of merging. In scientific terminology these young spiral galaxies containing jets are called Narrow Line Seyfert 1 gamma ray emitter galaxies (γ-NLSy1). 

Each merging galaxy shows a supermassive black hole at its centre. The more massive of the two shows a very young jet, with an estimated age less than 15,000 years, whose existence can be attributed to the interacton between the galaxies, which started at least 500 million years ago.

"We are seeing the jet face-on" explains Enrique Pérez Jiménez, a researcher at the IAA-CSIC and a co-author of the study, "so that we have found the precursor of a blazar. As an analogy we could say that if a blazar is an adult, a γ-NLSy1 is a child".

Jets are the most powerful astrophysical phenomena in the universe. They can emit more energy into the universe in one second than our sun will produce in its entire lifetime. That energy is in the form of radiation, such as intense radio waves, X-rays, and gamma-rays.

In general blazars are so bright that they occult the galaxies which host them, so that studying their environment is difficult. However the detected jet in this young galaxy is less energetic, which has permitted the study of the gas and the stars of the host galaxy, providing very valuable information to trace the origin of the jet.

The team obtained the image and the spectra using several of the largest ground-based telescopes in the world, such as the GTC and the WHT on La Palma, as well as the optical/infrared Subaru telescope on Hawaii, and NASA's Chandra X-ray satellite observatory. The WHT ISIS observations were obtained as part of a service programme.


More information:

Vaidehi S. Paliya, Enrique Pérez, Rubén García-Benito, Marco Ajello, Francisco Prada, Antxon Alberdi, Hyewon Suh, C. H. Ishwara Chandra, Alberto Domínguez, Stefano Marchesi, Tiziana Di Matteo, Dieter Hartmann, and Marco Chiaberge, 2020, "TXS 2116-077: A Gamma-Ray Emitting Relativistic Jet Hosted in a Galaxy Merger", ApJ, 892, 133. [ ADS ]

Clemson researchers capture first-ever photographic proof of power-packed jet emerging from colliding galaxies, Clemson University press release, 7th April 2020.

La Palma telescopes participate in the discovery of a young blazar produced by the merger of two galaxies, IAC press release, 7 April 2020.

La fusión de dos galaxias genera la versión juvenil de un blázar, uno de los objetos más energéticos conocidos, IAA press release, 7 April 2020.

Jets from a Galaxy Collision, AAS NOVA research highlights, 8 April 2020.


Based on observations made with the William Herschel Telescope operated on the island of La Palma by the Isaac Newton Group of Telescopes (ING) in the Spanish Observatorio del Roque de los Muchachos of the Instituto de Astrofísica de Canarias (IAC). The ING is funded by the Science and Technology Facilities Council (STFC-UKRI) of the United Kingdom, the Nederlandse Organisatie voor Wetenschappelijk Onderzoek (NWO) of the Netherlands, and the IAC in Spain. IAC's contribution to ING is funded by the Spanish Ministry of Science, Innovation and Universities.


Contact:

Javier Méndez  (Public Relations Officer)


Friday, April 17, 2020

VLASS, A Survey of the Radio Sky

The radio source 3C402. The greyscale background is an optical image of the field while the contours show earlier radio imaging results. The insets are new radio images from VLASS that show the previous radio source is actually two separate galaxies. VLASS; Lacy et al. 2020

Technological advances in recent years have increased the sensitivity of radio interferometers like the Karl G. Jansky Very Large Array (VLA) to the radio emission from astronomical sources in their continuum (not only in their lines) by factors of several, enabling them to see fainter and more distant objects. Radio interferometers obtain high spatial resolution details of astronomical sources, and the new VLA, in addition to its sensitivity and high resolution, can provide information about the polarization of the emission, enable more reliable large-scale mosaic images, and with repeating observations monitor temporal variations. Not least, a series of recent sensitive sky surveys at optical and infrared wavelengths justify completing a corresponding radio survey. When combined, these multi-wavelength all-sky surveys will permit astronomers to characterize stellar and galaxy populations in unprecedented detail.

CfA astronomers Edo Berger, Atish Kamble, and Peter Williams are members of the VLASS (The Very Large Array Sky Survey) team, a large group working on a unique radio all-sky survey having all the aforementioned capabilities and able to cover all of the sky visible from the VLA location in New Mexico. VLASS science has four themes: finding otherwise hidden explosions and/or transient events, probing astrophysical magnetic fields, imaging galaxies both near and distant, and using radio wavelengths to peer through dust obscuration effects to study the Milky Way. Each theme contains numerous subtopics. Hidden explosions, for example, will probe the explosive death throes of massive stars including supernovae, their role in cosmological studies, gamma-ray bursts; signs of mergers between black holes and neutron stars will have implications for gravitational wave detections.

VLASS observations, begun in September 2017, are expected to be completed in 2024. In a new paper, the team reviews the VLASS goals and first-look results from early observations, showing how the data successfully demonstrate the ability of the project to achieve all its proposed goals. VLASS includes an integral education and outreach component with two workshops on data visualization held in the first year to train users to produce images that are aesthetic as well as scientifically accurate. The first preliminary data and materials are now available to scientists and the public.

Reference(s):

"The Karl G. Jansky Very Large Array Sky Survey (VLASS). Science Case and Survey Design," M. Lacy et al., PASP, 132, 1, 2020.


Thursday, April 16, 2020

ESO Telescope Sees Star Dance Around Supermassive Black Hole, Proves Einstein Right

Artist’s impression of Schwarzschild precession

Orbits of stars around black hole at the heart of the Milky Way

Wide-field view of the centre of the Milky Way

Sagittarius A* in the constellation of Sagittarius


Videos

ESOcast 219 Light: Star Dance Around Supermassive Black Hole

Artist’s animation of S2’s precession effect

Zooming in on the heart of the Milky Way

The star S2 makes a close approach to the black hole at the centre of the Milky Way

Interview with Reinhard Genzel (in English)

Interview with Reinhard Genzel (in German)

Another artist’s impression of S2’s precession effect


Observations made with ESO’s Very Large Telescope (VLT) have revealed for the first time that a star orbiting the supermassive black hole at the centre of the Milky Way moves just as predicted by Einstein’s general theory of relativity. Its orbit is shaped like a rosette and not like an ellipse as predicted by Newton's theory of gravity. This long-sought-after result was made possible by increasingly precise measurements over nearly 30 years, which have enabled scientists to unlock the mysteries of the behemoth lurking at the heart of our galaxy.

“Einstein’s General Relativity predicts that bound orbits of one object around another are not closed, as in Newtonian Gravity, but precess forwards in the plane of motion. This famous effect — first seen in the orbit of the planet Mercury around the Sun — was the first evidence in favour of General Relativity. One hundred years later we have now detected the same effect in the motion of a star orbiting the compact radio source Sagittarius A* at the centre of the Milky Way. This observational breakthrough strengthens the evidence that Sagittarius A* must be a supermassive black hole of 4 million times the mass of the Sun,” says Reinhard Genzel, Director at the Max Planck Institute for Extraterrestrial Physics (MPE) in Garching, Germany and the architect of the 30-year-long programme that led to this result.

Located 26 000 light-years from the Sun, Sagittarius A* and the dense cluster of stars around it provide a unique laboratory for testing physics in an otherwise unexplored and extreme regime of gravity. One of these stars, S2, sweeps in towards the supermassive black hole to a closest distance less than 20 billion kilometres (one hundred and twenty times the distance between the Sun and Earth), making it one of the closest stars ever found in orbit around the massive giant. At its closest approach to the black hole, S2 is hurtling through space at almost three percent of the speed of light, completing an orbit once every 16 years. “After following the star in its orbit for over two and a half decades, our exquisite measurements robustly detect S2’s Schwarzschild precession in its path around Sagittarius A*,” says Stefan Gillessen of the MPE, who led the analysis of the measurements published today in the journal Astronomy & Astrophysics.

Most stars and planets have a non-circular orbit and therefore move closer to and further away from the object they are rotating around. S2’s orbit precesses, meaning that the location of its closest point to the supermassive black hole changes with each turn, such that the next orbit is rotated with regard to the previous one, creating a rosette shape. General Relativity provides a precise prediction of how much its orbit changes and the latest measurements from this research exactly match the theory. This effect, known as Schwarzschild precession, had never before been measured for a star around a supermassive black hole.

The study with ESO’s VLT also helps scientists learn more about the vicinity of the supermassive black hole at the centre of our galaxy. “Because the S2 measurements follow General Relativity so well, we can set stringent limits on how much invisible material, such as distributed dark matter or possible smaller black holes, is present around Sagittarius A*. This is of great interest for understanding the formation and evolution of supermassive black holes,” say Guy Perrin and Karine Perraut, the French lead scientists of the project.

This result is the culmination of 27 years of observations of the S2 star using, for the best part of this time, a fleet of instruments at ESO’s VLT, located in the Atacama Desert in Chile. The number of data points marking the star’s position and velocity attests to the thoroughness and accuracy of the new research: the team made over 330 measurements in total, using the GRAVITY, SINFONI and NACO instruments. Because S2 takes years to orbit the supermassive black hole, it was crucial to follow the star for close to three decades, to unravel the intricacies of its orbital movement.

The research was conducted by an international team led by Frank Eisenhauer of the MPE with collaborators from France, Portugal, Germany and ESO. The team make up the GRAVITY collaboration, named after the instrument they developed for the VLT Interferometer, which combines the light of all four 8-metre VLT telescopes into a super-telescope (with a resolution equivalent to that of a telescope 130 metres in diameter). The same team reported in 2018 another effect predicted by General Relativity: they saw the light received from S2 being stretched to longer wavelengths as the star passed close to Sagittarius A*. “Our previous result has shown that the light emitted from the star experiences General Relativity. Now we have shown that the star itself senses the effects of General Relativity,” says Paulo Garcia, a researcher at Portugal’s Centre for Astrophysics and Gravitation and one of the lead scientists of the GRAVITY project.

With ESO’s upcoming Extremely Large Telescope, the team believes that they would be able to see much fainter stars orbiting even closer to the supermassive black hole. “If we are lucky, we might capture stars close enough that they actually feel the rotation, the spin, of the black hole,” says Andreas Eckart from Cologne University, another of the lead scientists of the project. This would mean astronomers would be able to measure the two quantities, spin and mass, that characterise Sagittarius A* and define space and time around it. “That would be again a completely different level of testing relativity," says Eckart.


More Information

This research was presented in the paper “Detection of the Schwarzschild precession in the orbit of the star S2 near the Galactic centre massive black hole” to appear in Astronomy & Astrophysics (DOI: 10.1051/0004-6361/202037813).

The GRAVITY Collaboration team is composed of R. Abuter (European Southern Observatory, Garching, Germany [ESO]), A. Amorim (Universidade de Lisboa - Faculdade de Ciências, Portugal and Centro de Astrofísica e Gravitação, IST, Universidade de Lisboa, Portugal [CENTRA]), M. Bauböck (Max Planck Institute for Extraterrestrial Physics, Garching, Germany [MPE]), J.P. Berger (Univ. Grenoble Alpes, CNRS, Grenoble, France [IPAG] and ESO), H. Bonnet (ESO), W. Brandner (Max Planck Institute for Astronomy, Heidelberg, Germany [MPIA]), V. Cardoso (CENTRA and CERN, Genève, Switzerland), Y. Clénet (Observatoire de Paris, Université PSL, CNRS, Sorbonne Université, Université de Paris, Meudon, France [LESIA], P.T. de Zeeuw (Sterrewacht Leiden, Leiden University, The Netherlands and MPE), J. Dexter (Department of Astrophysical & Planetary Sciences, JILA, Duane Physics Bldg.,University of Colorado, Boulder, USA and MPE), A. Eckart (1st Institute of Physics, University of Cologne, Germany [Cologne] and Max Planck Institute for Radio Astronomy, Bonn, Germany), F. Eisenhauer (MPE), N.M. Förster Schreiber (MPE), P. Garcia (Faculdade de Engenharia, Universidade do Porto, Portugal and CENTRA), F. Gao (MPE), E. Gendron (LESIA), R. Genzel (MPE, Departments of Physics and Astronomy, Le Conte Hall, University of California, Berkeley, USA), S. Gillessen (MPE), M. Habibi (MPE), X. Haubois (European Southern Observatory, Santiago, Chile [ESO Chile]), T. Henning (MPIA), S. Hippler (MPIA), M. Horrobin (Cologne), A. Jiménez-Rosales (MPE), L. Jochum (ESO Chile), L. Jocou (IPAG), A. Kaufer (ESO Chile), P. Kervella (LESIA), S. Lacour (LESIA), V. Lapeyrère (LESIA), J.-B. Le Bouquin (IPAG), P. Léna (LESIA), M. Nowak (Institute of Astronomy, Cambridge, UK and LESIA), T. Ott (MPE), T. Paumard (LESIA), K. Perraut (IPAG), G. Perrin (LESIA), O. Pfuhl (ESO, MPE), G. Rodríguez-Coira (LESIA), J. Shangguan (MPE), S. Scheithauer (MPIA), J. Stadler (MPE), O. Straub (MPE), C. Straubmeier (Cologne), E. Sturm (MPE), L.J. Tacconi (MPE), F. Vincent (LESIA), S. von Fellenberg (MPE), I. Waisberg (Department of Particle Physics & Astrophysics, Weizmann Institute of Science, Israel and MPE), F. Widmann (MPE), E. Wieprecht (MPE), E. Wiezorrek (MPE), J. Woillez (ESO), and S. Yazici (MPE, Cologne).

ESO is the foremost intergovernmental astronomy organisation in Europe and the world’s most productive ground-based astronomical observatory by far. It has 16 Member States: Austria, Belgium, the Czech Republic, Denmark, France, Finland, Germany, Ireland, Italy, the Netherlands, Poland, Portugal, Spain, Sweden, Switzerland and the United Kingdom, along with the host state of Chile and with Australia as a Strategic Partner. ESO carries out an ambitious programme focused on the design, construction and operation of powerful ground-based observing facilities enabling astronomers to make important scientific discoveries. ESO also plays a leading role in promoting and organising cooperation in astronomical research. ESO operates three unique world-class observing sites in Chile: La Silla, Paranal and Chajnantor. At Paranal, ESO operates the Very Large Telescope and its world-leading Very Large Telescope Interferometer as well as two survey telescopes, VISTA working in the infrared and the visible-light VLT Survey Telescope. Also at Paranal ESO will host and operate the Cherenkov Telescope Array South, the world’s largest and most sensitive gamma-ray observatory. ESO is also a major partner in two facilities on Chajnantor, APEX and ALMA, the largest astronomical project in existence. And on Cerro Armazones, close to Paranal, ESO is building the 39-metre Extremely Large Telescope, the ELT, which will become “the world’s biggest eye on the sky”.


Links


Contacts

Reinhard Genzel
Director, Max Planck Institute for Extraterrestrial Physics
Garching bei München, Germany
Tel: +49 89 30000 3280

Stefan Gillessen
Max-Planck Institute for Extraterrestrial Physics
Garching bei München, Germany
Tel: +49 89 30000 3839
Cell: +49 176 99 66 41 39

Frank Eisenhauer
Max-Planck Institute for Extraterrestrial Physics
Garching bei München, Germany
Tel: +49 89 30000 3563
Cell: +49 162 3105080

Paulo Garcia
Faculdade de Engenharia, Universidade do Porto and Centro de Astrofísica e Gravitação, IST, Universidade de Lisboa, Portugal
Porto, Portugal
Cell: +351 963235785

Karine Perraut
IPAG of Université Grenoble Alpes/CNRS
Grenoble, France

Guy Perrin
LESIA – Observatoire de Paris - PSL
Meudon, France

Andreas Eckart
1st Institute of Physics, University of Cologne
Cologne, Germany
Tel: +49 221 470 3546

Bárbara Ferreira
ESO Public Information Officer
Garching bei München, Germany
Tel: +49 89 3200 6670
Cell: +49 151 241 664 00
Email: pio@eso.org

Source: ESO/News


Scientists Discover Brightest Supernova Ever Seen

Artist's conception of SN2016aps, a candidate pulsational pair instability supernova. The explosion energy of SN2016aps, fueled by the shedding of a massive shell of gas, was ten times that of a normal-sized supernova, making SN2016aps the most massive supernova ever identified. Credit: M. Weiss. High Resolution (jpg) - Low Resolution (jpg)

Cambridge, MA - Scientists at the Center for Astrophysics | Harvard & Smithsonian today announced the discovery and study of the brightest, most energetic, and likely most massive supernova ever identified.

SN2016aps is believed to be an example of a "pulsational pair instability" supernova, and may have formed as the result of the merging of two massive stars prior to the explosion. The explosion energy of SN2016aps was ten times that of a normal-sized supernova.

"SN2016aps is spectacular in several ways," said Edo Berger, Harvard University professor and co-author on the paper. "Not only is it brighter than any other supernova we’ve ever seen, but it has several properties and features that make it rare in comparison to other explosions of stars in the universe."

The team—made up of researchers from CfA, University of Birmingham, Northwestern University, and Ohio University—first identified the supernova in 2016 using data from the Panoramic Survey Telescopes and Rapid Response System (Pan-STARRS). A four-year follow-up study tracked its slow evolution and significant energy release. Archival images retrieved during the study revealed a rising light curve dating back to December 2015, allowing the team to better understand the nature and explosion of the supernova.

In a typical supernova, radiation in visible light accounts for just one percent of the total explosion energy of 10^51 erg. In SN2016aps, the explosion energy of 10^52 erg is unprecedented, and the supernova radiated about 50 percent of this energy, making it outshine normal supernova explosions by 500 times.

"The intense energy output of this supernova pointed to an incredibly massive star progenitor," said Berger. "At birth, this star was at least 100 times the mass of our Sun."

Scientists don't believe the explosion got that big on its own. "Spectroscopic observations during the followup study revealed a restless history for the progenitor star,” said Matt Nicholl, of the University of Birmingham and lead author of the study. "We determined that in the final years before it exploded, the star shed a massive shell of gas as it violently pulsated. The collision of the explosion debris with this massive shell led to the incredible brightness of the supernova. It essentially added fuel to the fire."

SN2016aps also held another surprise for scientists: high levels of hydrogen gas. Massive stars typically lose the majority of their hydrogen to stellar winds long before they begin pulsating. "That SN2016aps held onto its hydrogen prompted us to theorize that two less massive stars had merged together, since lower mass stars hold onto their hydrogen for longer,” said Berger. "The new star, borne of the merger, was heavy with hydrogen and also high enough in mass to trigger pair instability."

Future research regarding extremely luminous supernovae is bright, according to Berger. "The identification of SN2016aps has opened pathways to identifying similar events from the first generations of stars. With the upcoming LSST we can find such explosions from the first billion years in the history of the universe, and there will be plenty of examples then."

In addition to Pan-STARRS, the researchers used data from the MMT Observatory at the Fred Lawrence Whipple Observatory in Amado, Arizona; the Hubble Space Telescope; and, the Keck and Gemini Observatories in Hawaii. Other collaborating institutions included Stockholm University, Copenhagen University, California Institute of Technology, and Space Telescope Science Institute. The research was funded by grants from the National Science Foundation, NASA, and the Horizon 2020 European Union Framework, along with a Royal Astronomical Society Research Fellowship.
Results from the study are published in Nature Astronomy.

About Center for Astrophysics | Harvard & Smithsonian

Headquartered in Cambridge, Mass., the Center for Astrophysics | Harvard & Smithsonian (CfA) is a collaboration between the Smithsonian Astrophysical Observatory and the Harvard College Observatory. CfA scientists, organized into six research divisions, study the origin, evolution and ultimate fate of the universe.

For more information, contact:

Amy Oliver
Public Affairs
Center for Astrophysics | Harvard & Smithsonian
Fred Lawrence Whipple Observatory
520-879-4406
amy.oliver@cfa.harvard.edu


Wednesday, April 15, 2020

NASA Missions Help Reveal the Power of Shock Waves in a Nova Explosion

A GIF cycles between an image of V906 Carinae taken on April 7, 2018, about 18 days after the nova's discovery and near its peak brightness, and one showing its faded appearance on May 4, 2019. Credit: Copyright 2018 by W. Paech + F. Hofmann, Team Chamaeleon, Chamaeleon and Onjala Observatory, Namibia, used with permission.​

Unprecedented observations of a nova outburst in 2018 by a trio of satellites, including two NASA missions, have captured the first direct evidence that most of the explosion’s visible light arose from shock waves — abrupt changes of pressure and temperature formed in the explosion debris.

A nova is a sudden, short-lived brightening of an otherwise inconspicuous star. It occurs when a stream of hydrogen from a companion star flows onto the surface of a white dwarf, a compact stellar cinder not much larger than Earth. NASA’s Fermi and NuSTAR space telescopes, together with the Canadian BRITE-Toronto satellite and several ground-based facilities, studied the nova.

NASA’s Fermi and NuSTAR space telescopes, together with another satellite named BRITE-Toronto, are providing new insights into a nova explosion that erupted in 2018. Detailed measurements of bright flares in the explosion clearly show that shock waves power most of the nova's visible light. Credits: NASA’s Goddard Space Flight Center.  Download high-resolution video and images from NASA’s Scientific Visualization Studio

“Thanks to an especially bright nova and a lucky break, we were able to gather the best-ever visible and gamma-ray observations of a nova to date,” said Elias Aydi, an astronomer at Michigan State University in East Lansing who led an international team from 40 institutions. “The exceptional quality of our data allowed us to distinguish simultaneous flares in both optical and gamma-ray light, which provides smoking-gun evidence that shock waves play a major role in powering some stellar explosions.”

The 2018 outburst originated from a star system later dubbed V906 Carinae, which lies about 13,000 light-years away in the constellation Carina. Over time — perhaps tens of thousands of years for a so-called classical nova like V906 Carinae — the white dwarf’s deepening hydrogen layer reaches critical temperatures and pressures. It then erupts in a runaway reaction that blows off all of the accumulated material.

Each nova explosion releases a total of 10,000 to 100,000 times the annual energy output of our Sun. Astronomers discover about 10 novae each year in our galaxy.

Fermi detected its first nova in 2010 and has observed 14 to date. Although X-ray and radio studies had shown the presence of shock waves in nova debris in the weeks after the explosions reached peak brightness, the Fermi discovery came as a surprise.

Gamma rays — the highest-energy form of light — require processes that accelerate subatomic particles to extreme energies. When these particles interact with each other and with other matter, they produce gamma rays. But astronomers hadn’t expected novae to be powerful enough to produce the required degree of acceleration.

Because the gamma rays appear at about the same time as the peak in visible light, astronomers concluded that shock waves play a more fundamental role in the explosion and its aftermath.

In 2015, a paper led by Brian Metzger at Columbia University in New York showed how comparing Fermi gamma-ray data with optical observations would allow scientists to learn more about nova shock waves. In 2017, a study led by Kwon-Lok Li at Michigan State found that the overall gamma-ray and visible emissions rose and fell in step in a nova known as V5856 Sagittarii. This implied shock waves produced more of the eruption’s light than the white dwarf itself.

The new observations from V906 Carinae, presented in a paper led by Aydi and published on Monday, April 13, in Nature Astronomy, spectacularly confirm this conclusion.

On March 20, 2018, the All-Sky Automated Survey for Supernovae, a set of two dozen robotic telescopes distributed around the globe and operated by Ohio State University, discovered the nova. 
By month’s end, V906 Carinae was dimly visible to the naked eye.

Fortuitously, a satellite called BRITE-Toronto was already studying the nova’s patch of sky. This miniature spacecraft is one of five 7.9-inch (20 centimeter) cubic nanosatellites comprising the Bright Target Explorer (BRITE) Constellation. Operated by a consortium of universities from Canada, Austria and Poland, the BRITE satellites study the structure and evolution of bright stars and observe how they interact with their environments.

BRITE-Toronto was monitoring a red giant star called HD 92063, whose image overlapped the nova’s location. The satellite observed the star for 16 minutes out of every 98-minute orbit, returning about 600 measurements each day and capturing the nova’s changing brightness in unparalleled detail.

“BRITE-Toronto revealed eight brief flares that fired up around the time the nova reached its peak, each one nearly doubling the nova’s brightness,” said Kirill Sokolovsky at Michigan State. “We’ve seen hints of this behavior in ground-based measurements, but never so clearly. Usually we monitor novae from the ground with many fewer observations and often with large gaps, which has the effect of hiding short-term changes.”

Fermi, on the other hand, almost missed the show. Normally its Large Area Telescope maps gamma rays across the entire sky every three hours. But when the nova appeared, the Fermi team was busy troubleshooting the spacecraft’s first hardware problem in nearly 10 years of orbital operations — a drive on one of its solar panels stopped moving in one direction. Fermi returned to work just in time to catch the nova’s last three flares.

In fact, V906 Carinae was at least twice as bright at billion-electron-volt, or GeV, energies as any other nova Fermi has observed. For comparison, the energy of visible light ranges from about 2 to 3 electron volts.

“When we compare the Fermi and BRITE data, we see flares in both at about the same time, so they must share the same source — shock waves in the fast-moving debris,” said Koji Mukai, an astrophysicist at the University of Maryland Baltimore County and NASA’s Goddard Space Flight Center in Greenbelt, Maryland. “When we look more closely, there is an indication that the flares in gamma rays may lead the flares in the visible. The natural interpretation is that the gamma-ray flares drove the optical changes.”

V906 Carinae (circled) shines near peak brightness in this image taken on March 23, 2018, three days after the nova was discovered. The beautiful cloud of gas and dust dominating the picture is part of the Carina Nebula. Credits: Copyright 2018 by A. Maury and J. Fabrega, used with permission

The team also observed the eruption’s final flare using NASA’s NuSTAR space telescope, which is only the second time the spacecraft has detected X-rays during a nova’s optical and gamma-ray emission. The nova’s GeV gamma-ray output far exceeded the NuSTAR X-ray emission, likely because the nova ejecta absorbed most of the X-rays. High-energy light from the shock waves was repeatedly absorbed and reradiated at lower energies within the nova debris, ultimately only escaping at visible wavelengths.

Putting all of the observations together, Aydi and his colleagues describe what they think happened when V906 Carinae erupted. During the outburst’s first few days, the orbital motion of the stars swept a thick debris cloud made of multiple shells of gas into a doughnut shape that appeared roughly edge-on from our perspective. The cloud expanded outward at less than about 1.3 million mph (2.2 million kph), comparable to the average speed of the solar wind flowing out from the Sun.

Next, an outflow moving about twice as fast slammed into denser structures within the doughnut, creating shock waves that emitted gamma rays and visible light, including the first four optical flares.

Finally, about 20 days after the explosion, an even faster outflow crashed into all of the slower debris at around 5.6 million mph (9 million kph). This collision created new shock waves and another round of gamma-ray and optical flares. The nova outflows likely arose from residual nuclear fusion reactions on the white dwarf’s surface.

Astronomers have proposed shock waves as a way to explain the power radiated by various kinds of short-lived events, such as stellar mergers, supernovae — the much bigger blasts associated with the destruction of stars — and tidal disruption events, where black holes shred passing stars. The BRITE, Fermi and NuSTAR observations of V906 Carinae provide a dramatic record of such a process.   Further studies of nearby novae will serve as laboratories for better understanding the roles shock waves play in other more powerful and more distant events.

The Fermi Gamma-ray Space Telescope is an astrophysics and particle physics partnership managed by NASA's Goddard Space Flight Center in Greenbelt, Maryland. Fermi was developed in collaboration with the U.S. Department of Energy, with important contributions from academic institutions and partners in France, Germany, Italy, Japan, Sweden and the United States.

NuSTAR is a Small Explorer mission led by Caltech and managed by JPL for NASA's Science Mission Directorate in Washington. NuSTAR was developed in partnership with the Danish Technical University and the Italian Space Agency (ASI). The spacecraft was built by Orbital Sciences Corp. in Dulles, Virginia. NuSTAR's mission operations center is at the University of California Berkeley, and the official data archive is at NASA's High Energy Astrophysics Science Archive Research Center. ASI provides the mission's ground station and a mirror archive. Caltech manages JPL for NASA.

By Francis Reddy
NASA’s Goddard Space Flight Center, Greenbelt, Md.

Media contact:

Claire Andreoli
NASA’s Goddard Space Flight Center, Greenbelt, Md.
(301) 286-1940

 Editor: Francis Reddy


Tuesday, April 14, 2020

Piercing the Dark Birthplaces of Massive Stars with Webb

The Snake is a serpentine-shaped, extremely filamentary cloud. In this infrared image from the Spitzer Space Telescope, the blue dots are stars relatively undimmed by dust, while the red dots are embedded, forming stars. Credits: NASA, JPL-Caltech, and S.Carey (SSC/Caltech)

More than 100,000 times the mass of the Sun, the Brick doesn’t seem to be forming any massive stars—yet. But based on its immense mass in such a small area, if it does form stars—as scientists think it should—it would be one of the most massive star clusters in the Milky Way galaxy. Credits: NASA, JPL-Caltech, and S.V Ramirez (NExScI/Caltech). Release images

High-mass stars, which are eight or more times the mass of our Sun, live hard and die young. They often end their short lives in violent explosions called supernova, but their births are much more of a mystery. They form in very dense, cold clouds of gas and dust, but little is known about these regions. In 2021, shortly after the launch of NASA’s James Webb Space Telescope, scientists plan to study three of these clouds to understand their structure.

“What we’re trying to do is look at the birthplaces of massive stars,” explained Erick Young, principal investigator of a program that will use Webb to study this phenomenon. He is an astronomer with the Universities Space Research Association in Columbia, Maryland. “Determining the actual structure of the clouds is very important in trying to understand the star-formation process,” he said.

These cold clouds—which can have up to 100,000 times the mass of the Sun—are so dense that they appear as big, dark blobs on the sky. While they seem devoid of stars, the clouds are actually just obscuring the light from background stars. These dark patches are so thick with dust that they even block out some wavelengths of infrared light, a type of light that is invisible to human eyes and can usually penetrate through dusty clouds. That’s why they are called “infrared-dark clouds.” However, the unprecedented sensitivity of Webb enables observations of background stars even through these very dense regions.

Birth Environments and Cookie Dough

To understand how massive stars form, you have to understand the environment in which they form. But one of the things that makes studying massive star formation so difficult is that as soon as a star turns on, it radiates intense ultraviolet light and strong and powerful winds.

“These forces destroy the birth environment that the star was created in,” explained infrared-dark-cloud expert Cara Battersby, an assistant professor of physics at the University of Connecticut. “The environment you’re looking at after it formed is totally different from the environment that was conducive to its forming in the first place. And since we know that infrared-dark clouds are places where massive stars can form, if we look at their structure before stars have formed or have just started to form, we can study what environment is needed to form those massive stars.”

Battersby likens the process to baking cookies: As soon as you bake them, they’re totally different from the dough itself. If you’ve never seen dough before, you may not have a good idea of what that baking process would look like. The infrared-dark clouds are like the raw dough before you bake it. Studying these clouds is akin to getting a chance to look at the cookie dough, seeing what goes into it, and learning what its consistency is.

The Importance of Massive Stars

Understanding massive stars and their environments is important for a variety of reasons. First, in their explosive deaths, they release many elements that are essential for life. Elements heavier than hydrogen and helium—including the building blocks of life on Earth—come from inside massive stars. Massive stars have transformed a universe that was almost completely composed of hydrogen to the rich, complex environment that is able to produce planets and people.

Massive stars also produce enormous amounts of energy. As soon as they are born, they give off light, radiation and winds that can create bubbles in the interstellar medium, possibly sparking star formation in different locations. These expanding bubbles could also break up a region where new stars are forming. Finally, when a massive star dies in a spectacular explosion, it forever changes its surroundings.

The Targets 

The study will focus Webb on the following three areas:
  • The Brick: One of the darkest infrared-dark clouds in our galaxy, this roughly brick-shaped cloud resides near the galaxy’s center, about 26,000 light-years from Earth. More than 100,000 times the mass of the Sun, the Brick doesn’t seem to be forming any massive stars—yet. But it has so much mass in such a small area that if it does form stars, as scientists think it should, it would be one of the most massive star clusters in our galaxy—much like the Arches and Quintuplet clusters, also in the neighborhood of the galaxy’s center.
  • The Snake: With a name inspired by its serpentine shape, this extremely filamentary cloud is about 12,000 light-years away with a total mass of 100,000 Suns. Scattered along the Snake are warm, dense dust clouds, each containing about 1,000 times the mass of the Sun in gas and dust. These clouds are being heated by young, massive stars forming inside of them. The Snake may be a section of a much longer filament that is a “Bone of the Milky Way,” tracing out the galaxy’s spiral structure.
  • IRDC 1822: Located about 11,000 light-years away, this cloud is also part of a “Bone of the Milky Way.” It shows active, massive star formation happening in one side of it, while the other side seems completely quiet and unperturbed. A bubble on the active side is already starting to destroy the initial filament that was there before. While the quiescent side has not started forming stars yet, it probably will soon.

The Technique

To study these clouds, Young and his team will use background stars as probes. “The more stars that you have, the more different lines of sight,” said Young. “Each one is like a little pencil beam, and by measuring the color of the star, you can assess how much dust is in that particular line of sight.”

The scientists will make maps—basically, very deep images—in four different infrared wavelengths. Each wavelength has a different ability to penetrate the cloud. “If you look at a given star and see that it’s actually a lot redder than you expect, then you can surmise that its light has actually gone through some dust, and the dust has made the color redder than the typical, unobscured star,” said Young.

By observing the difference in color based on these four different measurements in the near-infrared, and comparing that with a model of dust dimming and reddening, Young and his team can measure the dust in that particular line of sight. Webb will allow them to do that for thousands and thousands of stars that penetrate each cloud, giving them a wealth of data points. Since most stars of a given type are similar to each other in brightness and color, any marked differences that Webb can observe are mostly due to the effects of material between us and the stars.

Only with Webb

This work can only be done because of Webb’s exquisite sensitivity and excellent angular resolution. Webb’s sensitivity enables scientists to see fainter stars and a higher density of background stars. Its angular resolution, the ability to distinguish tiny details of an object, allows astronomers to discriminate between individual stars.

This science is being conducted as part of a Webb Guaranteed Time Observations (GTO) program. This program is designed to reward scientists who helped develop the key hardware and software components or technical and interdisciplinary knowledge for the observatory. Young was part of the original instrument team that built Webb’s Near Infrared Camera (NIRCam) instrument.

The James Webb Space Telescope will be the world’s premier space science observatory when it launches in 2021. Webb will solve mysteries in our solar system, look beyond to distant worlds around other stars, and probe the mysterious structures and origins of our universe and our place in it. Webb is an international program led by NASA with its partners, ESA (European Space Agency) and the Canadian Space Agency.

Contact:

Ann Jenkins / Christine Pulliam
Space Telescope Science Institute, Baltimore, Maryland
410-338-4488 / 410-338-4366
jenkins@stsci.edu / cpulliam@stsci.edu


Related Links:

NASA's Webb Portal


Monday, April 13, 2020

The Core Rocks!

Fig. 1. A simulated X-ray image and its residual image
One of the X-ray surface brightness profiles produced by their numerical simulation (left) and its X-ray residual image after removing its global profile calculated by their novel algorithm (right). Left: Brighter colors (e.g., red and white) and darker colors (e.g., blue) correspond to the bright and faint regions of the X-ray surface brightness, respectively. The cluster center is the center of this image. The white contours show the shape of the dark matter halo. Right: Brighter colors (e.g., red and white) and darker colors (e.g., blue) correspond to the larger positive and negative excess in the X-ray residual image. The white and black areas show the positive and negative excess regions detected by their novel algorithm. The shape of both regions look like spiral, which is a well-known feature of sloshing gas. Credit: Ueda Shutaro/ASIA

Fig. 2. One of the observed X-ray images in our cluster sample and its residual image.
One of the X-ray surface brightness profiles produced by their numerical simulation (left) and its X-ray residual image after removing its global profile calculated by their novel algorithm (right). Left: Brighter colors (e.g., red and white) and darker colors (e.g., blue) correspond to the bright and faint regions of the X-ray surface brightness, respectively. The cluster center is the center of this image. The white contours show the shape of the dark matter halo. Right: Brighter colors (e.g., red and white) and darker colors (e.g., blue) correspond to the larger positive and negative excess in the X-ray residual image. The white and black areas show the positive and negative excess regions detected by their novel algorithm. The shape of both regions look like spiral, which is a well-known feature of sloshing gas. Credit: Ueda Shutaro/ASIAA

Hunting the sloshing gas in the center of massive galaxy clusters

Galaxy clusters are the largest gravitationally bound objects in the universe. While it is well known that all galaxy clusters all galaxy clusters have experienced mergers and collisions through gravitational interactions, how mergers affect the evolution of galaxy clusters is still a mystery. Previous studies conducted by ASIAA astronomers including Dr. Shutaro Ueda have pointed out that “sloshing gas” holds the key to the answers. Now, the team led by Dr. Ueda has systematically evidenced that sloshing gas does exist in all of their clusters sample. The result strongly supports that mergers can always affect the evolution of galaxy clusters and their impacts brought to the entire galaxy clusters can last for a long time.

Dr. Ueda says: "We have analyzed 12 clusters and discovered sloshing gas in all of them. This progress may critically help our understanding towards the cool cores in cluster centers."

"The presence of cool cores is one of is one of the long-standing, well-known problems in astrophysics. They are found in the center of most of the galaxy clusters, the reason we call it "cool core" is because the temperature of the ICM in the center is cooler than that in the surroundings" Dr. Ueda continues: “Indeed, it is very difficult to keep the ICM “relatively-cool” for a long time. If gas temperature becomes low, gas pressure also decreases. Eventually, cool cores must be collapsed quickly. But galaxy clusters have no such collapsing cores, which means that they must have some hidden processes to prevent the collapses. Sloshing gas is one of the clues to trace down this problem.

Explaining how to spot sloshing gas, Dr. Ueda says, "Sloshing gas creates gas density perturbations in the center of galaxy clusters which also attributes a specific pattern of temperature profile. Therefore, spotting these differences is a well-known tool for identifying sloshing gas." The team selected 12 clusters out of CLASH, a world-famous pool for high-mass galaxy clusters images, taken by the Hubble Space Telescope. By analyzing their X-ray images taken by the Chandra X-ray Observatory, the team detected gas density perturbations in all of the selected clusters. They also measured the gas temperature difference. The results are in good agreement with what sloshing gas should look like.

In addition, to test how well their algorithm performs in detecting gas density perturbations and in identifying where those regions locate, the team used synthetic X-ray observations made by a hydrodynamic simulation.

Dr. Sandor M. Molnar from ASIAA performed a hydrodynamical simulation of a cluster merger to compare with observations. Dr. Molnar said “Numerical simulations are very powerful tools to understand astrophysics. They can be used to visualize and follow all of physical phenomena that human beings cannot see in their lifetime, namely, for example those, which are happening in colliding galaxy clusters during cosmological time-scale, billions of years. In addition, computer simulations enable us to identify the most important physical mechanisms which can reproduce the observational data and to check for biases in our analysis methods of real data. Thanks to the powerful computing resources at the National Center for High-Performance Computing in Taiwan, we succeeded in calculating physical parameters with very high angular resolution.” 

The team is planning a larger number of numerical simulations that may reproduce many types of galaxy clusters. Dr. Ueda explains: “Expanding the number of our cluster samples can reveal how many galaxy clusters host sloshing gas. This information allows us to estimate a lifetime of sloshing gas, which is a key parameter not only to improve our simulations but also to study the property of the ICM.”

Article author: Dr. Shutaro Ueda

Edited by: Lauren Huang

Reviewed by: Dr. Keiichi Umetsu


Glossary:

Sloshing Gas: Almost all galaxy clusters experience mergers. When a merger takes place, a specific pattern of "spiral" often can be observed in X-ray images. Such a spiral feature is due to the motion of the gas, the so-called "sloshing gas" - induced by a merger. At the beginning of the sloshing gas study, spiral features had been the only recognizable evidence. Later on, in studies like this one, astronomers started using numerical simulations to investigate identifiable evidence of sloshing gas. By now there have been two evidence features that people can look for sloshing gas with.

ICM: the acronym for Intracluster medium, ICM is the superheated plasma that permeates a galaxy cluster. The gas consists mainly of ionized hydrogen and helium and accounts for most of the baryonic material in galaxy clusters. The ICM is heated to temperatures on the order of 10 to 100 mega kelvins, emitting strong X-ray radiation.

CLASH: Acronym for Cluster Lensing And Supernova survey with Hubble, CLASH is one of three first class Hubble multi-cycle treasury programs designed to tackle large questions unanswerable through normal observations. Observations for CLASH were conducted on the Hubble Space Telescope with images taken in 16 filters, selected to maximize the ability to detect distant galaxies behind each cluster.


Notes:

Paper and Research Team

The paper was published as “Gas Density Perturbations in the Cool Cores of CLASH Galaxy Clusters” in Astrophysical Journal, Volume 892, Number 2

The team members are: Shutaro Ueda, Yuto Ichinohe, Sandor M. Molnar, Keiichi Umetsu, and Tetsu Kitayama


Background Information


Thursday, April 09, 2020

Black Hole Bends Light Back on Itself

This illustration shows how some of the light coming from a disk around a black hole is bent back onto the disk itself due to the gravity of the hefty black hole. The light is then reflected back off the disk. Astronomers using data from NASA's now-defunct Rossi X-ray Timing Explorer (RXTE) mission were able to distinguish between light that came straight from the disk and light that was reflected. The bluish material coming off the black hole is an outflowing jet of energetic particles. Credit: NASA/JPL-Caltech/R. Hurt (IPAC)/R. Connors (Caltech)

New study proves a theory first predicted more than 40 years ago

You may have heard that nothing escapes the gravitational grasp of a black hole, not even light. This is true in the immediate vicinity of a black hole, but a bit farther out—in disks of material that swirl around some black holes—light can escape. In fact, this is the reason actively growing black holes shine with brilliant X-rays.

Now, a new study accepted for publication in The Astrophysical Journal offers evidence that, in fact, not all of the light streaming from a black hole's surrounding disk easily escapes. Some of it gives in to the monstrous pull of the black hole, turns back, and then ultimately bounces off the disk and escapes.

"We observed light coming from very close to the black hole that is trying to escape, but instead is pulled right back by the black hole like a boomerang," says Riley Connors, lead author of the new study and a postdoctoral scholar at Caltech. "This is something that was predicted in the 1970s, but hadn't been shown until now."

The new findings were made possible by combing through archival observations from NASA's now-defunct Rossi X-ray Timing Explorer (RXTE) mission, which came to an end in 2012. The researchers specifically looked at a black hole that is orbited by a sun-like star; together, the pair is called XTE J1550-564. The black hole "feeds" off this star, pulling material onto a flat structure around it called an accretion disk. By looking closely at the X-ray light coming from the disk as the light spirals toward the black hole, the team found imprints indicating that the light had been bent back toward the disk and reflected off.

"The disk is essentially illuminating itself," says co-author Javier Garcia, a research assistant professor of physics at Caltech. "Theorists had predicted what fraction of the light would bend back on the disk, and now, for the first time, we have confirmed those predictions."

The scientists say that the new results offer another indirect confirmation of Albert Einstein's general theory of relativity, and also will help in future measurements of the spin rates of black holes, something that is still poorly understood.

"Since black holes can potentially spin very fast, they not only bend the light but twist it," says Connors. "These recent observations are another piece in the puzzle of trying to figure out how fast black holes spin."

The new study, titled, "Evidence for Returning Disk Radiation in the Black Hole X-ray Binary XTEJ1550-564," was funded by NASA, the Alexander von Humboldt Foundation, and the Margarete von Wrangell Fellowship. Other co-authors are Thomas Dauser, Stefan Licklederer, and Jörn Wilms of The University of Erlangen-Nüremberg in Germany; Victoria Grinberg of the Universität Tübingen in Germany; James Steiner of the MIT Kavli Institute for Astrophysics and Space Research and Harvard University; Navin Sridhar of Columbia University; John Tomsick of UC Berkeley; and Fiona Harrison, the Harold A. Rosen Professor of Physics at Caltech and the Kent and Joyce Kresa Leadership Chair of the Division of Physics, Mathematics and Astronomy.

Written by Whitney Clavin

Contact

Whitney Clavin
(626) 395‑1944
wclavin@caltech.edu


Wednesday, April 08, 2020

Universe's Expansion May Not Be The Same In All Directions

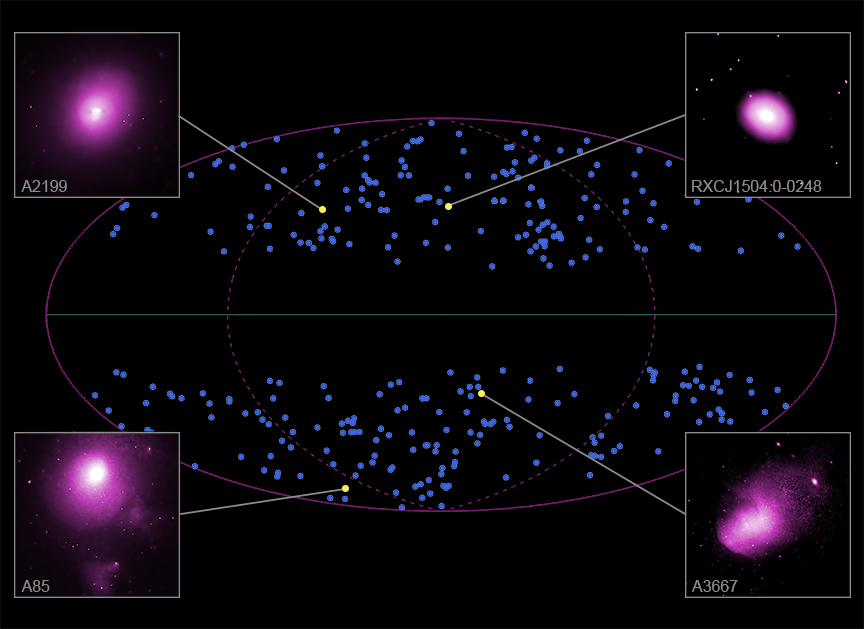
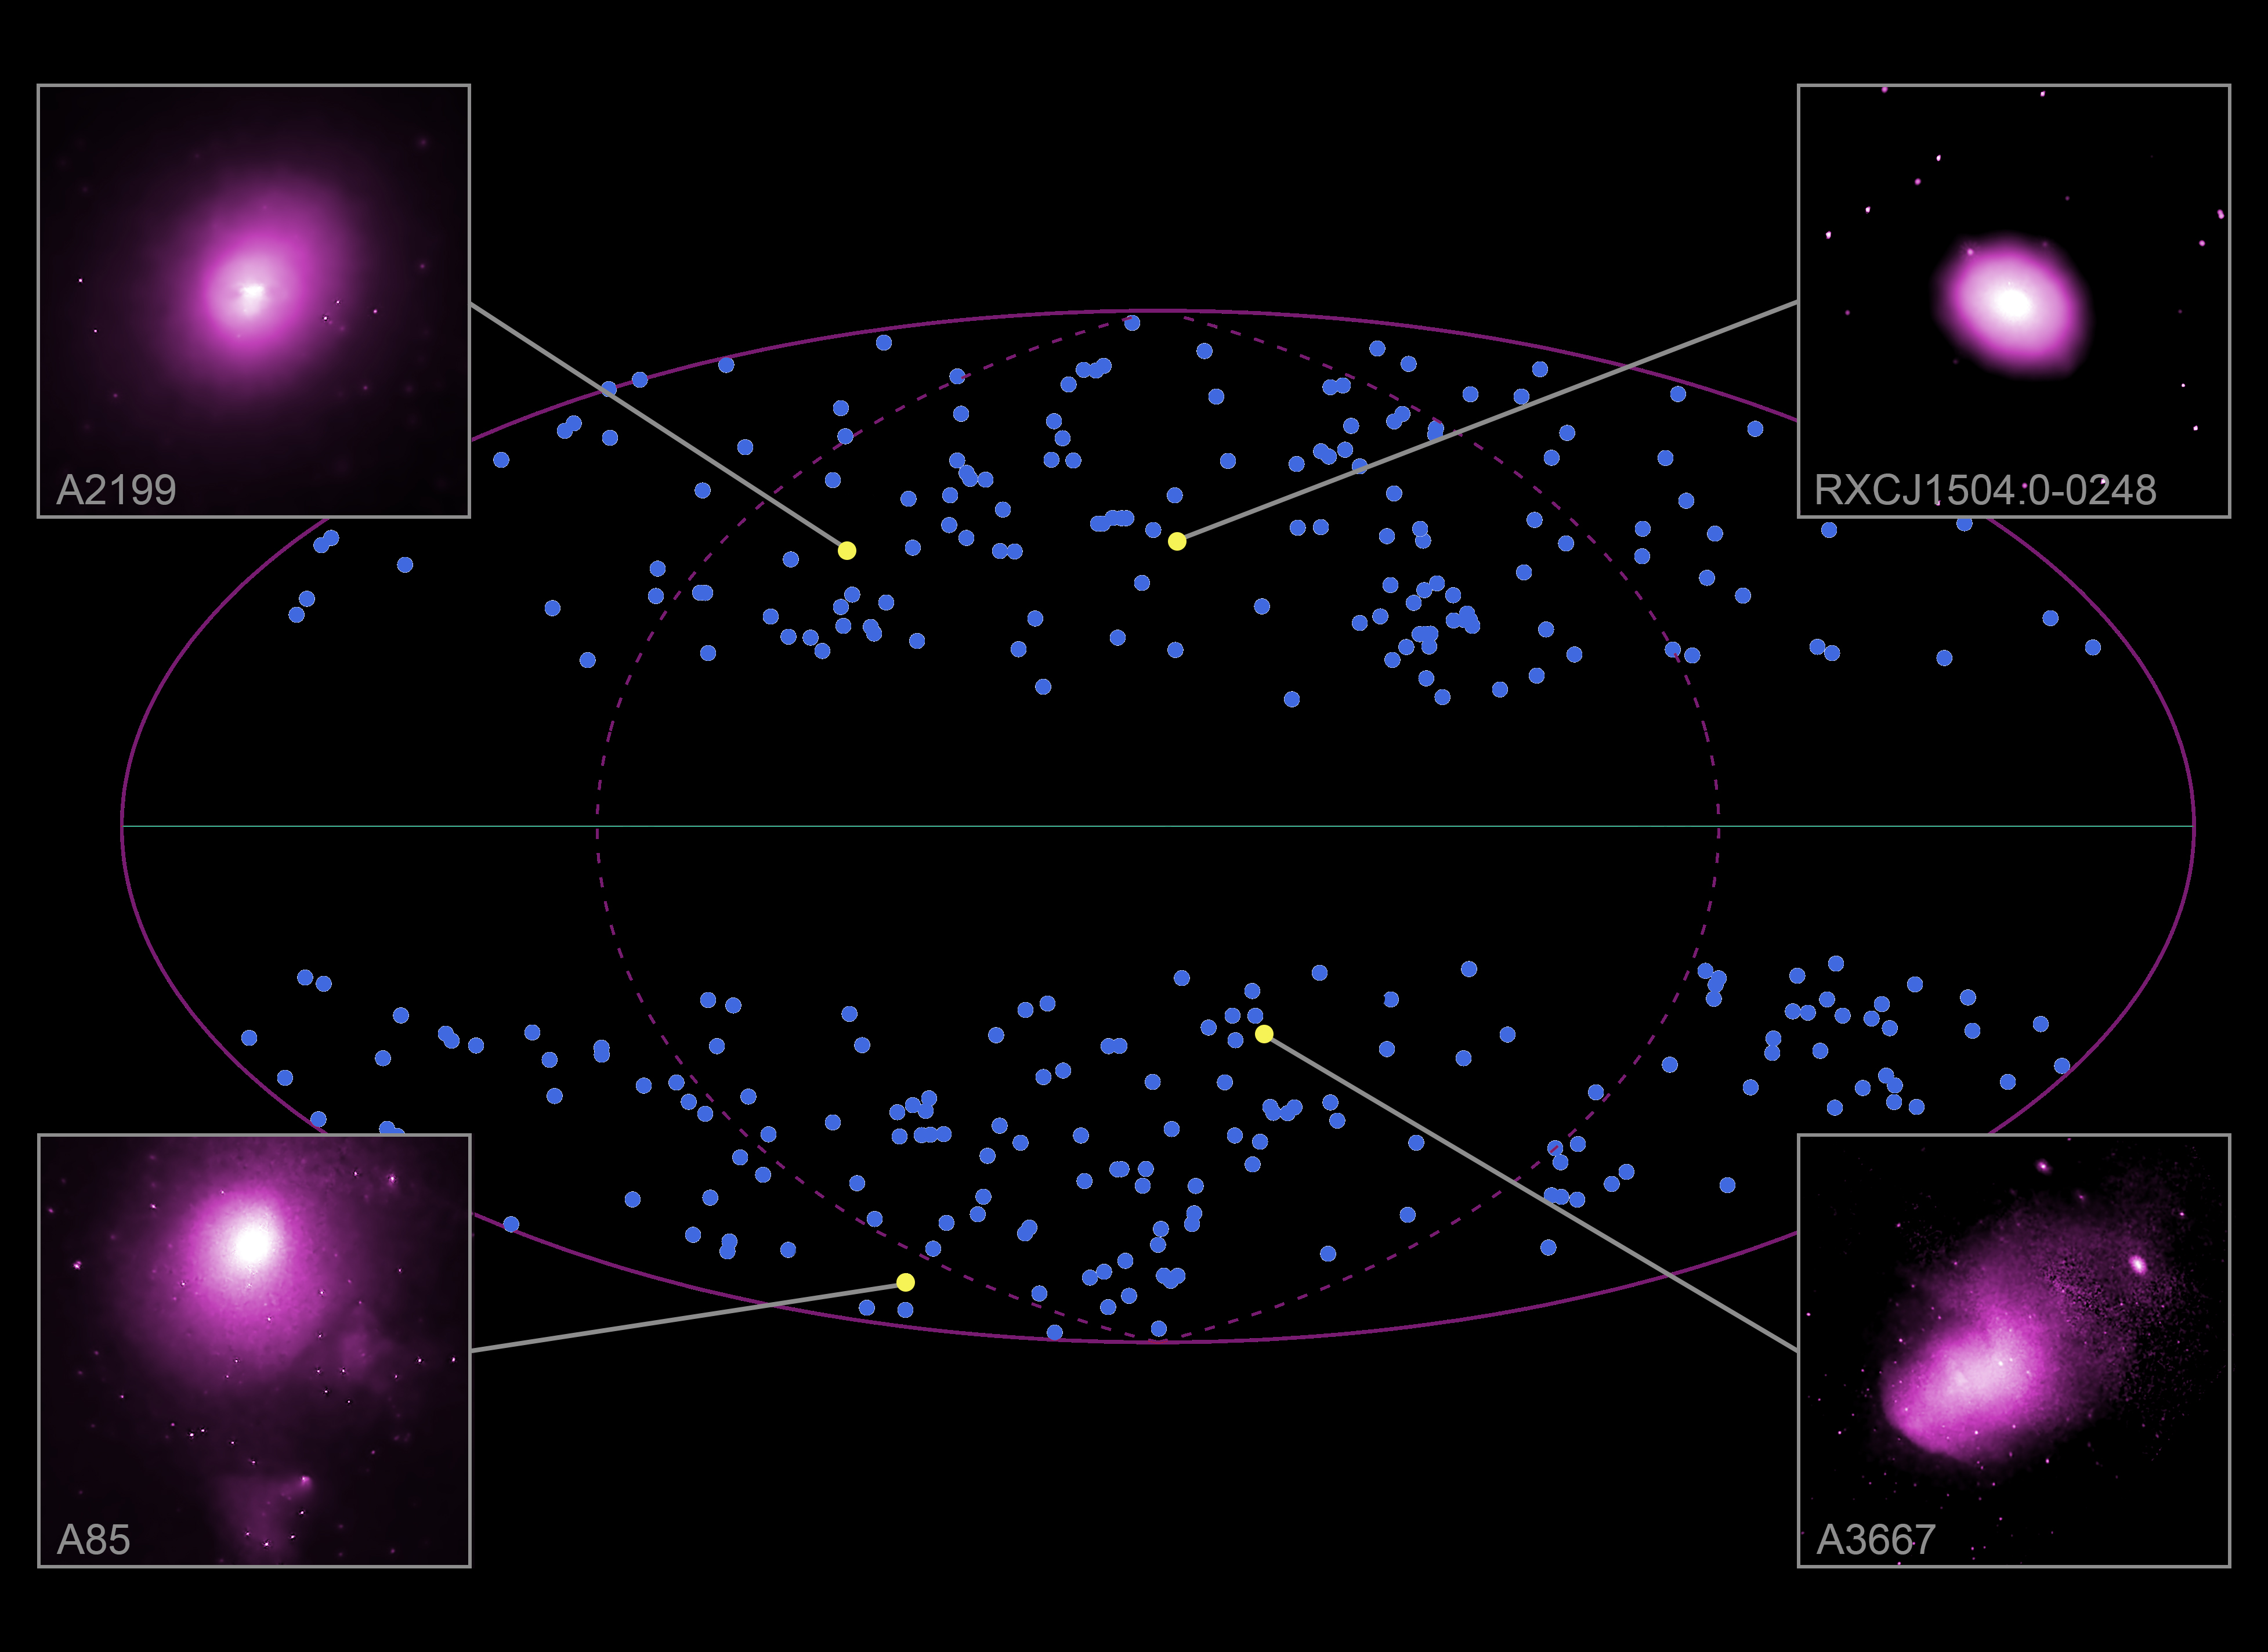
Abell 2199, RXCJ1504.1-0248, Abell 85, Abell 3667
Credit: NASA/CXC/Univ. of Bonn/K. Migkas et al.


This graphic contains a map of the full sky and shows four of the hundreds of galaxy clusters that were analyzed to test whether the Universe is the same in all directions over large scales, as described in our latest press release. Galaxy clusters are the largest objects in the Universe bound by gravity and astronomers can use them to measure important cosmological properties. This latest study uses data from NASA's Chandra X-ray Observatory and ESA's XMM-Newton to investigate whether or not the Universe is "isotropic."

The sky map in this schematic is in "galactic coordinates," with the plane of the Milky Way running along the middle (instead of the equator like is used for Earth). Galactic longitude runs in the horizontal, or "x" direction, and galactic latitude runs in the vertical, or "y" direction. The dark points show the location in the sky map of the 313 galaxy clusters observed with Chandra and XMM-Newton and included in this study. The four Chandra images of galaxy clusters from the new study are, in a clockwise direction from the top left, Abell 2199, RXCJ1504.1-0248, Abell 3667 and Abell 85. Galaxy clusters with galactic latitudes less than 20 degrees were not included in the survey to avoid obscuration from the Galaxy itself, which has most of its stars, gas and dust along a thin plane. Similarly, galaxy clusters behind two nearby galaxies, the Small Magellanic Cloud and the Large Magellanic Cloud, and behind the Virgo galaxy cluster were not included to avoid obscuration.

A2199, RXCJ1504.1-0248, A85, A3667
Credit: NASA/CXC/Univ. of Bonn/K. Migkas et al.

Astronomers generally agree that after the Big Bang, the cosmos has continuously expanded like a baking loaf of raisin bread. As the bread bakes, the raisins (which represent cosmic objects like galaxies and galaxy clusters) all move away from one another as the entire loaf (representing space) expands. With an even mix the expansion should be uniform in all directions, as it should be with an isotropic Universe.

This latest test uses a powerful, novel and independent technique and suggests the concept of an isotropic Universe may not entirely fit. The study capitalizes on the relationship between the temperature of the hot gas pervading a galaxy cluster and the amount of X-rays it produces, known as the cluster's X-ray luminosity. The higher the temperature of the gas in a cluster, the higher the X-ray luminosity is. Once the temperature of the cluster gas is measured, the X-ray luminosity can be estimated. This method is independent of cosmological quantities, including the expansion speed of the Universe.

Once they estimated the X-ray luminosities of their clusters using this technique, scientists then calculated luminosities using a different method that does depend on cosmological quantities, including the Universe's expansion speed. The results gave the researchers apparent expansion speeds across the whole sky — revealing that the Universe appears to be moving away from us faster in some directions than others.

The authors of this new study came up with two possible explanations for their results that involve cosmology. One of these explanations is that large groups of galaxy clusters might be moving together, but not because of cosmic expansion. For example, it is possible some nearby clusters are being pulled in the same direction by the gravity of groups of other galaxy clusters. If the motion is rapid enough it could lead to errors in estimating the luminosities of the clusters.

A second possible explanation is that the Universe is not actually the same in all directions. One intriguing reason could be that dark energy — the mysterious force that seems to be driving acceleration of the expansion of the Universe — is itself not uniform. In other words, the X-rays may reveal that dark energy is stronger in some parts of the Universe than others, causing different expansion rates.

Either of these two cosmological explanations would have significant consequences. The astronomical community must perform other scrutinized tests obtaining consistent results every time to truly know if the concept of an isotropic Universe should be reconsidered.

A paper describing these results will appear in the April 2020 issue of the journal Astronomy and Astrophysics and is available online. The authors are Konstantinos Migkas (University of Bonn, Germany), Gerrit Schellenberger (Center for Astrophysics | Harvard & Smithsonian), Thomas Reiprich, Florian Pacaud and Miriam Elizabeth Ramos-Ceja (University of Bonn), and Lorenzo Lovisari (CfA).

NASA's Marshall Space Flight Center in Huntsville, Alabama, manages the Chandra program for NASA's Science Mission Directorate in Washington. The Smithsonian Astrophysical Observatory in Cambridge, Massachusetts, controls Chandra's science and flight operations.


Fast Facts for Abell 85:

Scale: Image is about 15 arcminutes (3 million light years) across.
Category: Cosmology/Deep Fields/X-ray Background, Groups & Clusters of Galaxies
Coordinates (J2000): RA 00h 42m 50.7s | Dec -09° 38´ 45"
Constellation: Cetus
Observation Date: 12 pointings between September 2004 through August 2013
Observation Time: 65 hours (2 days 17 hours)
Obs. ID: 4881-4888, 15173, 16264, 15174, 16263
Instrument: ACIS
References: Migkas, K. et al., 2020, A&A; arXiv:2004.03305
Color Code: X-ray: Magenta
Distance Estimate: About 760 million light years (z=0.056)