Thursday, February 07, 2013

The Last Big Bump Before a Supernova Explodes

The day the supernova exploded (a) it was surrounded by a shell of matter ejected a month earlier (purple) with a radius of 7,000,000,000 kilometers, moving 2,000 kilometers a second. An outer shell (orange) had been ejected earlier and was moving slower. By day 5 (b) the shock front (black circle) was moving 10,000 kilometers a second, and by day 20 (c) had engulfed the inner shell, exposing the debris of the exploded core. (Sketch adapted from Ofek et al, Palomar Transient Factory). Large Image

The Palomar Transient Factory (PTF) brings together universities, observatories, and one national laboratory to hunt for supernovae and other astronomical objects. At the National Energy Research Scientific Computing Center (NERSC) Berkeley Lab processes and stores the data from PTF’s surveys, which use the Oschin Telescope at Caltech’s Palomar Observatory.

On August 25, 2010, PTF’s “autonomous machine-learning framework,” developed by Josh Bloom of Berkeley Lab’s Physics Division and Peter Nugent of the Computational Research Division (both are also with UC Berkeley’s Department of Astronomy) and their colleagues, was combing through recent data and came upon a Type IIn supernova, half a billion light years away in the constellation Hercules. The supernova was eventually labeled SN 2010mc.

Type II’s are “core collapse” supernovae, which start as precursor stars somewhere between 8 and 100 times the mass of Earth’s sun, burning much of their hydrogen down to helium, carbon, and other elements and eventually to an iron cinder. When this core reaches 1.4 solar masses, it collapses under its own weight to create a neutron star or even a black hole, releasing a tremendous amount of energy as neutrinos, magnetic fields, and shock waves – and destroying the star.

Astronomers have long suspected the story isn’t that simple, that the explosion of a Type II supernova is only the last in a series of smaller blasts that successively blow off much of the core’s enveloping matter.

Indeed, the “n” in Type IIn means that instead of the usual broad hydrogen-emission line that marks a Type II, the identifying line is narrow – probably because light from the explosion has passed through a thin sphere of hydrogen that already surrounded the star before it went supernova.

Despite many such suggestive clues, no causal proof had previously linked precursor “bumps” to an actual supernova. But soon after PTF’s Type IIn was found, Eran Ofek of Israel’s Weizmann Institute of Science led a search of previous PTF scans of the stellar neighborhood and found its likely precursor, a massive variable star that only 40 days before it went supernova had shed a huge amount of mass.

The PTF team developed a scenario and tested it against competing theoretical ideas, using evidence from several sky surveys that had also observed SN 2010mc’s precursor. They concluded that the “penultimate outburst” had blown off a hundredth of a solar mass in a shell expanding 2,000 kilometers per second, already 7 billion kilometers away from the supernova when it exploded. Earlier ejecta was detected 10 billion kilometers away, having slowed to a hundred kilometers per second.

After the supernova explosion, high-velocity ejecta passing through shells of earlier debris left a record of varying brightness and spectral features. The observations pointed to the most-likely theoretical model of what happened: turbulence-excited gravity waves drove successive episodes of mass loss, finally culminating in the collapse and explosion of the core.

The report of these results will appear in the February 7, 2013 issue of Nature at  http://www.nature.com/nature/index.html.  For more information on the next-to-last blast from this massive star, see the NERSC press release at http://www.nersc.gov/news-publications/news/science-news/2013/a-massive-stellar-burst-before-the-supernova/.

Paul Preuss 510-486-6249 
Email:  paul_preuss@lbl.gov 


Earth-like Planets Are Right Next Door

This artist’s conception shows a hypothetical habitable planet with two moons orbiting a red dwarf star. Astronomers have found that 6 percent of all red dwarf stars have an Earth-sized planet in the habitable zone, which is warm enough for liquid water on the planet’s surface. Since red dwarf stars are so common, then statistically the closest Earth-like planet should be only 13 light-years away. Credit: David A. Aguilar (CfA).  High Resolution Image (jpg) - Low Resolution Image (jpg) - Animation (mov)
 
When it's young, a red dwarf star frequently erupts with strong ultraviolet flares as shown in this artist's conception. Some have argued that life would be impossible on any planet orbiting in the star's habitable zone as a result. However, the planet's atmosphere could protect the surface, and in fact such stresses could help life to evolve. And when the star ages and settles down, its planet would enjoy billions of years of quiet, steady radiance. Credit: David A. Aguilar (CfA).  High Resolution Image (jpg) - Low Resolution Image (jpg) -  Animation (mov)
 
By analyzing publicly available Kepler data, CfA astronomers identified 95 planetary candidates circling red dwarf stars. Of those, three orbit within the habitable zone (marked in green) - the distance at which they should be warm enough to host liquid water on the surface. Those three planetary candidates (marked with blue dots) are 0.9, 1.4, and 1.7 times the size of Earth. In this graph, light received by the planet increases from left to right, and therefore distance to the star decreases from left to right. Planet size increases from bottom to top. Credit: C. Dressing (CfA). High Resolution Image (jpg) - Low Resolution Image (jpg)
Cambridge, MA - Using publicly available data from NASA's Kepler space telescope, astronomers at the Harvard-Smithsonian Center for Astrophysics (CfA) have found that six percent of red dwarf stars have habitable, Earth-sized planets. Since red dwarfs are the most common stars in our galaxy, the closest Earth-like planet could be just 13 light-years away. 
  "We thought we would have to search vast distances to find an Earth-like planet. Now we realize another Earth is probably in our own backyard, waiting to be spotted," said Harvard astronomer and lead author Courtney Dressing (CfA).

Dressing presented her findings today in a press conference at the Harvard-Smithsonian Center for Astrophysics in Cambridge, Mass.

Red dwarf stars are smaller, cooler, and fainter than our Sun. An average red dwarf is only one-third as large and one-thousandth as bright as the Sun. From Earth, no red dwarf is visible to the naked eye.

Despite their dimness, these stars are good places to look for Earth-like planets. Red dwarfs make up three out of every four stars in our galaxy for a total of at least 75 billion. The signal of a transiting planet is larger since the star itself is smaller, so an Earth-sized world blocks more of the star's disk. And since a planet has to orbit a cool star closer in order to be in the habitable zone, it's more likely to transit from our point of view.

Dressing culled the Kepler catalog of 158,000 target stars to identify all the red dwarfs. She then reanalyzed those stars to calculate more accurate sizes and temperatures. She found that almost all of those stars were smaller and cooler than previously thought.

Since the size of a transiting planet is determined relative to the star size, based on how much of the star's disk the planet covers, shrinking the star shrinks the planet. And a cooler star will have a tighter habitable zone.

Dressing identified 95 planetary candidates orbiting red dwarf stars. This implied that at least 60 percent of such stars have planets smaller than Neptune. However, most weren't quite the right size or temperature to be considered truly Earth-like. Three planetary candidates were both warm and approximately Earth-sized. Statistically, this means that six percent of all red dwarf stars should have an Earth-like planet.

"We now know the rate of occurrence of habitable planets around the most common stars in our galaxy," said co-author David Charbonneau (CfA). "That rate implies that it will be significantly easier to search for life beyond the solar system than we previously thought."

Our Sun is surrounded by a swarm of red dwarf stars. About 75 percent of the closest stars are red dwarfs. Since 6 percent of those should host habitable planets, the closest Earth-like world is likely to be just 13 light-years away.

Locating nearby, Earth-like worlds may require a dedicated small space telescope, or a large network of ground-based telescopes. Follow-up studies with instruments like the Giant Magellan Telescope and James Webb Space Telescope could tell us whether any warm, transiting planets have an atmosphere and further probe its chemistry.

Such a world would be different from our own. Orbiting so close to its star, the planet would probably be tidally locked. However, that doesn't prohibit life since a reasonably thick atmosphere or deep ocean could transport heat around the planet. And while young red dwarf stars emit strong flares of ultraviolet light, an atmosphere could protect life on the planet's surface. In fact, such stresses could help life to evolve.

"You don't need an Earth clone to have life," said Dressing.

Since red dwarf stars live much longer than Sun-like stars, this discovery raises the interesting possibility that life on such a planet would be much older and more evolved than life on Earth.

"We might find an Earth that's 10 billion years old," speculated Charbonneau.

The three habitable-zone planetary candidates identified in this study are Kepler Object of Interest (KOI) 1422.02, which is 90 percent the size of Earth in a 20-day orbit; KOI 2626.01, 1.4 times the size of Earth in a 38-day orbit; and KOI 854.01, 1.7 times the size of Earth in a 56-day orbit. All three are located about 300 to 600 light-years away and orbit stars with temperatures between 5,700 and 5,900 degrees Fahrenheit. (For comparison, our Sun's surface is 10,000 degrees F.)

These results will be published in The Astrophysical Journal.

Headquartered in Cambridge, Mass., the Harvard-Smithsonian Center for Astrophysics (CfA) is a joint collaboration between the Smithsonian Astrophysical Observatory and the Harvard College Observatory. CfA scientists, organized into six research divisions, study the origin, evolution and ultimate fate of the universe.

For more information, contact:

David A. Aguilar
Director of Public Affairs
Harvard-Smithsonian Center for Astrophysics
617-495-7462

daguilar@cfa.harvard.edu

 
Christine Pulliam
Public Affairs Specialist
Harvard-Smithsonian Center for Astrophysics
617-495-7463

cpulliam@cfa.harvard.edu

Wednesday, February 06, 2013

The Wings of the Seagull Nebula

 
The glowing cloud Sharpless 2-296, part of the Seagull Nebula 

 PR Image eso1306b
The Seagull Nebula on the borders of the constellations of Monoceros and Canis Major 

 PR Image eso1306c
Wide-field view of the entire Seagull Nebula (IC 2177)

Videos

Zooming in on the wings of the Seagull Nebula
 Zooming in on the wings of the Seagull Nebula

Panning across part of the Seagull Nebula

This new image from ESO shows a section of a cloud of dust and glowing gas called the Seagull Nebula. These wispy red clouds form part of the “wings” of the celestial bird and this picture reveals an intriguing mix of dark and glowing red clouds, weaving between bright stars. This new view was captured by the Wide Field Imager on the MPG/ESO 2.2-metre telescope at ESO’s La Silla Observatory in Chile.

Running along the border between the constellations of Canis Major (The Great Dog) and Monoceros (The Unicorn) in the southern sky, the Seagull Nebula is a huge cloud mostly made of hydrogen gas. It’s an example of what astronomers refer to as an HII region. Hot new stars form within these clouds and their intense ultraviolet radiation causes the surrounding gas to glow brightly.

The reddish hue in this image is a telltale sign of the presence of ionised hydrogen [1]. The Seagull Nebula, known more formally as IC 2177, is a complex object with a bird-like shape that is made up of three large clouds of gas — Sharpless 2-292 (eso1237) forms the “head”, this new image shows part of Sharpless 2-296, which comprises the large “wings”, and Sharpless 2-297 is a small, knotty addition to the tip of the gull’s right “wing” [2].

These objects are all entries in the Sharpless nebula catalogue, a list of over 300 glowing clouds of gas compiled by American astronomer Stewart Sharpless in the 1950s. Before he published this catalogue Sharpless was a graduate student at the Yerkes Observatory near Chicago, USA, where he and his colleagues published observational work that helped to show that the Milky Way is a spiral galaxy with vast, curved arms.

Spiral galaxies can contain thousands of HII regions, almost all of which are concentrated along their spiral arms. The Seagull Nebula lies in one of the spiral arms of the Milky Way. But this is not the case for all galaxies; while irregular galaxies do contain HII regions, these are jumbled up throughout the galaxy, and elliptical galaxies are different yet again — appearing to lack these regions altogether. The presence of HII regions indicates that active star formation is still in progress in a galaxy.

This image of Sharpless 2-296 was captured by the Wide Field Imager (WFI), a large camera mounted on the MPG/ESO 2.2-metre telescope at ESO’s La Silla Observatory in Chile. It shows only a small section of the nebula, a large cloud that is furiously forming hot stars in its interior. The frame shows Sharpless 2-296 lit up by several particularly bright young stars — there are many other stars scattered across the region, including one so bright that stands out as the gull’s “eye” in pictures of the entire complex.

Wide-field images of this region of the sky show a multitude of interesting astronomical objects. The young bright stars within the nebula are part of the nearby star-forming region of CMa R1 in the constellation of Canis Major, which is filled with bright stars and clusters. Also lying close to the Seagull Nebula is the Thor’s Helmet Nebula, an object that was imaged using ESO’s Very Large Telescope (VLT) on ESO’s 50th Anniversary, 5 October 2012, with the help of Brigitte Bailleul — winner of the Tweet Your Way to the VLT! competition (eso1238a).

Notes

[1] Astronomers use the term HII to mean ionised hydrogen and HI for atomic hydrogen. A hydrogen atom consists of an electron bound to a proton but in an ionised gas atoms are split into freely moving electrons and positive ions, in this case just single protons.

[2] These objects are officially designated Sh 2-292, Sh 2-296, and Sh 2-297 respectively in the SIMBAD astronomical database.

More information

ESO is the foremost intergovernmental astronomy organisation in Europe and the world’s most productive ground-based astronomical observatory by far. It is supported by 15 countries: Austria, Belgium, Brazil, the Czech Republic, Denmark, France, Finland, Germany, Italy, the Netherlands, Portugal, Spain, Sweden, Switzerland and the United Kingdom. ESO carries out an ambitious programme focused on the design, construction and operation of powerful ground-based observing facilities enabling astronomers to make important scientific discoveries. ESO also plays a leading role in promoting and organising cooperation in astronomical research. ESO operates three unique world-class observing sites in Chile: La Silla, Paranal and Chajnantor. At Paranal, ESO operates the Very Large Telescope, the world’s most advanced visible-light astronomical observatory and two survey telescopes. VISTA works in the infrared and is the world’s largest survey telescope and the VLT Survey Telescope is the largest telescope designed to exclusively survey the skies in visible light. ESO is the European partner of a revolutionary astronomical telescope ALMA, the largest astronomical project in existence. ESO is currently planning the 39-metre European Extremely Large optical/near-infrared Telescope, the E-ELT, which will become “the world’s biggest eye on the sky”.

Links

Contacts

Richard Hook
ESO, La Silla, Paranal, E-ELT & Survey Telescopes Press Officer
Garching bei München, Germany
Tel: +49 89 3200 6655
Cell: +49 151 1537 3591
Email:
rhook@eso.org

WISE Feels the Heat from Orion's Sword

The Orion nebula is featured in this sweeping image from NASA's Wide-field Infrared Survey Explorer, or WISE. The constellation of Orion is prominent in the evening sky throughout the world from about December through April of each year. The nebula (also catalogued as Messier 42) is located in the sword of Orion, hanging from his famous belt of three stars. The star cluster embedded in the nebula is visible to the unaided human eye as a single star, with some fuzziness apparent to the most keen-eyed observers. Image Credit: NASA/JPL-Caltech/UCLA.  › Full image and caption

The tangle of clouds and stars that lie in Orion's sword is showcased in a new, expansive view from NASA's Wide-field Infrared Survey Explorer, or WISE.

Orion, the famous hunter, is visible in evening skies throughout the world from about December through April. The constellation appears tranquil and still to the naked eye, but lying in its sword, at what appears to be a slightly fuzzy star, is a turbulent cauldron of stellar birth.

WISE scanned the whole sky in infrared light, capturing this vast view of the dynamic region, called the Orion nebula. The telescope picked up the infrared glow from dust heated by newborn stars. The colors green and red highlight this warmed dust, while the white regions are the hottest. Massive stars burned through the dust, carving out cavities, the largest of which is seen at the center of the picture.

Astronomers think that our sun was probably born in a similar cloud some five billion years ago. Over time, the cloud would have dispersed and the stars would have drifted apart, leaving us more isolated in space. The crowded newborn stars in the Orion nebula are less than 10 million years old -- billions of years from now, they will likely spread out.

NASA's Jet Propulsion Laboratory, Pasadena, Calif., manages, and operated, WISE for NASA's Science Mission Directorate. The spacecraft was put into hibernation mode in 2011, after it scanned the entire sky twice, completing its main objectives. Edward Wright is the principal investigator and is at UCLA. The mission was selected competitively under NASA's Explorers Program managed by the agency's Goddard Space Flight Center in Greenbelt, Md. The science instrument was built by the Space Dynamics Laboratory in Logan, Utah. The spacecraft was built by Ball Aerospace & Technologies Corp. in Boulder, Colo. Science operations and data processing take place at the Infrared Processing and Analysis Center at the California Institute of Technology in Pasadena. Caltech manages JPL for NASA.


Whitney Clavin 818-354-4673
Jet Propulsion Laboratory, Pasadena, Calif.

whitney.clavin@jpl.nasa.gov

Tuesday, February 05, 2013

A spiral galaxy with a secret

Hubble view of M 106


VIDEOS

Hubblecast 62: A spiral galaxy with a secret

The anomalous arms of M 106

Zoom on M 106
Zoom on M 106

The NASA/ESA Hubble Space Telescope – with a little help from an amateur astronomer – has produced one of the best views yet of nearby spiral galaxy Messier 106. Located a little over 20 million light-years away, practically a neighbour by cosmic standards, Messier 106 is one of the brightest and nearest spiral galaxies to our own.

Despite its appearance, which looks much like countless other galaxies, Messier 106 hides a number of secrets. Thanks to this image, which combines data from Hubble with observations by amateur astronomers Robert Gendler and Jay GaBany, they are revealed as never before.

At its heart, as in most spiral galaxies, is a supermassive black hole, but this one is particularly active. Unlike the black hole at the centre of the Milky Way, which pulls in wisps of gas only occasionally, Messier 106’s black hole is actively gobbling up material. As the gas spirals towards the black hole, it heats up and emits powerful radiation. Part of the emission from the centre of Messier 106 is produced by a process that is somewhat similar to that in a laser - although here the process produces bright microwave radiation [1].

As well as this microwave emission from Messier 106’s heart, the galaxy has another startling feature - instead of two spiral arms, it appears to have four. Although the second pair of arms can be seen in visible light images as ghostly wisps of gas, as in this image, they are even more prominent in observations made outside of the visible spectrum, such as those using X-ray or radio waves.

Unlike the normal arms, these two extra arms are made up of hot gas rather than stars, and their origin remained unexplained until recently. Astronomers think that these, like the microwave emission from the galactic centre, are caused by the black hole at Messier 106’s heart, and so are a totally different phenomenon from the galaxy’s normal, star-filled arms.

The extra arms appear to be an indirect result of jets of material produced by the violent churning of matter around the black hole. As these jets travel through the galactic matter they disrupt and heat up the surrounding gas, which in turn excites the denser gas in the galactic plane and causes it to glow brightly. This denser gas closer to the centre of the galaxy is tightly-bound, and so the arms appear to be straight. 

However, the looser disc gas further out is blown above or below the disc in the opposite direction from the jet, so that the gas curves out of the disc — producing the arching red arms seen here.

Despite carrying his name, Messier 106 was neither discovered nor catalogued by the renowned 18th century astronomer Charles Messier. Discovered by his assistant, Pierre Méchain, the galaxy was never added to the catalogue in his lifetime. Along with six other objects discovered but not logged by the pair, Messier 106 was posthumously added to the Messier catalogue in the 20th century.

Amateur astronomer Robert Gendler retrieved archival Hubble images of M 106 to assemble a mosaic of the centre of the galaxy. He then used his own and fellow astrophotographer Jay GaBany’s observations of M 106 to combine with the Hubble data in areas where there was less coverage, and finally, to fill in the holes and gaps where no Hubble data existed.

The centre of the galaxy is composed almost entirely of Hubble data taken by the Advanced Camera for Surveys, Wide Field Camera 3, and Wide Field and Planetary Camera 2 detectors. The outer spiral arms are predominantly HST data colourised with ground-based data taken by Gendler’s and GaBany’s 12.5-inch and 20-inch telescopes, located at very dark remote sites in New Mexico, USA.

Gendler was a prizewinner in the recent Hubble’s Hidden Treasures image processing competition. Another prizewinner, André van der Hoeven, entered a different version of Messier 106, combining Hubble and NOAO data.

Notes

The Hubble Space Telescope is a project of international cooperation between ESA and NASA.

[1] Lasers work when light stimulates emission of more light from a cloud of excited gas, with the original light in effect being amplified (the word laser is an acronym for light amplification by the stimulated emission of radiation). The centre of M106 harbours a similar phenomenon called a maser (short for microwave amplification by the stimulated emission of radiation), in which microwave radiation, which is at longer wavelengths than visible light, is emitted. Note that unlike man-made lasers, which are designed to produce a narrow beam, astronomical masers shine in all directions.

Credit: NASA, ESA, the Hubble Heritage Team (STScI/AURA), and R. Gendler (for the Hubble Heritage Team). Acknowledgment: J. GaBany, A van der Hoeven

Links

Contacts

Oli Usher
Hubble/ESA
Garching bei München, Germany
Tel: +49-89-3200-6855
Email:
ousher@eso.org

Massive stellar winds are made of tiny pieces

 New view of stellar winds
Artist’s impression comparing a smooth stellar wind (left) with a highly fragmented stellar wind (right) of a massive star like zeta Puppis. A decade’s-worth of observations with ESA’s XMM-Newton have revealed that the wind of zeta Puppis is fragmented into hundreds of thousands of individual hot (red) and cool (blue) clumps. Studying stellar winds is vital not only to understand mass loss from the star itself and thus its expected lifetime, but also how the winds inject material and energy into the surrounding environment and influence the birth and death of other stars. Copyright: ESA–C. Carreau/Nazé et al.  Hi-res image (4.71mb)

ESA’s XMM-Newton space observatory has completed the most detailed study ever of the fierce wind from a giant star, showing for the first time that it is not a uniform breeze but is fragmented into hundreds of thousands of pieces.

 Massive stars are relatively rare, but play a very important role in recycling materials in the Universe. They burn their nuclear fuel much more rapidly than stars like the Sun, living only for millions of years before exploding as a supernova and returning most of their matter to space.

 But even during their brief lives, they lose a significant fraction of their mass through fierce winds of gas driven off their surfaces by the intense light emitted from the star.

 The winds from massive stars are at least a hundred million times stronger than the solar wind emitted by our own Sun and can significantly shape their surrounding environment.

 They might trigger the collapse of surrounding clouds of gas and dust to form new stars or, conversely, blast the clouds away before they have the chance to get started.

 Despite their important role, however, the detailed structure of the winds from massive stars remains poorly understood. Are they steady and uniform, or broken up and gusty?

 Astronomers have now gained a detailed glimpse into this wind structure by taking observations with XMM-Newton spread over a decade to study variability in the X-ray emission from zeta Puppis. One of the nearest massive stars to Earth, it is bright enough to be seen with the naked eye in the constellation of Puppis, in the southern hemisphere.

 The X-rays arise from collisions between slow- and fast-moving clumps in the wind, which heats them to a few million degrees. As individual colliding clumps in the wind are heated and cooled, the strength and energy of the emitted X-rays vary.

 If only a small number of large fragments are present, variations in the combined emission could be large. Conversely, as the number of fragments grows, a change in the X-ray emission from any given fragment becomes less important, and the overall variability decreases.

 In zeta Puppis, the X-ray emission was found to be remarkably stable over short timescales of just a few hours, pointing to a very large number of fragments. There must still be clumps in the wind to make X-rays in the first place, but there must be many of them to yield such low variability.

 However, unexpected variation in the emission was seen on the order of several days, implying the presence of a few very large structures in the wind, possibly spiral-arm-like features superimposed on the highly fragmented wind co-rotating with the star.

 “Studies at other wavelengths had already hinted that the winds from massive stars are not simply a uniform breeze, and the new XMM-Newton data confirm this, but also reveal hundreds of thousands of individual hot and cool pieces,” says Yaël Nazé, Université de Liège, Belgium, who led the study’s analysis.

 “This is the first time constraints have been placed on the number of fragments in a stellar wind of an adult massive star, a number which far exceeds theoretical predictions.”

 To fully understand these observations, improved models of stellar winds will be needed, taking into account both the large-scale emission structures and the highly fragmented wind, in order to understand how they affect mass-loss in stellar giants. 

 “Zeta Puppis also goes by the name Naos, which in antiquity was the name given to the innermost sanctuary of a temple, accessible to only a few people; thanks to XMM-Newton, scientists have been able to unlock the secrets of this mysterious stellar object,” adds Dr Nazé.

 “This long-term XMM-Newton study of zeta Puppis has provided the first constraints on the number of fragments in a stellar wind from a massive star – there is no dataset with comparable sensitivity or time and or spectral coverage currently available for any other massive star,” says Norbert Schartel, ESA’s XMM-Newton project scientist.


Notes to Editors:
 
The study is based on a series of three papers:

 “A detailed X-ray investigation of zeta Pup I. The dataset and some preliminary results,” by Y. Nazé et al is published in Astronomy & Astrophysics 538, A22, 2012; arXiv:1112.0862 

 “A detailed X-ray investigation of zeta Pup II: The variability on short and long timescales”, by Y. Nazé et al is published in the Astrophysical Journal 763, 143, 2013; arXiv:1212.1554 

 “A detailed X-ray investigation of zeta Pup III. A spectroscopic analysis of the whole XMM-Newton RGS spectrum,” by A. Hervé et al, is accepted for publication in Astronomy & Astrophysics; arxiv.org/abs/1301.5090

  
For further information, please contact:
 
Markus Bauer 
ESA Science and Robotic Exploration Communication Officer 
Tel: +31 71 565 6799 
Mob: +31 61 594 3 954
Email:
markus.bauer@esa.int
Yaël Nazé 
Université de Liège, Belgium
Email:
naze@astro.ulg.ac.be
Norbert Schartel 
XMM-Newton Project Scientist 
Tel: +34 91 8131 184
Email:
Norbert.Schartel@sciops.esa.int

Cassini Sees Titan Cooking up Smog

This image shows the first flash of sunlight reflected off a lake on Saturn's moon Titan. The glint off a mirror-like surface is known as a specular reflection. This kind of glint was detected by the visual and infrared mapping spectrometer (VIMS) on NASA's Cassini spacecraft on July 8, 2009. It confirmed the presence of liquid in the moon's northern hemisphere, where lakes are more numerous and larger than those in the southern hemisphere. Scientists using VIMS had confirmed the presence of liquid in Ontario Lacus, the largest lake in the southern hemisphere, in 2008. Image Credit: NASA/JPL/University of Arizona/DLR. › Full image and caption

A paper published this week using data from NASA's Cassini mission describes in more detail than ever before how aerosols in the highest part of the atmosphere are kick-started at Saturn's moon Titan. Scientists want to understand aerosol formation at Titan because it could help predict the behavior of smoggy aerosol layers on Earth.

According to the new paper, published this week in the Proceedings of the National Academy of Sciences, Titan's trademark reddish-brown smog appears to begin with solar radiation on molecules of nitrogen and methane in the ionosphere, which creates a soup of negative and positive ions. Collisions among the organic molecules and the ions help the molecules grow into bigger and more complex aerosols. Lower down in the atmosphere, these aerosols bump into each other and coagulate, and at the same time interact with other, neutral particles. Eventually, they form the heart of the physical processes that rain hydrocarbons on Titan's surface and form lakes, channels and dunes.

The paper was led by Panayotis Lavvas, a Cassini participating scientist based at the University of Reims, Champagne-Ardenne, France. The team analyzed data from three Cassini instruments -- the plasma spectrometer, the ion and neutral mass spectrometer, and the radio and plasma wave science experiment. They compared their results to those obtained by ESA's Huygens probe on its descent through the Titan atmosphere in 2005 and found they were compatible.

The Cassini-Huygens mission is a cooperative project of NASA, the European Space Agency and the Italian Space Agency. NASA's Jet Propulsion Laboratory manages the mission for NASA's Science Mission Directorate, Washington, D.C. JPL is a division of Caltech. For more information on Cassini, visit http://www.nasa.gov/cassini and http://saturn.jpl.nasa.gov .

Jia-Rui C. Cook 818-354-0850
Jet Propulsion Laboratory, Pasadena, Calif.

jccook@jpl.nasa.gov

Monday, February 04, 2013

NASA's SDO Provides First Sightings of How a CME Forms


Solar scientists have long known that at the heart of the great explosions of solar material that shoot off the sun -- known as coronal mass ejections or CMEs – lies a twisted kink of magnetic fields known as a flux rope. But no one has known when or where they form. Now, for the first time, NASA's Solar Dynamics Observatory as captured a flux rope in the very act of formation. Credit: NASA/Goddard Space Flight Center . › Download hi-res video

On July 18, 2012, a fairly small explosion of light burst off the lower right limb of the sun. Such flares often come with an associated eruption of solar material, known as a coronal mass ejection or CME – but this one did not. Something interesting did happen, however. Magnetic field lines in this area of the sun's atmosphere, the corona, began to twist and kink, generating the hottest solar material – a charged gas called plasma – to trace out the newly-formed slinky shape. The plasma glowed brightly in extreme ultraviolet images from the Atmospheric Imaging Assembly (AIA) aboard NASA’s Solar Dynamics Observatory (SDO) and scientists were able to watch for the first time the very formation of something they had long theorized was at the heart of many eruptive events on the sun: a flux rope.

Eight hours later, on July 19, the same region flared again. This time the flux rope's connection to the sun was severed, and the magnetic fields escaped into space, dragging billions of tons of solar material along for the ride -- a classic CME.

The image on the left shows a series of magnetic loops on the sun, as captured by NASA's Solar Dynamics Observatory on July 18, 2012. The image on the right has been processed to highlight the edges of each loop and make the structure more clear. A series of loops such as this is known as a flux rope, and these lie at the heart of eruptions on the sun known as coronal mass ejections (CMEs.) This is the first time scientists were able to discern the timing of a flux rope's formation. Credit: NASA/SDO/Goddard Space Flight Center.  › View larger

"Seeing this structure was amazing," says Angelos Vourlidas, a solar scientist at the Naval Research Laboratory in Washington, D.C. "It looks exactly like the cartoon sketches theorists have been drawing of flux ropes since the 1970s. It was a series of figure eights lined up to look like a giant slinky on the sun."

More than just gorgeous to see, such direct observation offers one case study on how this crucial kernel at the heart of a CME forms. Such flux ropes have been seen in images of CMEs as they fly away from the sun, but it's never been known – indeed, has been strongly debated – whether the flux rope formed before or in conjunction with a CME's launch. This case shows a clear-cut example of the flux rope forming ahead of time. Vourlidas is a co-author, along with Spiro Patsourakos and Guillermo Stenborg, of a paper on these results published in the Astrophysical Journal on Jan. 31, 2013.

Spotting such a foreshadowing of a CME could help scientists develop ways to predict them, says Dean Pesnell, the project scientist for SDO at NASA's Goddard Space Flight Center in Greenbelt, Md. "By telling us when and where flux ropes will erupt," Pesnell says. "SDO helps us predict a major source of space weather."

Scientific research is always a dance between hypothesis and experimental confirmation, and the history of the flux rope is no exception. Plasma physicists suggested that such coils of magnetic field lines were at the heart of flares in the 1970s and spacecraft near Earth provided in-situ measurements that occasionally traced out helical structures inside CMEs. Later, the flux ropes were spotted in images of CMEs captured by the joint ESA/NASA Solar Heliospheric Observatory (SOHO) – which launched in 1995 – using the mission's Large Angle and Spectrometric Coronagraph (LASCO), a telescope that blocks out the bright light of the solar disk in order to better see the tenuous corona around it. They are now a regular appearance on coronagraph and heliospheric imaging observations.

When it came to watching them form in a CME, however, the task was much harder. Since CMEs can form quite suddenly – known as impulsive CMEs – the associated flux ropes are smaller and closer to the surface, making it difficult to spot them amongst the many structures in the corona.

In the absence of direct observational evidence, theorists have produced two theories based on general physics of plasmas and magnetic fields of how and when the flux rope might form. In one, the magnetic structure of the rope exists before the CME, and as it evolves over time it twists and kinks becoming increasingly unstable. Eventually it erupts from the sun, releasing enormous amounts of energy and solar plasma. In the second version, the CME erupts when looping magnetic field lines are severed from the sun's surface. While the great blob of solar material streams off the sun, the fields reconnect with each other to form a classic flux rope shape.

On July 19, 2012, SDO captured images of a solar flare in numerous wavelengths. The 131 Angstrom wavelength, shown here in the middle and colorized in teal, portrays particularly hot material on the sun, at 10 million Kelvin, which is why the incredibly hot flare shows up best in that wavelength. The 131 wavelength was also able to show kinked magnetic fields known as a flux rope that lay at the heart of a coronal mass ejection (CME), which also erupted at the same time as the flare. Credit: NASA/Goddard Space Flight Center. › View larger

"In this case, we saw this big eruption on July 19," says Vourlidas. "We wanted to analyze the eruption and we started going back in time – a few minutes, then an hour, then eight hours. And then we saw it. A flux rope that looked just like the cartoons scientists have been drawing for decades."

Vourlidas credits this first sighting to three things. First, the team looked far enough back in time, when previous searches have often only looked a few minutes back. Second, the sun obliged its viewers with the perfect angle at which to see the tell-tale loops of the flux rope. SDO's cameras could look right down the center of the rope, like looking down the tunneled center of a slinky. Third, AIA’s cameras capture imagery that no other cameras do: light at the 131 Angstrom wavelength, which shows solar material heated to temperatures of 10,000,000 K (18,000,000 F / 10,000,000 C). In images of the same region at the same time showing cooler material, the flux rope doesn't show up at all. AIA scientists chose to include a filter to view this unprecedentedly high temperature because they posited that flares could heat the corona to those temperatures. Apparently the same incredibly hot plasma helped highlight the flux rope that would later give rise to a CME.

Over the course of the next eight hours after the July 18 flux rope formed, the rope did show up faintly in images of cooler material, suggesting that the hot material from the flare cooled down over time as the flux rope also rose in space. Then eight hours later, on July 19, the material got hot again, the region flared, and the flux rope escaped into space.

"We could verify that the flux rope was there in the coronagraph from SOHO. We could see the typical slinky structure with multiple round loops inside it," says Vourlidas. "We looked at it with other NASA telescopes, too. We looked at it with everything we've got. It's a wonderful time to be a solar physicist, because thanks to the large number of telescopes we have in space at the moment, we can see things like this from every angle." 

By looking at the very hottest material in the sun's atmosphere (on the left) scientists could observe the tell tale signs of the twisted magnetic fields of a flux rope – which lay at the heart of coronal mass ejections (CMEs). The flux rope doesn't show up in a nearly simultaneous image of cooler material (on the right). These images were captured by NASA's Solar Dynamics Observatory on July 19, 2012. Credit: NASA/SDO.  › View larger
 
Vourlidas says that images from NASA's Solar Terrestrial Relations Observatory (STEREO) also helped with analysis. Since the two STEREO spacecraft observe the sun from a different perspective than does SDO, the team got a top-down view of the flux rope with STEREO-A’s EUV Imager, which helped unravel the 3-D structure of the flux rope. The foot points of the rope touched in widely separated areas of the solar surface – an interesting structural development in of itself that is worth further study.

The team will certainly look for other examples in the images of the hottest plasma, searching for evidence of pre-formed flux ropes further back in time. But even one such example of direct evidence adds an important step to the constant scientific cycle of theory and observation, helping refine and improve the theories of what causes these giant explosions on the sun.

For more information about NASA's SDO mission, visit: www.nasa.gov/sdo

For high resolution versions of this media, visit: http://svs.gsfc.nasa.gov/vis/a010000/a011100/a011180/
 

NASA's Cassini Watches Storm Choke on Its Own Tail


This set of images from NASA's Cassini mission shows the evolution of a massive thunder-and-lightning storm that circled all the way around Saturn and fizzled when it ran into its own tail. The storm was first detected on Dec. 5, 2010. Image credit: NASA/JPL-Caltech/SSI/Hampton University. › Full image and caption

This mosaic of false-color images from NASA's Cassini spacecraft shows what a giant storm in Saturn's northern hemisphere looked like about a month after it began. Image credit: NASA/JPL-Caltech/SSI/Hampton University.  › Full image and caption

A vortex that was part of a giant storm on Saturn slowly dissipates over time in this set of false color images from NASA's Cassini spacecraft. Image credit: NASA/JPL-Caltech/SSI/Hampton University. › Full image and caption

This image from NASA's Cassini spacecraft reveals the wind patterns within a large vortex that was spawned by a giant northern storm on Saturn. Image credit: NASA/JPL-Caltech/SSI/Hampton University. › Full image and caption

This three-frame animation from NASA's Cassini spacecraft shows the swirling clouds in a vortex spawned by a great northern storm on Saturn. Image credit: NASA/JPL-Caltech/SSI/Hampton University. › See animation

Call it a Saturnian version of the Ouroboros, the mythical serpent that bites its own tail. In a new paper that provides the most detail yet about the life and death of a monstrous thunder-and-lightning storm on Saturn, scientists from NASA's Cassini mission describe how the massive storm churned around the planet until it encountered its own tail and sputtered out. It is the first time scientists have observed a storm consume itself in this way anywhere in the solar system. 

"This Saturn storm behaved like a terrestrial hurricane - but with a twist unique to Saturn," said Andrew Ingersoll, a Cassini imaging team member based at the California Institute of Technology, Pasadena, who is a co-author on the new paper in the journal Icarus. "Even the giant storms at Jupiter don't consume themselves like this, which goes to show that nature can play many awe-inspiring variations on a theme and surprise us again and again." 

Earth's hurricanes feed off the energy of warm water and leave a cold-water wake. This storm in Saturn's northern hemisphere also feasted off warm "air" in the gas giant's atmosphere. The storm, first detected on Dec. 5, 2010, and tracked by Cassini's radio and plasma wave subsystem and imaging cameras, erupted around 33 degrees north latitude. Shortly after the bright, turbulent head of the storm emerged and started moving west, it spawned a clockwise-spinning vortex that drifted much more slowly. Within months, the storm wrapped around the planet at that latitude, stretching about 190,000 miles (300,000 kilometers) in circumference, thundering and throwing lightning along the way. 

Terrestrial storms have never run into their own wakes - they encounter topographic features like mountains first and expend themselves. But Saturn has no land to stop its hurricanes. The bright, turbulent storm head was able to chomp all the way around the planet. It was only when the head of the storm ran into the vortex in June 2011 that the massive, convective storm faded away. Why the encounter would shut down the storm is still a mystery. 

By Aug. 28, after 267 days, the Saturn storm stopped thundering for good. While Cassini's infrared detectors continue to track some lingering effects in higher layers of Saturn's atmosphere, the troposphere -- which is the weather-producing layer, lower in the atmosphere - has been quiet at that latitude. 

"This thunder-and-lightning storm on Saturn was a beast," said Kunio Sayanagi, the paper's lead author and a Cassini imaging team associate at Hampton University in Virginia. "The storm maintained its intensity for an unusually long time. The storm head itself thrashed for 201 days, and its updraft erupted with an intensity that would have sucked out the entire volume of Earth's atmosphere in 150 days. And it also created the largest vortex ever observed in the troposphere of Saturn, expanding up to 7,500 miles [12,000 kilometers] across." 

The vortex grew to be as large as the giant storm known as Oval BA on Jupiter. But Oval BA and Jupiter's more famous storm - the Great Red Spot - are not thunder-and-lightning storms. Jupiter's storms also have a quiet center, unlike the violence at the center of Saturn's storms. 

"Cassini's stay in the Saturn system has enabled us to marvel at the power of this storm," said Scott Edgington, Cassini's deputy project scientist at NASA's Jet Propulsion Laboratory in Pasadena, Calif. "We had front-row seats to a wonderful adventure movie and got to watch the whole plot from start to finish. These kinds of data help scientists compare weather patterns around our solar system and learn what sustains and extinguishes them." 

This storm was the longest running of the massive storms that appear to break out in Saturn's northern hemisphere once every Saturn year (30 Earth years). The longest storm of any size ever detected on Saturn actually unfolded over 334 days in 2009 in an area known as "Storm Alley" in the southern hemisphere, but it was about 100 times smaller in area than the latest northern storm. 

The Cassini-Huygens mission is a cooperative project of NASA, the European Space Agency and the Italian Space Agency. JPL manages the mission for NASA's Science Mission Directorate, Washington. The Cassini orbiter and its two onboard cameras were designed, developed and assembled at JPL. The imaging team consists of scientists from the U.S., England, France and Germany. The imaging operations center is based at the Space Science Institute in Boulder, Colo. 

For more information, visit: http://www.nasa.gov/cassini and http://saturn.jpl.nasa.gov .
Jia-Rui Cook 818-354-0850
Jet Propulsion Laboratory, Pasadena, Calif.

jccook@jpl.nasa.gov 


Saturday, February 02, 2013

Where are all the dwarfs?

 Cosmic Web Stripping, Visualization 
Credits: Alejandro Benitez Llambay 

Astronomers of the international CLUES collaboration have identified “Cosmic Web Stripping” as a new way of explaining the famous missing dwarf problem: the lack of observed dwarf galaxies compared with that predicted by the theory of Cold Dark Matter and Dark Energy.

High-precision observations over the last two decades have indicated that our Universe consists of about 75% Dark Energy, 20% Dark Matter and 5% ordinary matter. Galaxies and matter in the universe clump in an intricate network of filaments and voids, known as the Cosmic Web. Computer experiments on massive supercomputers have shown that in such a Universe a huge number of small “dwarf” galaxies weighing just one thousandth of the Milky Way should have formed in our cosmic neighbourhood. Yet only a handful of these galaxies are observed orbiting around the Milky Way. The observed scarcity of dwarf galaxies is a major challenge to our understanding of galaxy formation.

An international team of researchers has studied this issue within the Constrained Local Universe Simulations project (CLUES). The CLUES simulations use the observed positions and peculiar velocities of galaxies within Tens of Millions of light years of the Milky Way to accurately simulate the local environment of the Milky Way. “The main goal of this project is to simulate the evolution of the Local Group - the Andromeda and Milky Way galaxies and their low-mass neighbours - within their observed large scale environment”, said Stefan Gottlöber of the Leibniz Institute for Astrophysics Potsdam.

Analysing the CLUES simulations, the astronomers have now found that some of the far-out dwarf galaxies in the Local Group move with such high velocities with respect to the Cosmic Web that most of their gas can be stripped and effectively removed. They call this mechanism “Cosmic Web Stripping”, since it is the pancake and filamentary structure of the cosmos that is responsible for depleting the dwarfs’ gas supply.

“These dwarfs move so fast that even the weakest membranes of the Cosmic Web can rip off their gas”, explained Alejandro Benítez LLambay, PhD student at the Instituto de Astronomía Teórica y Experimental of the Universidad Nacional de Córdoba in Argentina, and first author of the publication of this study. Without a large gas reservoir out of which to form stars, these dwarf galaxies should be so small and dim that they would be hardly be visible today. The missing dwarfs may simply be too faint to see.

The study of Benítez Llambay and colleagues is published in the February issue of Astrophysical Letters.

CWS1 and CWS2

Images / Movies
(1)  www.clues-project.org/movies/cosmicwebstripping.html
(2)  www.aip.de/en/news/press/cws1
(3)  www.aip.de/en/news/press/cws2

Movies (1): see website for description
Image (2): Cosmic Web Stripping removes gas from a very fast dwarf galaxy crossing the local web. The image is a visualization of a CLUES simulation. The arrow symbolizes the velocity oft he dwarf, located right below (Credits: Alejandro Benítez Llambay)
Image (3): Zoom into the region where the dwarf is located (Credits: Alejandro Benítez Llambay)

Further information
Constrained Local UniversE Simulations - www.clues-project.org


Publication
Alejandro Benítez-Llambay, Julio F. Navarro, Mario G. Abadi, Stefan Gottlöber, Gustavo Yepes, Yehuda Hoffman, and Matthias Steinmetz: Dwarf galaxies and the Cosmic Web, doi:10.1088/2041-8205/763/2/L41

Scientific Contact: Dr. Stefan Gottlöber, sgottloeber@aip.de, Tel.: 0331 7499 516
Media contact: Dr. Gabriele Schönherr,  presse@aip.de, Tel.: 0331 7499383

The key areas of research at the Leibniz Institute for Astrophysics Potsdam (AIP) are cosmic magnetic fields and extragalactic astrophysics. A considerable part of the institute's efforts aim at the development of research technology in the fields of spectroscopy, robotic telescopes, and e-science. The AIP is the successor of the Berlin Observatory founded in 1700 and of the Astrophysical Observatory of Potsdam founded in 1874. The latter was the world's first observatory to emphasize explicitly the research area of astrophysics. The AIP has been a member of the Leibniz Association since 1992.


Friday, February 01, 2013

Asteroseismology of magnetars

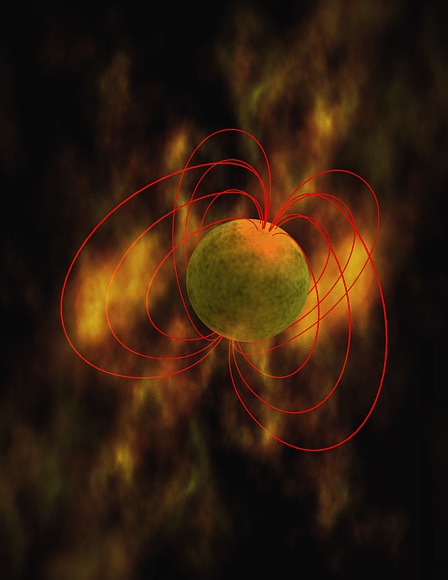
Seismic vibrations on Earth contain information about the structure of our planet, seismic vibrations on distant stellar remnants could shed light not only on the star itself but also on the basic constituents of all matter. The objects under study: neutron stars with strong magnetic fields. The method: a new model that combines both the elastic shear vibrations of the crust and pulsations caused by the magnetic field. Current X-ray observations can only be explained by the coupled vibrations and the model even predicts how high-energy radiation is modulated by these oscillations. 

Fig. 1: Artist's impression of a magnetar.
Credit: NASA

Fig. 2: Schematic structure of a neutron star with about 1.5 solar masses and a diameter of about 20 km. A solid crust (1-2 km thick) surrounds the liquid core, which consists mainly of neutrons, protons and electrons. A magnetic field (red lines) penetrates the entire star and extends into its magnetosphere.

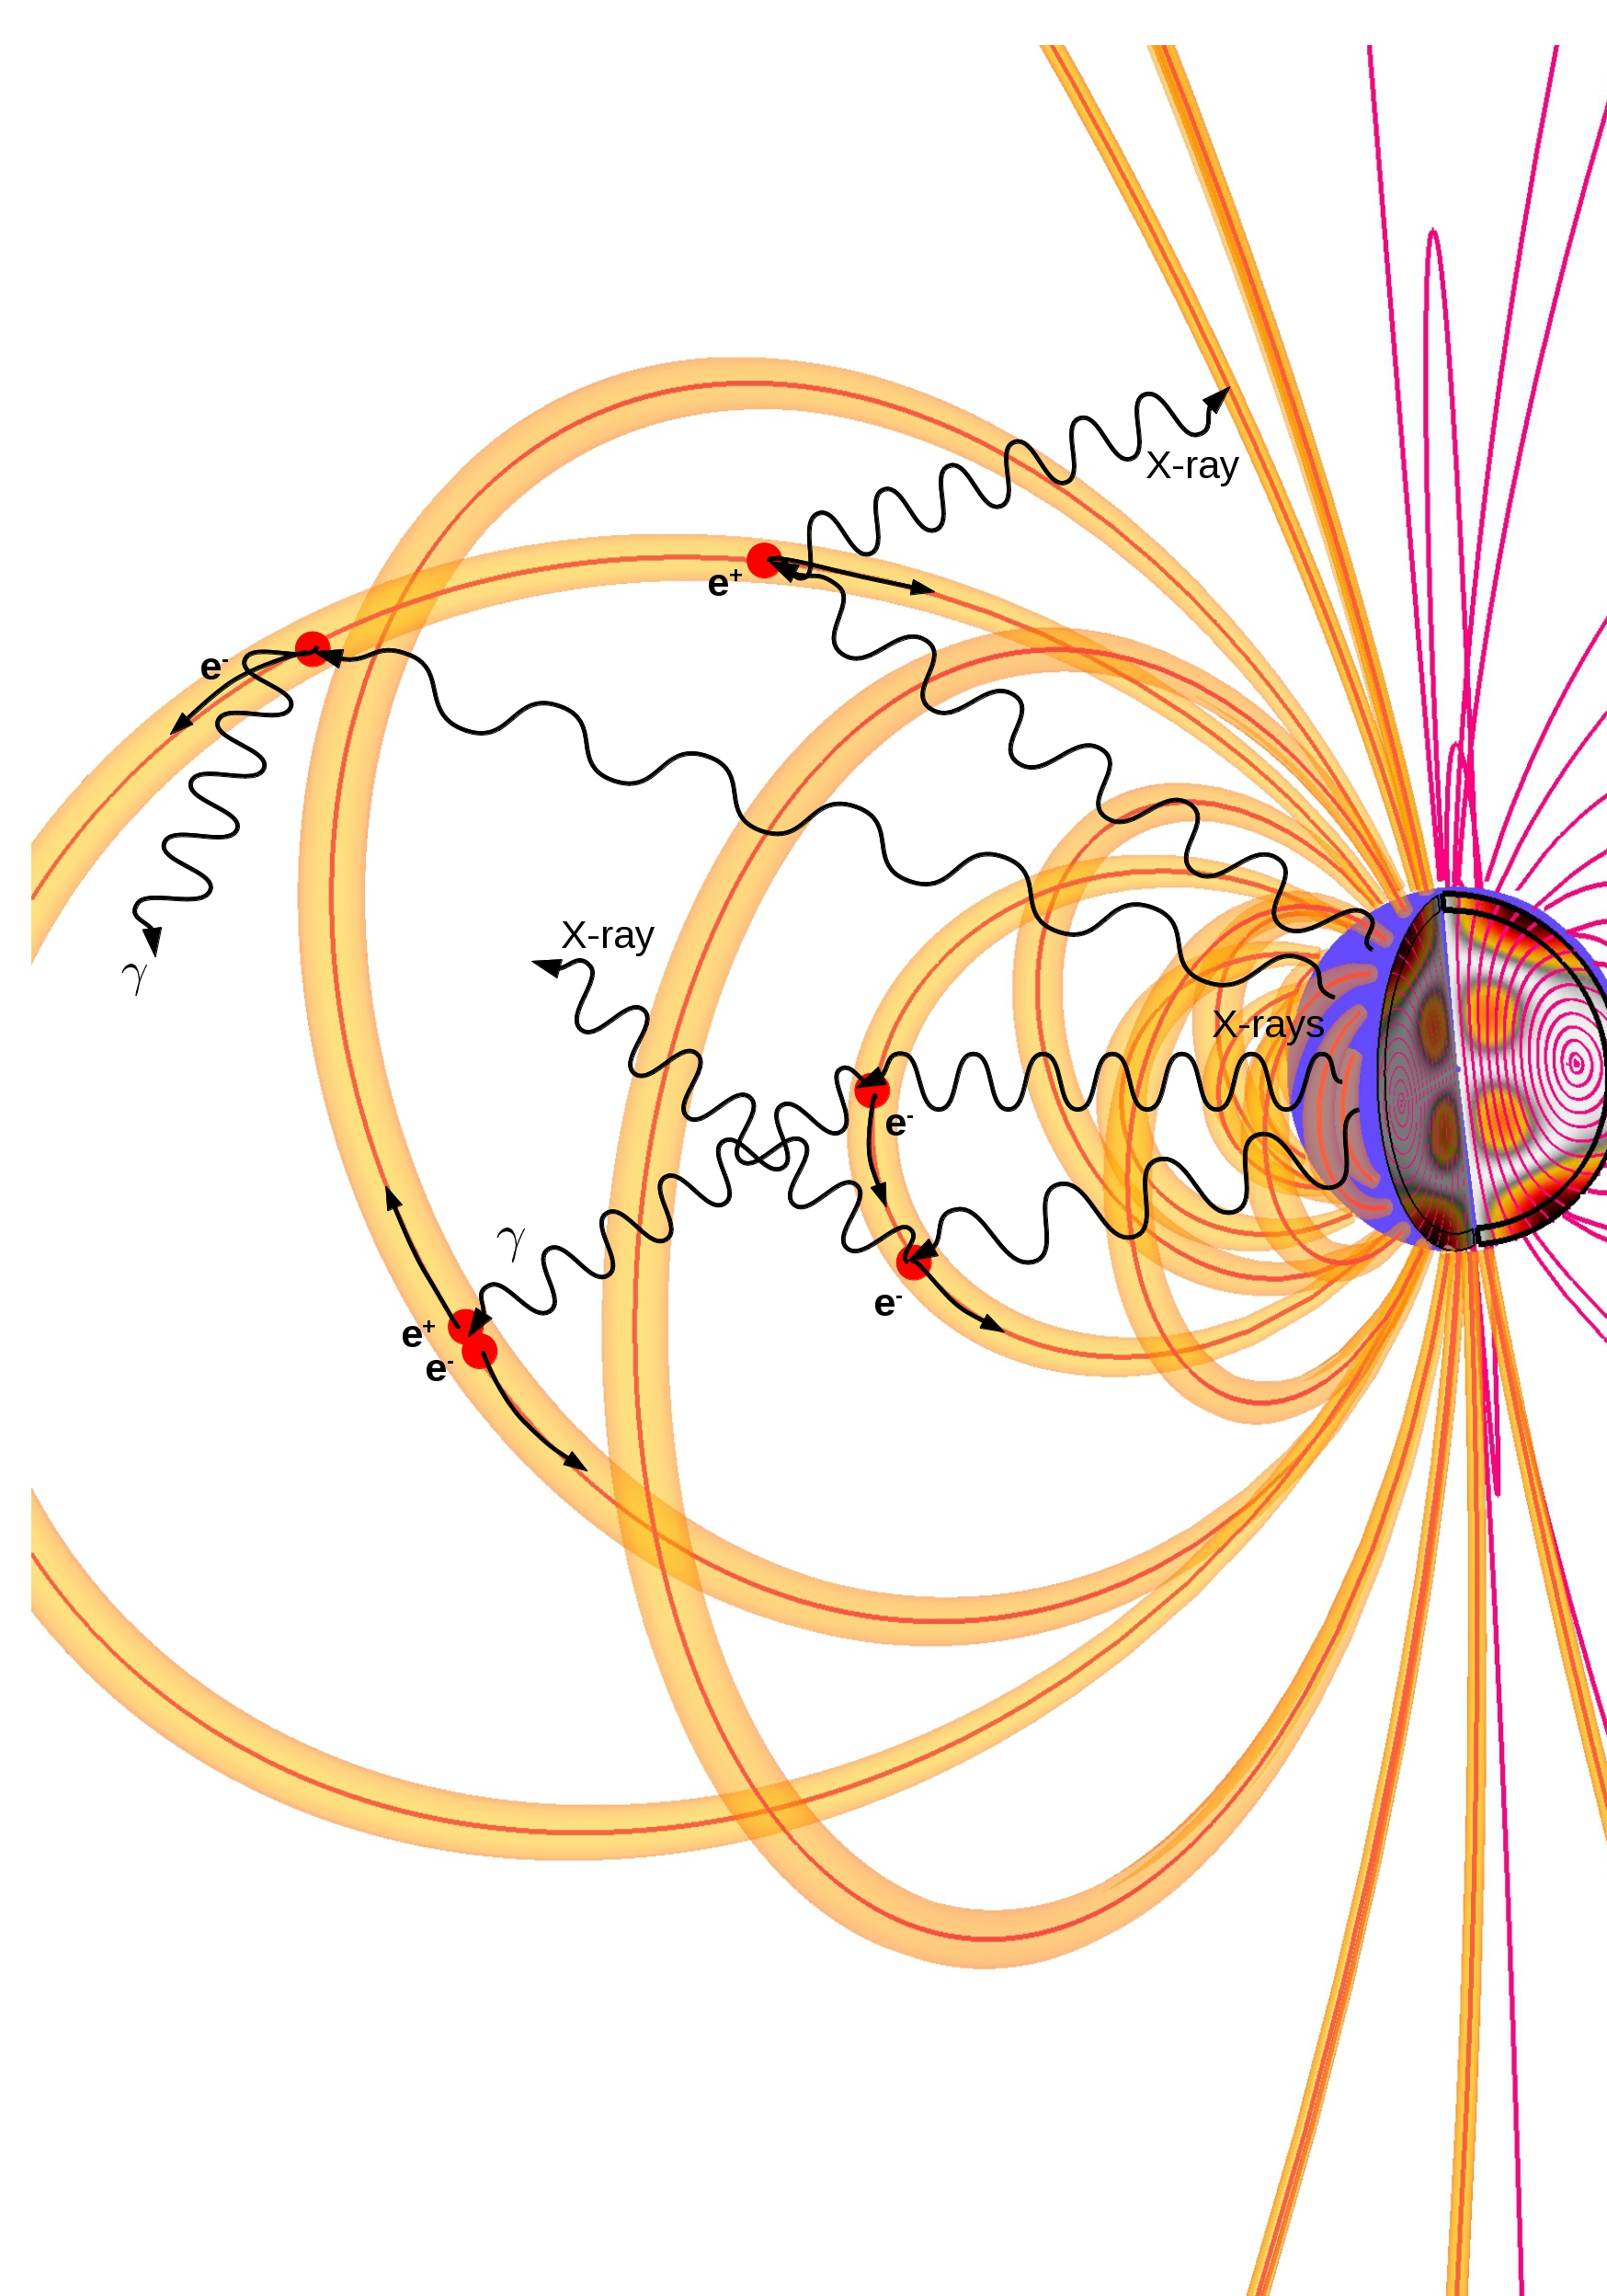
Fig. 3: Schematic representation of the modulation of electromagnetic radiation in the magnetosphere of a neutron star. Electric currents (yellow), composed mainly of electrons and positrons, flow along the magnetic field lines (magenta). The X-ray emission from the star's surface (black) is scattered resonantly by these charge carriers. The resulting high-energy gamma rays can create further electron-positron pairs.

Neutron stars are the remnants of the supernova explosion of massive stars (Fig. 1), and they are the most compact stars in the universe. Their mass of one to two solar masses is confined under the influence of their own gravity to an almost perfect sphere of about 10 km radius, i.e. the density inside a neutron star exceeds even that of an atomic nucleus. These conditions cannot be produced on Earth. If we want to improve our knowledge of the matter and the interactions between the smallest constituents of matter such as neutrons, protons, electrons, muons, but also, hyperons and quarks, we need to understand the structure of neutron stars (Fig. 2). In this respect a particular class of neutron stars called magnetars plays a special role. 

Magnetars are the strongest magnets in the Universe. Estimates indicate that they could reach magnetic fields with a strength at the surface of up to some 1015 Gauss, which would make them about 100 billion times stronger than the strongest magnetic fields on the solar surface (to say nothing of Earth). Sometimes magnetars produce giant gamma-ray bursts, which are thought to arise from a catastrophic reorganization of their magnetic field. During these outbreaks astronomers observe a number of discrete frequencies in the associated X-ray spectrum, which should come from pulsations of the star itself according to established models. Therefore, these observations would be the first evidence of oscillations in neutron stars and one could use them to study their structure. This asteroseismology would be analogous to seismology on Earth or helioseismology on the Sun. 

The magnitudes of the observed frequencies fit well with torsional, elastic shear oscillations in the crust of neutron stars. As the exact pulsation frequencies depend on the properties of the matter in the crust, these frequencies can tell us about the state of this matter. But not all pulsations can be explained as shear pulsations. The frequencies of the so-called Alfvén oscillations caused by the magnetic field are in the observed frequency range as well (for magnetic fields from 1014 to 1015 Gauss). These Alfvén oscillations are not confined to the solid crust, but also provide information on the composition of the liquid core of the neutron star. 

In his PhD thesis at the Max Planck Institute for Astrophysics, Michael Gabler together with colleagues at other institutions developed a model that combines these two types of pulsations. The properties of the coupled system can be investigated by relativistic magneto-hydrodynamic simulations. It turns out that the coupling strength and the resulting magneto-elastic oscillations depend on the magnetic field strength: For weak magnetic fields shear oscillations dominate are present in the crust, while for strong fields Alfvén oscillations dominate. In the interesting range of about 1015 Gauss, the purely elastic pulsations in the crust are absorbed very efficiently by the Alfvén oscillations of the core. Therefore, only coupled (i.e. magneto-elastic) pulsations, whose frequencies are in good agreement with the observed values, can explain the observations. 

In order to observe the oscillations, they have to modulate the intensity of the electromagnetic radiation emitted by the neutron star. A model (Fig. 3) describes the coupling of the magnetic field inside the star to the field of the magnetosphere around the star. Because of the coupling, the external magnetic field oscillates as well, inducing very strong electric currents in the magnetosphere. Photons emitted by the star or in the gamma-ray burst are scattered by the electrical charge carriers (electrons and positrons) of these currents. This resonant cyclotron scattering is very effective and can explain the observed modulation of hard X-rays, as has been shown in Monte Carlo simulations. The X-ray or gamma-ray spectra, which were calculated using the core-crust-magnetosphere model, will be very useful for the design of new X-ray observatories .

Note


For his dissertation "Coupled core-crust-magnetosphere oscillations of magnetars" Michael Gabler received the PhD Award 2012 of the Excellence Cluster Universe in the category "Theory".


Michael Gabler and Ewald Müller 
 

References

PhD thesis, Michael Gabler, TU München, Nov. 2011

Gabler, M., Cerdá-Durán, P., Font, J.A., Müller, E., Stergioulas, N; accepted by MNRAS , arXiv:1208.6443

Gabler, M., Cerdá-Durán, P., ,Stergioulas, N, Font, J.A., Müller, E.; MNRAS 2012, 411, arXiv:1109.6233

Gabler, M., Cerdá-Durán, P., Font, J.A., Müller, E., Stergioulas, N.; MNRAS 2011, 410L, arXiv:1007.0856

The moment the lights went out

Credit: ESA/Hubble & NASA
Acknowledgement: A. Zabludoff, N. Rose

The further away you look, the further back in time you see. Astronomers use this fact to study the evolution of the Universe by looking at nearby and more distant galaxies and comparing their features. Hubble is particularly well suited for this type of work because of its extremely high resolution and its position above the atmosphere. This has allowed it to detect many of the most distant galaxies known, as well as making detailed images of faraway objects.

Comparing galaxies in the distant past with those around us today, astronomers have noticed that the nearby galaxies are far quieter and calmer than their distant brethren, seen earlier in their lives. Nearby galaxies (although not the Milky Way) are often large, elliptical galaxies with little or no ongoing star formation, and their stars tend to be elderly and red in colour. These galaxies, in astronomers' language, are "red and dead".
This is not so for galaxies further away, which typically show more vigorous star birth.

The reason for this appears to be that as the Universe has aged, galaxies have often collided and merged together, and these events disrupt gas clouds within them. A merger will usually be a trigger for such intense star formation that the supply of gas is used up, and no more star formation occurs afterwards. The merged elliptical galaxy then creeps into old age, getting redder as its stars get older. This is expected to happen to the Milky Way when it merges with the nearby Andromeda Galaxy, some four billion years from now.

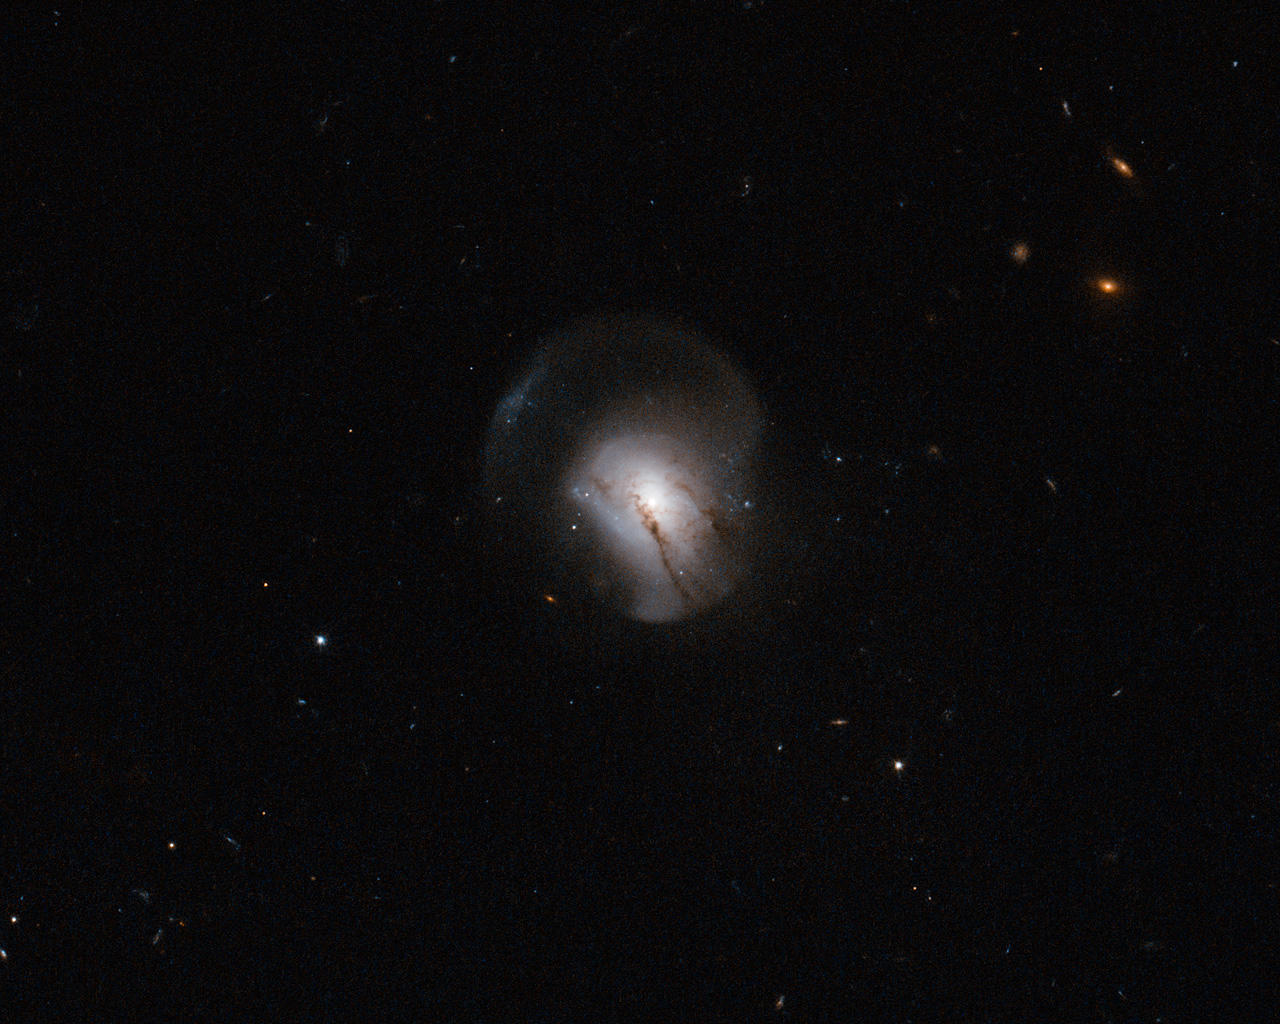
The galaxy in this image, catalogued as 2MASX J09442693+0429569, marks a transitional phase in this process as young, star-forming galaxies settle to become massive, red and dead galaxies.

The galaxy has tail-like features extending from it, typical of a galaxy that has recently undergone a merger. Studying the properties of the light from this galaxy, astronomers see no sign of ongoing star formation; in other words, the merger triggered an event which has used up all the gas. However, the observations suggest that star formation was strong until the very recent past, and has ceased only within the last billion years. This image therefore shows a snapshot of the moment star formation stopped forever in a galaxy. 

A version of this image was entered into the Hidden Treasures image processing competition by contestant Nick Rose.

Source: ESA/Hubble - Space Telescope