Tuesday, January 18, 2022

1,000-Light-Year wide bubble surrounding Earth is source of all nearby, young stars


Artist's illustration of the Local Bubble with star formation occurring on the bubble's surface. Scientists have now shown how a chain of events beginning 14 million years ago with a set of powerful supernovae led to the creation of the vast bubble, responsible for the formation of all young stars within 500 light-years of the Sun and Earth. Credits: Illustration: CfA, Leah Hustak (STScI)


The Earth sits in a 1,000-light-year-wide void surrounded by thousands of young stars — but how did those stars form?

In a paper appearing today in Nature, astronomers at the Center for Astrophysics | Harvard & Smithsonian (CfA) and the Space Telescope Science Institute (STScI) reconstruct the evolutionary history of our galactic neighborhood, showing how a chain of events beginning 14 million years ago led to the creation of a vast bubble that’s responsible for the formation of all nearby, young stars.

"This is really an origin story; for the first time we can explain how all nearby star formation began," said astronomer and data visualization expert Catherine Zucker, who completed the work during a fellowship at the CfA.

The paper's central figure, a 3D spacetime animation, reveals that all young stars and star-forming regions — within 500 light-years of Earth — sit on the surface of a giant bubble known as the Local Bubble. While astronomers have known of its existence for decades, scientists can now see and understand the Local Bubble's beginnings and its impact on the gas around it.

The Source of Our Stars: The Local Bubble

Using a trove of new data and data science techniques, the spacetime animation shows how a series of supernovae that first went off 14 million years ago pushed interstellar gas outwards, creating a bubble-like structure with a surface that's ripe for star formation.

Today, seven well-known star-forming regions or molecular clouds — dense regions in space where stars can form — sit on the surface of the bubble.

"We've calculated that about 15 supernovae have gone off over millions of years to form the Local Bubble that we see today," said Zucker who is now a NASA Hubble Fellow at STScI. The oddly-shaped bubble is not dormant and continues to slowly grow, the astronomers note.

"It's coasting along at about 4 miles per second," Zucker said. "It has lost most of its oomph though and has pretty much plateaued in terms of speed."

The expansion speed of the bubble, as well as the past and present trajectories of the young stars forming on its surface, were derived using data obtained by Gaia, a space-based observatory launched by the European Space Agency.

"This is an incredible detective story, driven by both data and theory," said Harvard professor and Center for Astrophysics astronomer Alyssa Goodman, a study co-author and founder of glue, data visualization software that enabled the discovery. "We can piece together the history of star formation around us using a wide variety of independent clues: supernova models, stellar motions and exquisite new 3D maps of the material surrounding the Local Bubble."

Bubbles Everywhere?

"When the first supernovae that created the Local Bubble went off, our Sun was far away from the action," said co-author João Alves, a professor at the University of Vienna. "But about five million years ago, the Sun's path through the galaxy took it right into the bubble, and now the Sun sits — just by luck — almost right in the bubble's center."

Today, as humans peer out into space from near the Sun, they have a front row seat to the process of star formation occurring all around on the bubble's surface.

Astronomers first theorized that superbubbles were pervasive in the Milky Way nearly 50 years ago. "Now, we have proof — and what are the chances that we are right smack in the middle of one of these things?" asks Goodman. Statistically, it is very unlikely that the Sun would be centered in a giant bubble if such bubbles were rare in our Milky Way Galaxy, she explained.

Goodman likens the discovery to a Milky Way that resembles very hole-y swiss cheese, where holes in the cheese are blasted out by supernovae, and new stars can form in the cheese around the holes created by dying stars.

Next the team, including co-author and Harvard doctoral student Michael Foley, plans to map out more interstellar bubbles to get a full 3D view of their locations, shapes and sizes. Charting out bubbles, and their relationship to each other, will ultimately allow astronomers to understand the role played by dying stars in giving birth to new ones, and in the structure and evolution of galaxies like the Milky Way.

Zucker wonders, "Where do these bubbles touch? How do they interact with each other? How do superbubbles drive the birth of stars like our Sun in the Milky Way?"

Additional co-authors on the paper are Douglas Finkbeiner and Diana Khimey of the CfA; Josefa Groβschedl and Cameren Swiggum of the University of Vienna; Shmuel Bialy of the University of Maryland; Joshua Speagle of the University of Toronto; and Andreas Burkert of the University Observatory Munich.

The articles, analyzed data (on the Harvard Dataverse) and interactive figures and videos are all freely available to everyone through a dedicated website.

The results were presented at a press conference of the American Astronomical Society (AAS) on Wednesday, January 12, 2022. The public can watch a recording of the conference here.

The Center for Astrophysics | Harvard & Smithsonian is a collaboration between Harvard and the Smithsonian designed to ask—and ultimately answer—humanity’s greatest unresolved questions about the nature of the universe. The Center for Astrophysics is headquartered in Cambridge, Massachusetts, with research facilities across the U.S. and around the world.

The Space Telescope Science Institute is expanding the frontiers of space astronomy by hosting the science operations center of the Hubble Space Telescope, the science and operations center for the James Webb Space Telescope, and the science operations center for the future Nancy Grace Roman Space Telescope. STScI also houses the Barbara A. Mikulski Archive for Space Telescopes (MAST) which is a NASA-funded project to support and provide to the astronomical community a variety of astronomical data archives, and is the data repository for the Hubble, Webb, Kepler, K2, TESS missions and more. STScI is operated by the Association of Universities for Research in Astronomy in Washington, D.C.

Credits:

Media Contact:

Christine Pulliam
Space Telescope Science Institute, Baltimore, Maryland

Nadia Whitehead
Center for Astrophysics | Harvard & Smithsonian, Cambridge, Massachusetts


Contact us: Direct inquiries to the
News Team.

Related links and documents:


Monday, January 17, 2022

Are astronomers seeing a signal from giant black holes?


Artist’s impression of the IPTA experiment — an array of pulsars around the Earth embedded in a gravitational wave background from supermassive black hole binaries. The signals from the pulsars measured with a network of global radio telescopes are affected by the gravitational waves and allow for the study of the origin of the background. Image by Carl Knox (OxGrav).

World-wide radio telescope network strengthens evidence for signal that may hint at ultra-low frequency gravitational waves

An international team of astronomers has discovered what could be the early sign of a background signal arising from supermassive black holes, observed through low-frequency gravitational waves. These scientists are comparing data collected from several instruments, including the National Science Foundation’s Green Bank Telescope (GBT.)

Gravitational Waves ripple through spacetime at a light-year-scale, and could originate from mergers of the most massive black holes in the Universe—or from events occurring soon after the formation of the Universe in the Big Bang.

The International Pulsar Timing Array (IPTA) joins the work of several astrophysics collaborations from around the world, including independent data sets of the European Pulsar Timing Array (EPTA), the North American Nanohertz Observatory for Gravitational Waves (NANOGrav), and the Parkes Pulsar Timing Array in Australia (PPTA). The IPTA has shared a new data release, known as Data Release 2 (DR2) consisting of precision timing data from 65 millisecond pulsars—stellar remnants which spin hundreds of times per second, sweeping narrow beams of radio waves that appear as pulses due to the spinning. 20 of these pulsars were observed by the Green Bank Telescope.

“The GBT contributes to the IPTA as one of the most important telescopes used by NANOGrav. The combination of the GBT’s excellent sensitivity, instruments, and ability to see so much of the sky make it a critical part of the IPTA’s efforts,” shares Dr. Ryan Lynch, a Green Bank Observatory scientist and NANOGrav member.

Research of the combined IPTA DR2, and other independent data sets from the three constituent collaborations, has revealed strong evidence for this new low-frequency gravitational wave background signal, correlated many of the pulsars. The characteristics of this common-among-pulsars signal are in broad agreement with those expected from a GW “background” (GWB). This background is formed by many different overlapping GW signals emitted from the cosmic population of supermassive binary black holes (i.e., two supermassive black holes orbiting each other and eventually merging), analogous to background noise from the many overlapping voices in a crowded hall. This result further strengthens the gradual emergence of similar signals that have been found in the individual data sets of the participating collaborations over the past few years.

But scientists caution they do not yet have definitive evidence for the GWB, and are still looking into what else this signal could be, and gathering more information to strengthen their findings. The “smoking gun” for a gravitational wave detection is a unique relationship in the strength of the signal between pulsars in different parts of the sky. While these “spatial correlations” have not yet been detected, the existing signal is consistent with what scientists expect to see at first. The IPTA is working diligently to analyze more recent data, which could confirm the nature of the new signal. In addition, contributions from new telescopes such as MeerKAT and from other collaborations, such as the India Pulsar Timing Array, will be important in the future. Dr. Maura McLaughlin of West Virginia University, who uses the GBT for data collection for NANOGrav, says that, “If the signal we are currently seeing is the first hint of a GWB, then based on our simulations, it is possible we will have more definite measurements of the spatial correlations necessary to conclusively identify the origin of the common signal in the near future.”

“The IPTA is a great example of scientists and instruments from around the world coming together to advance our understanding of the cosmos,” shares Lynch. The Green Bank Observatory is developing new technology to enhance the GBT’s capabilities for this research, “New instruments, like our upcoming ultrawideband receiver [funded by the Moore Foundation], will ensure that the GBT continues to make essential contributions to NANOGrav and the IPTA. If what we are seeing here is indeed the signature of gravitational waves, then the next few years are going to be really exciting.”

Written by Jill Malusky


International Pulsar Timing Array Steering Committee, Megan DeCesar - megandecesar@gmail.com

Green Bank Observatory, Jill Malusky - jmalusky@nrao.edu


Sunday, January 16, 2022

Galaxies, Assemble!: MaNGA team releases largest-ever collection of 3-D maps of nearby galaxies


An image of the Whirlpool galaxy (M51); an iconic nearby galaxy, made using a Mosaic of images of one thousand galaxies, ten percent of the entire in the MaNGA sample. The top panel of the inset shows an SDSS image of galaxy MaNGA ID 1-37995; the bottom panel shows the MaNGA datacube for that galaxy, displaying just 9 of the over 30 different maps available in the MaNGA data. Explore an
interactive mosaic of this image! Image credit: Karen Masters and the SDSS collaboration


MaNGA measures spectra at multiple points in the same galaxy, using a newly created fiber bundle technology. The left-hand side shows the Sloan Foundation Telescope and a close-up of the tip of the fiber bundle. The bottom right illustrates how each fiber observes a different section of each galaxy. The image (from the Hubble Space Telescope) shows one of the first galaxies that that MaNGA measured.  The top right shows data gathered by two fibers observing two different part of the galaxy, showing how the spectrum of the central regions differs dramatically from outer regions. Click to download a larger version from Google Drive. Image credit: Dana Berry / SkyWorks Digital, Inc., David Law, SDSS Collaboration. Hubble Space Telescope image credit: NASA, ESA, the Hubble Heritage (STScI/AURA)-ESA/Hubble Collaboration, and A. Evans (University of Virginia, Charlottesville/NRAO/Stony Brook University)


The Hertzsprung-Russelll diagram for the nearly 12,000 stars observed by MaStar. Each little circle in the diagram represents a unique star. The vertical axis shows how luminous the stars are relative to the Sun. The horizontal axis shows how hot it is. The size of the circle indicates how strong gravity is on their surface. The bigger the circle, the smaller is the gravity on their surface, with the red giant stars in the upper right corner. The position of our Sun is indicated by the red dot in the middle. The color of the circles indicate the amount of heavy elements as compared to the Sun. Blue and purple colors mean the stars have less heavy elements, and yellow means the stars have more heavy elements than the Sun.
Click to download a larger version from Google Drive. Image credit:Renbin Yan and the SDSS collaboration

Just over a month ago, scientists from the Sloan Digital Sky Survey (SDSS) released the complete dataset of 10,000 galaxies observed by the Mapping Nearby Galaxies at Apache Point Observatory (MaNGA) project, making MaNGA the largest galaxy survey of its kind.

MaNGA is a special kind of galaxy survey, which makes use of an innovative fiber-bundling technology to make detailed spectral maps of thousands of nearby galaxies. Spectra are graphs that show the amount of light given off by a galaxy at different wavelengths, much like a rainbow shows the amount of sunlight in various colors. Most previous galaxy surveys have either taken detailed images in a handful or just one colour, or measured just a single spectrum for an entire galaxy, but MaNGA works differently.

MaNGA made use of an innovative technique for bundling sets of fiber-optic cables into tightly-packed hexagonal arrays. With these bundles the team measured spectra at tens to hundreds of separate points in each galaxy, resulting in a “datacube” containing full spectroscopic information at each point. Making use of the famous SDSS plug plates, which allow multiple such bundles to be precisely aligned over target galaxies, MaNGA was able to observe seventeen galaxies at once. Similar surveys could only observe one galaxy at a time, making MaNGA almost twenty times faster than previous efforts — and six years of observing in this mode created the largest ever sample size of this kind.

Kevin Bundy, from the University of California at Santa Cruz and MaNGA’s PI, explains the motivation behind the MaNGA survey. “Observing such a large sample with MaNGA allows us to see how the detailed internal properties of galaxies vary in systematic ways with other factors, like galaxy mass, or where galaxies live in the Universe. These patterns are the key to understanding the physical processes that shape galaxy evolution.”

Researchers study each data cube to reveal its galaxy’s detailed chemical composition, find the ages, chemical makeup and motions of the stars inside it and map ionized interstellar gas. MaNGA has created over 30 different maps for each galaxy. These maps can be used for lots of different applications, for example, to estimate how many baby stars are being formed at every position in the galaxy, or to find the influence of the central supermassive black hole. MaNGA dramatically increases the number of galaxies with this detailed information, and a sister project, the MaNGA Stellar Library (MaStar), helped it along.

Galaxies are made of stars, so understanding them in detail requires a detailed library of spectra of stars. Alongside the complete release of MaNGA, SDSS scientists are pleased to announce the completion of MaStar, which made use of otherwise unused time on the MaNGA instrument to observe over 24,000 stars, enabling the scientists to more accurately extract information from the MaNGA data. Renbin Yan of the Chinese University of Hong Kong, and the leader of the MaStar project explained “MaStar is a special kind of library that includes spectra for as many types of stars as possible. Using these data, we can figure out how many of each type of star add up to make each of the many spectra from a MaNGA galaxy, and reconstruct the most accurate view ever of when and where stars formed in that galaxy’s cosmic history.”

For example, MaNGA data have been used to make movies showing how the location where baby stars form moves around through spiral arms and other features in galaxies. Identifying which spectra came from which internal structure turns out to be tricky for computers, but with the help of citizen scientists, the MaNGA team have been able to do this, providing in this release maps showing where the structures are. And the kinematics of galaxies can reveal previously unknown galaxy interactions.

All of this MaNGA data has been made publicly available, for anyone to use, and the SDSS team have also created a specially designed tool dubbed “Marvin”, to help with data access. Marvin allows anyone to have a quick look at the data of each galaxy in an easy-to-use web interface, and is also available as a powerful set of python modules which allow anyone familiar with coding to access and visualize this complex data. Brian Cherinka, one of the lead developers of Marvin from Space Telescope Science Institute explains, “Marvin was designed specifically to access the complex MaNGA data and help researchers to avoid some of the common pitfalls in data visualization and access.”

Using MaNGA data and an early version of Marvin, scientists have already been discovering many new things about galaxies, with over 500 papers already published using the data. For example, MaNGA team members discovered a new class of galaxy, dubbed a red geyser, in which outflows from the supermassive black hole, revealed in MaNGA maps of ionized gas, are preventing new stars from forming. And to scientists’ surprise this happens even in the smallest galaxies.

Making MaNGA data both publicly available, and accessible will fuel science analyses for years to come, and puts the full power of MaNGA data into the hands of anyone who wants to use it. “It’s important to us that the data is not just available, but also accessible, so that anyone with an interest in galaxies can use MaNGA data for their research, education, or just for fun, can explore the cubes, spectra and maps to learn more these galaxies,” says Anne-Marie Weijmans of the University of St Andrews who led the part of the SDSS team in charge of data releases, “You don’t need to be a galaxy expert to work with MaNGA data: we have many tutorials on our website to get you started.”

The instrumentation innovations developed for MaNGA will reverberate into the future. The next generation of SDSS (SDSS-V) is expanding on the novel fiber-packing methods developed for MaNGA to construct even larger fiber bundles for its Local Volume Mapper program. This survey will also study gas and newly-formed stars, but in an environment much closer to home — our own Milky Way and its nearby smaller neighbors. By combining these data with what MaNGA has learned from thousands of more distant galaxies, astronomers will gain a much deeper understanding of how gas and stars coexist and interact throughout a galaxy’s lifetime.


Contacts:


Press Releases:

All prior SDSS press releases can be found in the press release archives of the various phases of the SDSS:


About the Sloan Digital Sky Survey

Funding for the Sloan Digital Sky Survey IV has been provided by the Alfred P. Sloan Foundation, the U.S. Department of Energy Office of Science, and the Participating Institutions. SDSS acknowledges support and resources from the Center for High-Performance Computing at the University of Utah.

The SDSS web site is
www.sdss.org.

SDSS is managed by the Astrophysical Research Consortium for the Participating Institutions of the SDSS Collaboration including the Brazilian Participation Group, the Carnegie Institution for Science, Carnegie Mellon University, Center for Astrophysics | Harvard & Smithsonian (CfA), the Chilean Participation Group, the French Participation Group, Instituto de Astrofísica de Canarias, The Johns Hopkins University, Kavli Institute for the Physics and Mathematics of the Universe (IPMU) / University of Tokyo, the Korean Participation Group, Lawrence Berkeley National Laboratory, Leibniz Institut für Astrophysik Potsdam (AIP), Max-Planck-Institut für Astronomie (MPIA Heidelberg), Max-Planck-Institut für Astrophysik (MPA Garching), Max-Planck-Institut für Extraterrestrische Physik (MPE), National Astronomical Observatories of China, New Mexico State University, New York University, University of Notre Dame, Observatório Nacional / MCTI, The Ohio State University, Pennsylvania State University, Shanghai Astronomical Observatory, United Kingdom Participation Group, Universidad Nacional Autónoma de México, University of Arizona, University of Colorado Boulder, University of Oxford, University of Portsmouth, University of Utah, University of Virginia, University of Washington, University of Wisconsin, Vanderbilt University, and Yale University.

SDSS / Press Releases / Galaxies, Assemble!: MaNGA team releases largest-ever collection of 3-D maps of nearby galaxies


Saturday, January 15, 2022

Twelve for dinner: The Milky Way feeding habits shine a light on Dark Matter


Artist’s representation of our Milky Way Galaxy surrounded by dozens ofstellar streams. These streams were the companion satellite galaxies orglobular clusters that are now being torn apart by our Galaxy’s gravity. Credit: James Josephides and S5 Collaboration


Location of the stars in the dozen streams as seen across the sky. The background shows the stars in our Milky Way from the European Space Agency’s Gaia mission. The AAT is a Southern Hemisphere telescope so only streams in the Southern sky are observed by S5. Credit: Ting Li, S5 Collaboration and European Space Agency)

Artist’s impression of twelve stellar streams observed by S5, seen from the Galactic South Pole
Credit: Geraint F. Lewis, S5 Collaboration


A movie showing the 3-D location of individual stars in the dozen streams observed by S5. The colors of individual points are according to a star’s 3-D velocity. Credit: Sergey Koposov, S5 Collaboration


The tidal disruption of ten globular clusters in the Milky Way for 8 billion years. The red particles show the dark matter of the simulated Milky Way and the green particles show the disrupting globular clusters. The stars from the disrupting globular cluster form long stellar streams which follow the orbit. Astronomers use these streams to measure the mass distribution and clumpiness of dark matter in the Milky Way, as well as the accretion history of our Galaxy. Credit: Denis Erkal, S5 Collaboration


This movie follows one globular cluster being torn into a tidal stream over 8 billion years. The red particles show the dark matter of a large galaxy and the green particles show a disrupting globular cluster. The stars near the progenitor form a characteristic “S”-shape due to the gravitational influence of the globular cluster. Credit: Denis Erkal, S5 Collaboration


Flagstaff, AZ. – Astronomers are one step closer to learning the properties of dark matter enveloping our Milky Way galaxy, thanks to a new map of twelve streams of stars orbiting within our Galactic halo.

Understanding these stellar streams is very important for astronomers. As well as revealing the dark matter that holds the stars in their orbits, they also tell us about the formation history of the Milky Way, revealing that the Milky Way has steadily grown over billions of years by shredding and consuming smaller stellar systems..

“We are seeing these streams being disrupted by the Milky Way’s gravitational pull, and eventually becoming part of the Milky Way. This study gives us a snapshot of the Milky Way’s feeding habits, such as what kinds of smaller stellar systems it ‘eats’. As our Galaxy is getting older, it is getting fatter.” said University of Toronto’s Ting Li, the lead author of the paper..

Li and her international team of collaborators—including Lowell Observatory’s Kyler Kuehn—initiated a dedicated program—the Southern Stellar Stream Spectroscopic Survey (S5)—to measure the properties of stellar streams: the shredded remains of neighboring small galaxies and star clusters that are being torn apart by our own Milky Way. .

Li and her team are the first group of scientists to study such a rich collection of stellar streams, measuring the speeds of stars using the Anglo-Australian Telescope (AAT), a 4-meter optical telescope in Australia. Li and her team used the Doppler shift of light, used by the police radar guns to capture speeding drivers, to find out how fast individual stars are moving. .

Unlike previous studies that have focused on one stream at a time, “S5 is dedicated to measuring as many streams as possible, which we can do very efficiently with the unique capabilities of the AAT”, comments co-author Daniel Zucker of Macquarie University. .

The properties of stellar streams reveal the presence of the invisible dark matter of the Milky Way. “Think of a Christmas tree”, says co-author Geraint F. Lewis of the University of Sydney. “On a dark night, we see the Christmas lights, but not the tree they are wrapped around. But the shape of the lights reveals the shape of the tree,” he said. “It is the same with stellar streams – their orbits reveal the dark matter.”.

A crucial ingredient for the success of S5 were observations from the European Gaia space mission. “Gaia provided us with exquisite measurements of positions and motions of stars, essential for identifying members of the stellar streams” says co-author Sergey Koposov of the University of Edinburgh. .

As well as measuring their speeds, the astronomers can use these observations to work out the chemical compositions of the stars, telling us where they were born. “Stellar streams can come either from disrupting galaxies or star clusters,” says co-author Alex Ji of the University of Chicago. “These two types of streams provide different insights into the nature of dark matter.”.

According to Li, these new observations are essential for determining how our Milky Way arose from the featureless universe after the Big Bang. “For me, this is one of the most intriguing questions, a question about our ultimate origins”, Li said. “It is the reason why we founded S5 and built an international collaboration to address this”..

The S5 collaboration has not only built on the work of earlier scientists, but branched out into entirely new science. Kuehn says, “Understanding the characteristics of a dozen separate stellar streams is a significant accomplishment, and there will be plenty more results to come from S5. We’re learning a lot about these streams from our observations, and in the not-too-distant future, we expect to use them to measure important properties of the Milky Way itself—including its total mass and the way that dark matter is spread out through our Galaxy.”.


Li adds, “We are trail-blazers and pathfinders on this journey. It is going to be very exciting!”.

The results have been accepted for publication in the American Astronomical Society’s Astrophysical Journal. A preprint of the accepted version can be found here.

By Kevin Schindler


About Lowell Observatory

Lowell Observatory is a private, nonprofit 501(c)(3) research institution, founded in 1894 by Percival Lowell atop Mars Hill in Flagstaff, Arizona. The observatory has been the site of many important discoveries, including the first detection of large recessional velocities (redshift) of galaxies by Vesto Slipher in 1912-1914 (a result that led ultimately to the realization that the universe is expanding), and the discovery of Pluto by Clyde Tombaugh in 1930. Today, the observatory’s 14 tenured astronomers use ground-based telescopes around the world, telescopes in space, and NASA planetary spacecraft to conduct research in diverse areas of astronomy and planetary science. Lowell Observatory currently operates multiple research instruments at its Anderson Mesa station, east of Flagstaff, and the 4.3-meter Lowell Discovery Telescope near Happy Jack, Arizona. Prior to the pandemic, the observatory also welcomed more than 100,000 guests per year to its Mars Hill campus in Flagstaff, Arizona, for a variety of educational experiences, including historical tours, science presentations, and telescope viewing.


Science Contact

Dr. Kyler Kuehn, Lowell Observatory
(928) 233-3221

kkuehn@lowell.edu

Media Contact

Kevin Schindler, Lowell Observatory
(928) 607-1387

kevin@lowell.edu<


Friday, January 14, 2022

Black Hole Devours a Star Decades Ago, Goes Unnoticed Until Now


Artist's conception of a tidal disruption event (TDE), a star being shredded by the powerful gravity of a supermassive black hole. Material from the star spirals into a disk rotating around the black hole, and a jet of particles is ejected. Credit: Sophia Dagnello, NRAO/AUI/NSF

Vikram Ravi
Credit: Caltech

Jean Somalwar
Credit: Caltech


Every galaxy, including our own Milky Way, has at its center a massive black hole whose gravity influences the stars around it. Generally, the stars orbit around the black hole without incident, but sometimes a star will wander a little too close, and the black hole will "make a meal" of the star in a process astrophysicists have termed spaghettification.

"Gravity around the black hole will shred these unlucky stars, causing them to be squeezed into thin streams and fall into the black hole," says Vikram Ravi, assistant professor of astronomy at Caltech. "This is a really messy process. The stars don't go quietly!"

As the stars are devoured, their remains swirl around the black hole and glow with light of different frequencies, which telescopes can detect. In some cases, the stellar remains are expelled in powerful jets that shine with radio-frequency light waves.

Ravi and his team, including two graduate students at Caltech, have now discovered what appears to be one of these black-hole-eating-a-star events—also known as tidal disruption events, or TDEs—using archival observations made by radio telescopes. Of the roughly 100 TDEs that have been discovered to date, this is only the second candidate to be found using radio waves. The first was discovered in 2020 by Marin Anderson (MS '14, PhD '19), a postdoctoral scholar at JPL, which is managed by Caltech for NASA.

"TDEs are primarily discovered in optical and X-ray light, but these methods may be missing some TDEs, such as those buried in dust," says Ravi, who is lead author of a new report on the findings accepted for publication in The Astrophysical Journal. "This study demonstrates the power of radio surveys to discover TDEs."

The same newfound TDE was also uncovered by astronomers at the University of Toronto, so the scientists teamed up to jointly publish their findings.

"An unprecedented amount of radio observations are now becoming available, positioning us to discover many more sources like this one," says co-author Hannah Dykaar of the University of Toronto. "Interestingly, neither of the radio-discovered candidates were found in the type of galaxy most popular for TDEs. Finding more of these radio TDEs could help us to illuminate ongoing mysteries about what types of galaxies they occur in and just how many there are in the universe."

The new TDE event, called J1533+2727, was first noticed by Ravi's team after two high school interns from Cambridge, Massachusetts—Ginevra Zaccagnini and Jackson Codd— scanned through decades of radio data captured by the National Radio Astronomy Observatory's (NRAO's) Karl G. Jansky Very Large Array (VLA) in New Mexico. The students worked with Ravi from 2018 to 2019 while he was a postdoctoral fellow at Harvard University. By comparing radio observations taken years apart, they found that one object, J1533+2727, was fairly bright in the mid-1990s but had dramatically faded by 2017.

Like detectives uncovering new clues in a historical case, they then searched the archives of the NRAO's Green Bank 300-foot telescope and learned that the same object was even brighter in 1986 and 1987 (the Green Bank telescope collapsed in 1988). Since its peak of brightness in the mid-1980s, J1533+2727 has faded by a factor of 500.

Adding up all the evidence, including brand-new VLA observations, the scientists think that the new TDE occurred when a supermassive black hole at the heart of a galaxy 500 million light-years away crushed a star and then expelled a radio jet traveling at near the speed of light. Three other TDEs have been associated with these so-called relativistic jets so far, but those were found in galaxies over 10 times farther away.

"This is the first discovery of a relativistic TDE candidate in the relatively nearby universe, showing that these radio-bright TDEs may be more common than we thought before," says Ravi.

TDEs have become a valuable tool for studying massive black holes. They were first theorized in the 1980s and then finally detected for the first time in the 1990s. Now that more than 100 have been found, the events have become a new means to study the hidden happenings of black holes.

Caltech graduate student Jean Somalwar, a new member in Ravi's group who is not an author on the current study, is hoping to capture more radio-bright TDEs with the VLA. She and her team have recently published one such candidate, which is either a TDE or a mysterious flare from an active supermassive black hole. Additionally, she is using data from the Zwicky Transient Facility, or ZTF, at Caltech's Palomar Observatory to uncover more optically bright TDEs (ZTF, which scans the night sky every two nights in visible light, has already discovered more than 15 of these events).

"TDEs basically turn flashlights onto these extreme regions at the centers of galaxies that we would not otherwise be able to see," says Somalwar. "They have become very powerful tools in recent years."

Somalwar and Ravi presented these results virtually on January 10, 2022, at the 239th meeting of the American Astronomical Society.

The Astrophysical Journal paper, titled "FIRST J153350.8+272729: the radio afterglow of a decades-old tidal disruption event," was funded by Harvard, the National Science Foundation (NSF), the City of Cambridge, the John G. Wolbach Library, and the Cambridge Rotary. Other Caltech authors include graduate student Dillon Dong (MS '18), Professor of Astronomy Gregg Hallinan, and staff scientist Casey Law. Bryan Gaensler of University of Toronto is also an author.

Written by Whitney Clavin
 
Contact:
 
Whitney Clavin
(626) 395‑1944
wclavin@caltech.edu


Thursday, January 13, 2022

Astronomers Find Most Luminous "Cow" to Shine in X-Rays

Artwork comparing a normal supernova to a Cow-like supernova
Credit: Bill Saxton, NRAO/AUI/NSF


The location of AT2020mrf is seen here in images from the eROSITA X-ray telescope. The right panel shows the detection of a new source between July 21 and July 24, 2020. The left panel shows that the source was not there six months earlier. Credit: Pavel Medvedev, SRG/eROSITA


Yuhan Yao
Credit: Yuhan Yao/Caltech


Shri Kulkarni
Credit: Caltech


Results narrow in on what powers new class of supernovae
 
Another member of the new "Cow" class of supernova explosions has been discovered—the brightest one seen in X-rays to date. The new event, dubbed AT2020mrf, is only the fifth found so far belonging to the Cow class of supernovae. The group is named after the first supernova found in this class, AT2018cow, whose randomly generated name just happened to spell the word "cow."
 
What lies behind these unusual stellar explosions? New evidence points to either active black holes or neutron stars.When a massive star explodes, it leaves behind either a black hole or a dead stellar remnant called a neutron star. Typically, these stellar remnants are relatively inactive and shrouded by material ejected in the explosion. But according to Yuhan Yao (MS '20), a graduate student at Caltech, Cow-like events have at their cores very active, and mostly exposed, compact objects that emit high-energy X-ray emission. Yao presented the new findings virtually at the 239th meeting of the American Astronomical Society."We can see down into the heart of these explosions to directly witness the birth of black holes and neutron stars," she says, noting the supernovae are not cloaked by material.

The first Cow event, AT2018cow, shocked astronomers when it was discovered in 2018: the stellar explosion was 10 times brighter in visible light than typical supernovae and faded more quickly. It also gave off a large amount of highly variable X-rays, leading astronomers to believe that they were directly witnessing the birth of a black hole or neutron star for the first time.

Another distinguishing factor of Cows is that they throw off heaps of mass before they explode, and this mass gets illuminated later, after the explosion. When the stars blow up, they generate shock waves that are thought to plow through the pre-existing material, causing them to glow in radio and millimeter-wavelength light.

AT2020mrf is the first to be found initially in X-rays rather than optical light. Yao and her colleagues spotted the event in July 2020 using X-ray data from the Russian--German Spektrum-Roentgen-Gamma (SRG) telescope. They checked observations taken in optical light by the Zwicky Transient Facility (ZTF), which operates from Caltech's Palomar Observatory, and found that ZTF had also spotted the event.

The SRG data revealed that this explosion initially shined with 20 times more X-ray light than the original Cow event. Data captured one year later by NASA's Chandra X-Ray Observatory showed that the explosion was not only still sizzling but shining with 200 times more X-ray light than that detected from the original Cow event over a similar timeframe.

"When I saw the Chandra data, I didn't believe the analysis at first," Yao says. "I reran the analysis several times. This is the brightest Cow supernova seen to date in X-rays.

" Astronomers say that a "central engine" within the supernova debris must be powering the intense, ongoing X-ray radiation. 

"The large amount of energy release and the fast X-ray variability seen in AT2020mrf provide strong evidence that the nature of the central engine is either a very active black hole or a rapidly spinning neutron star called a magnetar," Yao says. "In Cow-like events, we still don't know why the central engine is so active, but it probably has something to do with the type of the progenitor star being different from normal explosions."

Because this event did not look exactly like the other four Cow-like events, Yao says this new class of supernovae is more diverse than originally thought. "Finding more members of this class will help us narrow in on the source of their power," she says.

The study, titled "The X-ray and Radio Loud Fast Blue Optical Transient AT2020mrf: Implications for an Emerging Class of Engine-Driven Massive Star Explosions," has been submitted to The Astrophysical Journal. Other authors include Yao's advisor Shri Kulkarni, the George Ellery Hale Professor of Astronomy and Planetary Science at Caltech; Anna Ho (MS '17, PhD '20) and David Khatami of UC Berkeley; Pavel Medvedev, Sergey Sazonov, Marat Gilfanov, Georgii Khorunzhev, and Rashid Sunyaev of Space Research Institute at the Russian Academy of Sciences; Nayana A.J. of the Indian Institute of Astrophysics; Daniel Perley of Liverpool John Moores University in England; and Poonam Chandra of the National Centre for Radio Astrophysics in India. Sazonov is also affiliated with the Moscow Institute of Physics and Technology, and Gilfanov and Sunyaev are affiliated with the Max Planck Institute for Astrophysics.

Written by Whitney Clavin
 
Contact:

Whitney Clavin
(626) 395‑1944

wclavin@caltech.edu

Wednesday, January 12, 2022

Cheops reveals a rugby ball-shaped exoplanet

Cheops reveals a rugby ball-shaped exoplanet


ESA’s exoplanet mission Cheops has revealed that an exoplanet orbiting its host star within a day has a deformed shape more like that of a rugby ball than a sphere. This is the first time that the deformation of an exoplanet has been detected, offering new insights into the internal structure of these star-hugging planets.

The planet, known as WASP-103b is located in the constellation of Hercules. It has been deformed by the strong tidal forces between the planet and its host star WASP-103, which is about 200 degrees hotter and 1.7 times larger than the Sun.

Artist impression of planet WASP-103b and its host star

Tidal tug

We experience tides in the oceans of Earth mainly due to the Moon tugging slightly on our planet as it orbits us. The Sun also has a small but significant effect on tides, however it is too far from Earth to cause major deformations of our planet. The same cannot be said for WASP-103b, a planet almost twice the size of Jupiter with 1.5 times its mass, orbiting its host star in less than a day. Astronomers have suspected that such a close proximity would cause monumental tides, but up until now they haven’t been able to measure them.

Using new data from ESA’s Cheops space telescope, combined with data that had already been obtained by the NASA/ESA Hubble Space Telescope and NASA’s Spitzer Space Telescope, astronomers have now been able to detect how tidal forces deform exoplanet WASP-103b from a usual sphere into a rugby ball shape.

Cheops measures exoplanet transits – the dip in light caused when a planet passes in front of its star from our point of view. Ordinarily, studying the shape of the light curve will reveal details about the planet such as its size. The high precision of Cheops together with its pointing flexibility, which enables the satellite to return to a target and to observe multiple transits, has allowed astronomers to detect the minute signal of the tidal deformation of WASP-103b. This distinct signature can be used to unveil even more about the planet.

“It’s incredible that Cheops was actually able to reveal this tiny deformation,” says Jacques Laskar of Paris Observatory, Université Paris Sciences et Lettres, and co-author of the research. “This is the first time such analysis has been made, and we can hope that observing over a longer time interval will strengthen this observation and lead to better knowledge of the planet’s internal structure."

Inflated planet

The team was able to use the transit light curve of WASP-103b to derive a parameter – the Love number – that measures how mass is distributed within a planet. Understanding how mass is distributed can reveal details on the internal structure of the planet.

“The resistance of a material to being deformed depends on its composition,” explains Susana Barros of Instituto de Astrofísica e Ciências do Espaço and University of Porto, Portugal, and lead author of the research. “For example, here on Earth we have tides due to the Moon and the Sun but we can only see tides in the oceans. The rocky part doesn’t move that much. By measuring how much the planet is deformed we can tell how much of it is rocky, gaseous or water.”

The Love number for WASP-103b is similar to Jupiter, which tentatively suggests that the internal structure is similar, despite WASP-103b having twice the radius.

“In principle we would expect a planet with 1.5 times the mass of the Jupiter to be roughly the same size, so WASP-103b must be very inflated due to heating from its star and maybe other mechanisms,” says Susana.

“If we can confirm the details of its internal structure with future observations maybe we could better understand what makes it so inflated. Knowing the size of the core of this exoplanet will also be important to better understand how it formed.”

Since the uncertainty in the Love number is still quite high, it will take future observations with Cheops and the James Webb Space Telescope (Webb) to decipher the details. The extremely high precision of Webb will improve the measurements of tidal deformation of exoplanets, enabling a better comparison between these so-called “hot Jupiters” and giant planets in the Solar System.

Mysterious motion

Another mystery also surrounds WASP-103b. The tidal interactions between a star and a very close-in Jupiter-sized planet would usually cause the planet’s orbital period to shorten, bringing it gradually closer to the star before it is eventually engulfed by the parent star. However, measurements of WASP-103b seem to indicate that the orbital period might be increasing and that the planet is drifting slowly away from the star. This would indicate that something other than tidal forces is the dominant factor affecting this planet.

Susana and her colleagues looked at other potential scenarios, such as a companion star to the host affecting the dynamics of the system or the orbit of the planet being slightly elliptical. They weren’t able to confirm these scenarios, but couldn’t rule them out either. It is also possible that the orbital period is actually decreasing, rather than increasing, but only additional observations of the transits of WASP-103b with Cheops and other telescopes will help shed light on this mystery.

“The size of the effect of tidal deformation on an exoplanet transit light curve is very small, but thanks to the very high precision of Cheops we are able to see this for the first time,” says ESA’s Project Scientist for Cheops, Kate Isaak. “This study is an excellent example of the very diverse questions that exoplanet scientists are able to tackle with Cheops, illustrating the importance of this flexible follow-up mission.” Notes for editors

‘Cheops reveals the tidal deformation of WASP-103b’ by S.C.C. Barros et al. (2021) is published in Astronomy & Astrophysics. DOI: https://www.aanda.org/10.1051/0004-6361/202142196

More about Cheops

Cheops is an ESA mission developed in partnership with Switzerland, with a dedicated consortium led by the University of Bern, and with important contributions from Austria, Belgium, France, Germany, Hungary, Italy, Portugal, Spain, Sweden and the UK. ESA is the Cheops mission architect, responsible for procurement and testing of the satellite, the launch and early operations phase, and in-orbit commissioning, as well as the Guest Observers’ Programme through which scientists world-wide can apply to observe with Cheops. The consortium of 11 ESA Member States led by Switzerland provided essential elements of the mission. The prime contractor for the design and construction of the spacecraft is Airbus Defence and Space in Madrid, Spain.

The Cheops mission consortium runs the Mission Operations Centre located at INTA, in Torrejón de Ardoz near Madrid, Spain, and the Science Operations Centre, located at the University of Geneva, Switzerland. For more information, visit: https://www.esa.int/Cheops 
 
For further information, please contact:

ESA Media Relations

media@esa.int


Tuesday, January 11, 2022

Mrk 462: "Mini" Monster Black Hole Could Hold Clues to Giant's Growth Quick Look: "Mini" Monster Black Hole Could Hold Clues to Giant's Growth

Mrk 462
Credit: X-ray: NASA/CXC/Dartmouth Coll./J. Parker & R. Hickox; Optical/IR: Pan-STARRS

A Tour of MG B2016+112 - More Animations


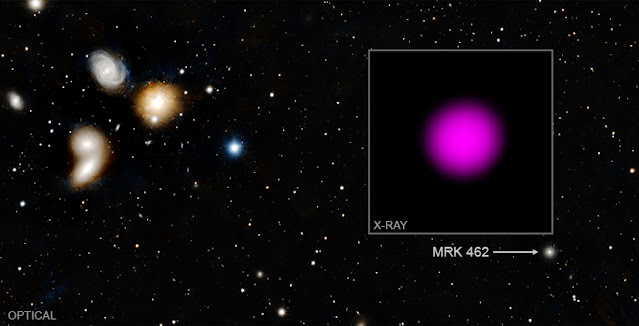
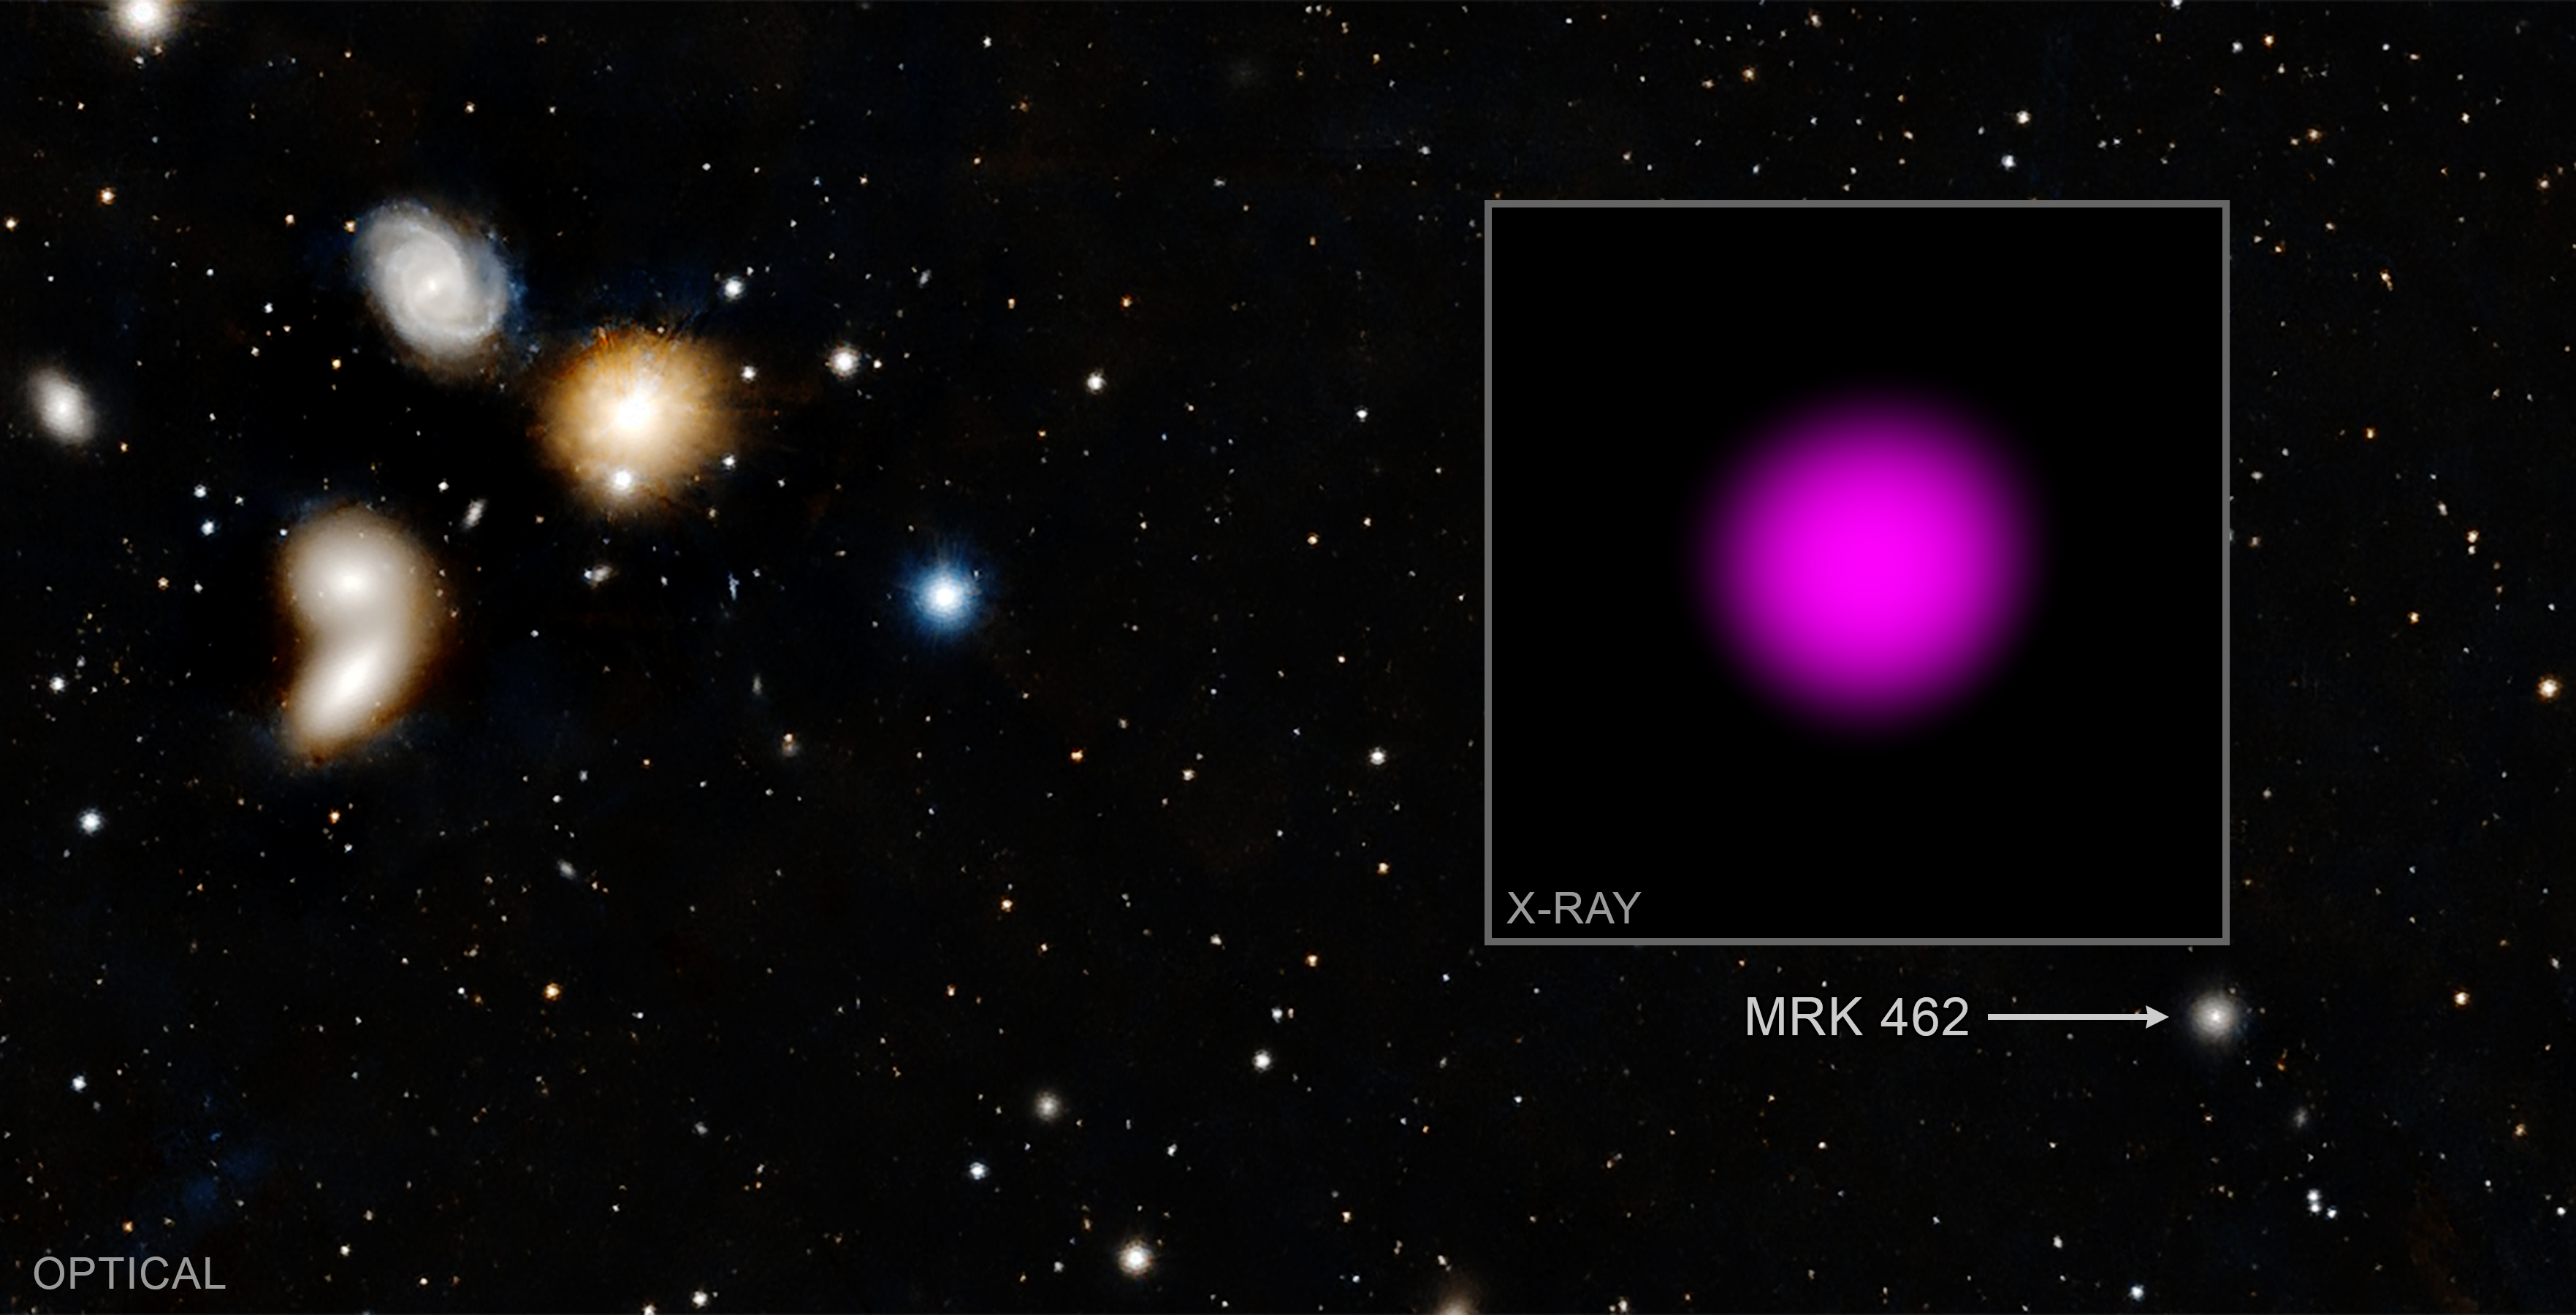
The graphic shows X-rays that NASA's Chandra X-ray Observatory detected from the dwarf galaxy Mrk 462. This X-ray emission (inset) is important because it reveals the presence of a growing supermassive black hole within this relatively small galaxy, as described in our latest press release. The mass contained in this black hole — about 200,000 times the mass of the Sun — provides information to astronomers about how some of the earliest black holes in the Universe may have formed and grown billions of years ago.

The background panel is an optical image from the Pan-STARRS telescope in Hawaii. There are several galaxies that are part of the HCG068 galaxy group on the left-hand side of the image. The galaxy that is emitting copious amounts of X-rays, however, is the much smaller galaxy located to the lower right of the image (marked by the arrow). Mrk 462 is a dwarf galaxy because it contains only a few hundred million stars, which means it holds about a hundred times fewer stars than a galaxy like the Milky Way. Black holes are notoriously hard to find in dwarf galaxies because they are usually too small and dim for optical light telescopes to track the rapid motions of stars in the centers.

Mrk 462 (labeled)
Credit: X-ray: NASA/CXC/Dartmouth Coll./J. Parker & R. Hickox; Optical/IR: Pan-STARRS

To look for signs of black hole growth, researchers used Chandra to observe eight dwarf galaxies that had previously shown hints of black hole activity from optical data gathered by the Sloan Digital Sky Survey. Of those eight, only Mrk 462 showed the X-ray signature of a growing black hole. Moreover, the proportion of high-energy to low-energy X-rays from Mrk 462, along with comparisons to data at other wavelengths, indicates that the Mrk 462 black hole is heavily obscured by gas. This is one of the first times that a heavily buried, or "obscured," supermassive black hole has been found in a dwarf galaxy.

Previous research has shown that black holes can grow to a billion solar masses by the time the Universe is less than a billion years old, a small fraction of its current age. One idea is that these huge objects were created when massive stars collapsed to form black holes that weighed only about 100 times the mass of the sun. Theoretical work, however, struggles to explain how they could pack on weight quickly enough to reach the sizes seen in the early universe. An alternative explanation is that the early Universe was seeded with black holes containing tens of thousands of solar masses when they were created — perhaps from the collapse of gigantic clouds of gas and dust.

If astronomers find that a large fraction of dwarf galaxies contain supermassive black holes like the one in Mrk 462, it favors the idea that small black hole seeds from the earliest generation of stars grew astonishingly quickly to form the billion solar mass objects in the early universe. A smaller fraction would tip the scales to favor the idea that black holes began life weighing tens of thousands of Suns. This is because the conditions necessary for the direct collapse from a giant cloud to a medium-sized black hole should be rare, so it is not expected that a large fraction of dwarf galaxies would contain supermassive black holes. Stellar-mass black holes, on the other hand, are expected in every galaxy.

These results were scheduled to be presented at the 239th meeting of the American Astronomical Society meeting in Salt Lake City, which was canceled due to COVID-19 concerns.

NASA's Marshall Space Flight Center manages the Chandra program. The Smithsonian Astrophysical Observatory's Chandra X-ray Center controls science operations from Cambridge, Massachusetts, and flight operations from Burlington, Massachusetts.


Fast Facts for Mrk 462:

Scale: X-ray image (inset) is about 15 arcsec (7,900 light years) across. Optical image is about 32 arcmin (1 million light years) across.
Category:
Black Holes, Groups & Clusters of Galaxies
Coordinates (J2000): RA 13h 51m 25.4s | Dec +40° 12´ 47.8"
Constellation:
Canes Venatici
Observation Date: August 17, 2018
Observation Time: 4 hours 10 minutes
Obs. ID: 20773
Instrument:
ACIS
References: Parker, J. and Hickox, R., 2022.
Color Code: X-ray: purple; Optical: red, green, blue
Distance Estimate: About 110 million light years (z=0.008)


Monday, January 10, 2022

Measuring Carbon Emission from an Inclined Galaxy

Spiral Galaxy, NGC 7331
Image credit: Adam Block/Mount Lemmon SkyCenter/University of Arizona/Sutter et al., 2021.


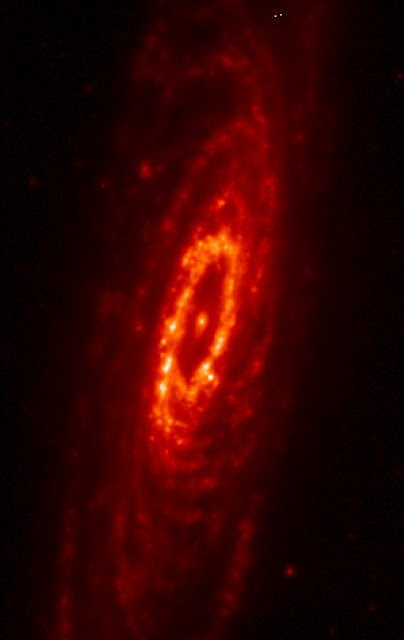
NGC 7331 taken in infrared light by the Spitzer Space Telescope. The central ring is the brightest feature of this galaxy in the infrared, indicating that it is permeated by dust that has been warmed by young stars. Image credit: NASA


Columbia, MD—January 10, 2022. Ionized carbon is an important tracer of astronomical processes, and understanding how the angle of a galaxy affects the observation of ionized carbon can be key for improving analyses of such processes.

Because the effects of observing perspective are complex, spiral galaxies tend to only be studied if their orientation is just right, that is, if telescopes can see them face-on rather than at an angle. Now, a study of the galaxy NGC 7331 with the Stratospheric Observatory for Infrared Astronomy (SOFIA), NASA's airborne observatory has begun to characterize these effects.

Universities Space Research Association’s Jessica Sutter, the lead author of the study, investigated the various factors that can affect ionized carbon emission from a galaxy, including the galaxy’s angle of inclination. Her presentation, “A Map of the Molecular Ring and Arms of a Spiral Galaxy,” at the American Astronomical Society’s Virtual Press Conference will take place on January 10 at 10:15 AM Mountain Time. A paper on this topic has been accepted for publication in The Astrophysical Journal.

“One of the reasons more people haven’t looked at ionized carbon emission from edge-on galaxies is because one can’t do it from ground observations. You need an observing platform at least from the stratosphere, if not in space,” Sutter said. “With SOFIA, we have some more opportunities to get these full maps, and we’re seeing how useful that may be.”

Ionized carbon is an important measurement in astronomy, as it can indicate the presence of star formation, the cooling of the space between stars, and other processes. Moreover, it tends to be quite bright, making it easily detectable in galaxies tens of billions of lightyears away, which is especially useful for galaxies with little other data available.

“Knowing where the ionized carbon emission is coming from – whether photodissociation regions, or ionized hydrogen regions, or diffuse ionized gas – is going to affect how we might use it to trace molecular gas, or star formation, or photodissociation conditions,” Sutter said. “Our observing angle may have an effect.”

Because NGC 7331 is an inclined galaxy, the fraction of ionized carbon observed varied depending on which side of the galaxy was being observed. This should be a significant consideration for researchers, especially if they aren’t sure of the inclination angle of the galaxy they are studying.

"With the help of SOFIA’s unique ability to study ionized carbon from within the Earth’s stratosphere, we hope to expand this analysis by mapping ionized carbon emission from an additional set of galaxies, " said Sutter. This will help uncover how inclination and other structural factors impact the charged atom’s importance in analyses, helping demystify the history of the universe.

Contact:

Suraiya Farukhi, Ph.D.
Director, External Communications

sfarukhi@usra.ed
443-812-6945


SOFIA is a joint project of NASA and the German Space Agency, DLR. DLR provides the telescope, scheduled aircraft maintenance, and other support for the mission. NASA’s Ames Research Center in California’s Silicon Valley manages the SOFIA program, science, and mission operations in cooperation with the Universities Space Research Association, headquartered in Columbia, Maryland, and the German SOFIA Institute at the University of Stuttgart. The aircraft is maintained and operated by NASA’s Armstrong Flight Research Center Building 703, in Palmdale, California.

About USRA

Founded in 1969, under the auspices of the National Academy of Sciences at the request of the U.S. Government, the Universities Space Research Association (USRA) is a nonprofit corporation chartered to advance space-related science, technology, and engineering. USRA operates scientific institutes and facilities, and conducts other major research and educational programs, under Federal funding. USRA engages the university community and employs in-house scientific leadership, innovative research and development, and project management expertise. More information about USRA is available at www.usra.edu.


Friday, January 07, 2022

Bringing the Sun into the lab


A plasma ejection during a solar flare. Immediately after the eruption, cascades of magnetic loops form over the eruption area as the magnetic fields attempt to reorganize. Credit: Solar Dynamics Observatory, NASA. 
Download

Liquid-metal experiment provides insight into the heating mechanism of the Sun's corona

Why the Sun's corona reaches temperatures of several million degrees Celsius is one of the great mysteries of solar physics. A "hot" trail to explain this effect leads to a region of the solar atmosphere just below the corona, where sound waves and certain plasma waves travel at the same speed. In an experiment using the molten alkali metal rubidium and pulsed high magnetic fields, a team from the Helmholtz-Zentrum Dresden-Rossendorf (HZDR) has developed a laboratory model and for the first time experimentally confirmed the theoretically predicted behavior of these plasma waves – so-called Alfvén waves – as the researchers report in the journal Physical Review Letters (DOI:10.1103/PhysRevLett.127.275001).

At 15 million degrees Celsius, the center of our Sun is unimaginably hot. At its surface, it emits its light at a comparatively moderate 6000 degrees Celsius. "It is all the more astonishing that temperatures of several million degrees suddenly prevail again in the overlying Sun's corona," says Dr. Frank Stefani. His team conducts research at the HZDR Institute of Fluid Dynamics on the physics of celestial bodies – including our central star. For Stefani, the phenomenon of corona heating remains one of the great mysteries of solar physics, one that keeps running through his mind in the form of a very simple question: "Why is the pot warmer than the stove?"

That magnetic fields play a dominant role in heating the Sun's corona is now widely accepted in solar physics. However, it remains controversial whether this effect is mainly due to a sudden change in magnetic field structures in the solar plasma or to the dampening of different types of waves. The new work of the Dresden team focuses on the so-called Alfvén waves that occur below the corona in the hot plasma of the solar atmosphere, which is permeated by magnetic fields. The magnetic fields acting on the ionized particles of the plasma resemble a guitar string, whose playing triggers a wave motion. Just as the pitch of a strummed string increases with its tension, the frequency and propagation speed of the Alfvén wave increases with the strength of the magnetic field.

"Just below the Sun's corona lies the so-called magnetic canopy, a layer in which magnetic fields are aligned largely parallel to the solar surface. Here, sound and Alfvén waves have roughly the same speed and can therefore easily morph into each other. We wanted to get to exactly this magic point – where the shock-like transformation of the magnetic energy of the plasma into heat begins," says Stefani, outlining his team's goal.

A dangerous experiment?

Soon after their prediction in 1942, the Alfvén waves had been detected in first liquid-metal experiments and later studied in detail in elaborate plasma physics facilities. Only the conditions of the magnetic canopy, considered crucial for corona heating, remained inaccessible to experimenters until now. On the one hand, in large plasma experiments the Alfvén speed is typically much higher than the speed of sound. On the other hand, in all liquid-metal experiments to date, it has been significantly lower. The reason for this: the relatively low magnetic field strength of common superconducting coils with constant field of about 20 tesla.

But what about pulsed magnetic fields, such as those that can be generated at the HZDR's Dresden High Magnetic Field Laboratory (HLD) with maximum values of almost 100 tesla? This corresponds to about two million times the strength of the Earth's magnetic field: Would these extremely high fields allow Alfvén waves to break through the sound barrier? By looking at the properties of liquid metals, it was known in advance that the alkali metal rubidium actually reaches this magic point already at 54 tesla.

But rubidium ignites spontaneously in air and reacts violently with water. The team therefore initially had doubts as to whether such a dangerous experiment was advisable at all. The doubts were quickly dispelled, recalls Dr. Thomas Herrmannsdörfer of the HLD: "Our energy supply system for operating the pulse magnets converts 50 megajoules in a fraction of a second – with that, we could theoretically get a commercial airliner to take off in a fraction of a second. When I explained to my colleagues that a thousandth of this amount of chemical energy of the liquid rubidium does not worry me very much, their facial expressions visibly brightened."

Pulsed through the magnetic sound barrier

Nevertheless, it was still a rocky road to the successful experiment. Because of the pressures of up to fifty times the atmospheric air pressure generated in the pulsed magnetic field, the rubidium melt had to be enclosed in a sturdy stainless steel container, which an experienced chemist, brought out of retirement, was to fill. By injecting alternating current at the bottom of the container while simultaneously exposing it to the magnetic field, it was finally possible to generate Alfvén waves in the melt, whose upward motion was measured at the expected speed.

The novelty: while up to the magic field strength of 54 tesla all measurements were dominated by the frequency of the alternating current signal, exactly at this point a new signal with halved frequency appeared. This sudden period doubling was in perfect agreement with the theoretical predictions. The Alfvén waves of Stefani's team had broken through the sound barrier for the first time. Although not all observed effects can yet be explained so easily, the work contributes an important detail to solving the puzzle of the Sun's corona heating. For the future, the researchers are planning detailed numerical analyses and further experiments.

Research on the heating mechanism of the Sun's corona is also being carried out elsewhere: the Parker Solar Probe and Solar Orbiter space probes are about to gain new insights at close range.


Publication:

F. Stefani, J. Forbriger, Th. Gundrum, T. Herrmannsdörfer, J. Wosnitza: Mode Conversion and Period Doubling in a Liquid Rubidium Alfvén-Wave Experiment with Coinciding Sound and Alfvén Speeds, in Physical Review Letters, 2021 (DOI:
10.1103/PhysRevLett.127.275001


For more information:

Dr. Frank Stefani
Institute of Fluid Dynamics at HZDR
Phone: +49 351 260 3069
Email:
f.stefani@hzdr.de

Media contact:

Simon Schmitt | Head
Communications and Media Relations at HZDR
Phone: +49 351 260 3400
Email:
s.schmitt@hzdr.de