An image of the Whirlpool galaxy (M51); an iconic nearby galaxy, made using a Mosaic of images of one thousand galaxies, ten percent of the entire in the MaNGA sample. The top panel of the inset shows an SDSS image of galaxy MaNGA ID 1-37995; the bottom panel shows the MaNGA datacube for that galaxy, displaying just 9 of the over 30 different maps available in the MaNGA data. Explore an interactive mosaic of this image! Image credit: Karen Masters and the SDSS collaboration

MaNGA measures spectra at multiple points in the same galaxy, using a newly created fiber bundle technology. The left-hand side shows the Sloan Foundation Telescope and a close-up of the tip of the fiber bundle. The bottom right illustrates how each fiber observes a different section of each galaxy. The image (from the Hubble Space Telescope) shows one of the first galaxies that that MaNGA measured. The top right shows data gathered by two fibers observing two different part of the galaxy, showing how the spectrum of the central regions differs dramatically from outer regions. Click to download a larger version from Google Drive. Image credit: Dana Berry / SkyWorks Digital, Inc., David Law, SDSS Collaboration. Hubble Space Telescope image credit: NASA, ESA, the Hubble Heritage (STScI/AURA)-ESA/Hubble Collaboration, and A. Evans (University of Virginia, Charlottesville/NRAO/Stony Brook University)

The Hertzsprung-Russelll diagram for the nearly 12,000 stars observed by MaStar. Each little circle in the diagram represents a unique star. The vertical axis shows how luminous the stars are relative to the Sun. The horizontal axis shows how hot it is. The size of the circle indicates how strong gravity is on their surface. The bigger the circle, the smaller is the gravity on their surface, with the red giant stars in the upper right corner. The position of our Sun is indicated by the red dot in the middle. The color of the circles indicate the amount of heavy elements as compared to the Sun. Blue and purple colors mean the stars have less heavy elements, and yellow means the stars have more heavy elements than the Sun. Click to download a larger version from Google Drive. Image credit:Renbin Yan and the SDSS collaboration
Just over a month ago, scientists from the Sloan Digital Sky Survey (SDSS) released the complete dataset of 10,000 galaxies observed by the Mapping Nearby Galaxies at Apache Point Observatory (MaNGA) project, making MaNGA the largest galaxy survey of its kind.
MaNGA is a special kind of galaxy survey, which makes use of an innovative fiber-bundling technology to make detailed spectral maps of thousands of nearby galaxies. Spectra are graphs that show the amount of light given off by a galaxy at different wavelengths, much like a rainbow shows the amount of sunlight in various colors. Most previous galaxy surveys have either taken detailed images in a handful or just one colour, or measured just a single spectrum for an entire galaxy, but MaNGA works differently.
MaNGA made use of an innovative technique for bundling sets of fiber-optic cables into tightly-packed hexagonal arrays. With these bundles the team measured spectra at tens to hundreds of separate points in each galaxy, resulting in a “datacube” containing full spectroscopic information at each point. Making use of the famous SDSS plug plates, which allow multiple such bundles to be precisely aligned over target galaxies, MaNGA was able to observe seventeen galaxies at once. Similar surveys could only observe one galaxy at a time, making MaNGA almost twenty times faster than previous efforts — and six years of observing in this mode created the largest ever sample size of this kind.
Kevin Bundy, from the University of California at Santa Cruz and MaNGA’s PI, explains the motivation behind the MaNGA survey. “Observing such a large sample with MaNGA allows us to see how the detailed internal properties of galaxies vary in systematic ways with other factors, like galaxy mass, or where galaxies live in the Universe. These patterns are the key to understanding the physical processes that shape galaxy evolution.”
Researchers study each data cube to reveal its galaxy’s detailed chemical composition, find the ages, chemical makeup and motions of the stars inside it and map ionized interstellar gas. MaNGA has created over 30 different maps for each galaxy. These maps can be used for lots of different applications, for example, to estimate how many baby stars are being formed at every position in the galaxy, or to find the influence of the central supermassive black hole. MaNGA dramatically increases the number of galaxies with this detailed information, and a sister project, the MaNGA Stellar Library (MaStar), helped it along.
Galaxies are made of stars, so understanding them in detail requires a detailed library of spectra of stars. Alongside the complete release of MaNGA, SDSS scientists are pleased to announce the completion of MaStar, which made use of otherwise unused time on the MaNGA instrument to observe over 24,000 stars, enabling the scientists to more accurately extract information from the MaNGA data. Renbin Yan of the Chinese University of Hong Kong, and the leader of the MaStar project explained “MaStar is a special kind of library that includes spectra for as many types of stars as possible. Using these data, we can figure out how many of each type of star add up to make each of the many spectra from a MaNGA galaxy, and reconstruct the most accurate view ever of when and where stars formed in that galaxy’s cosmic history.”
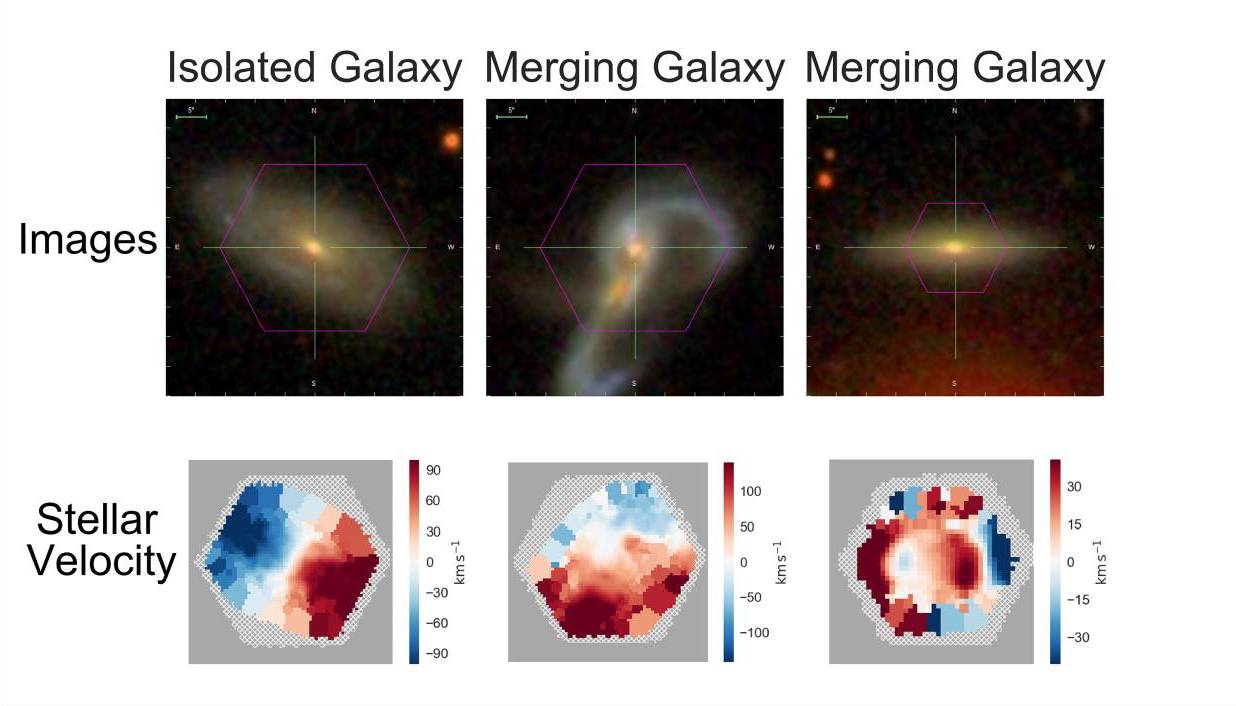
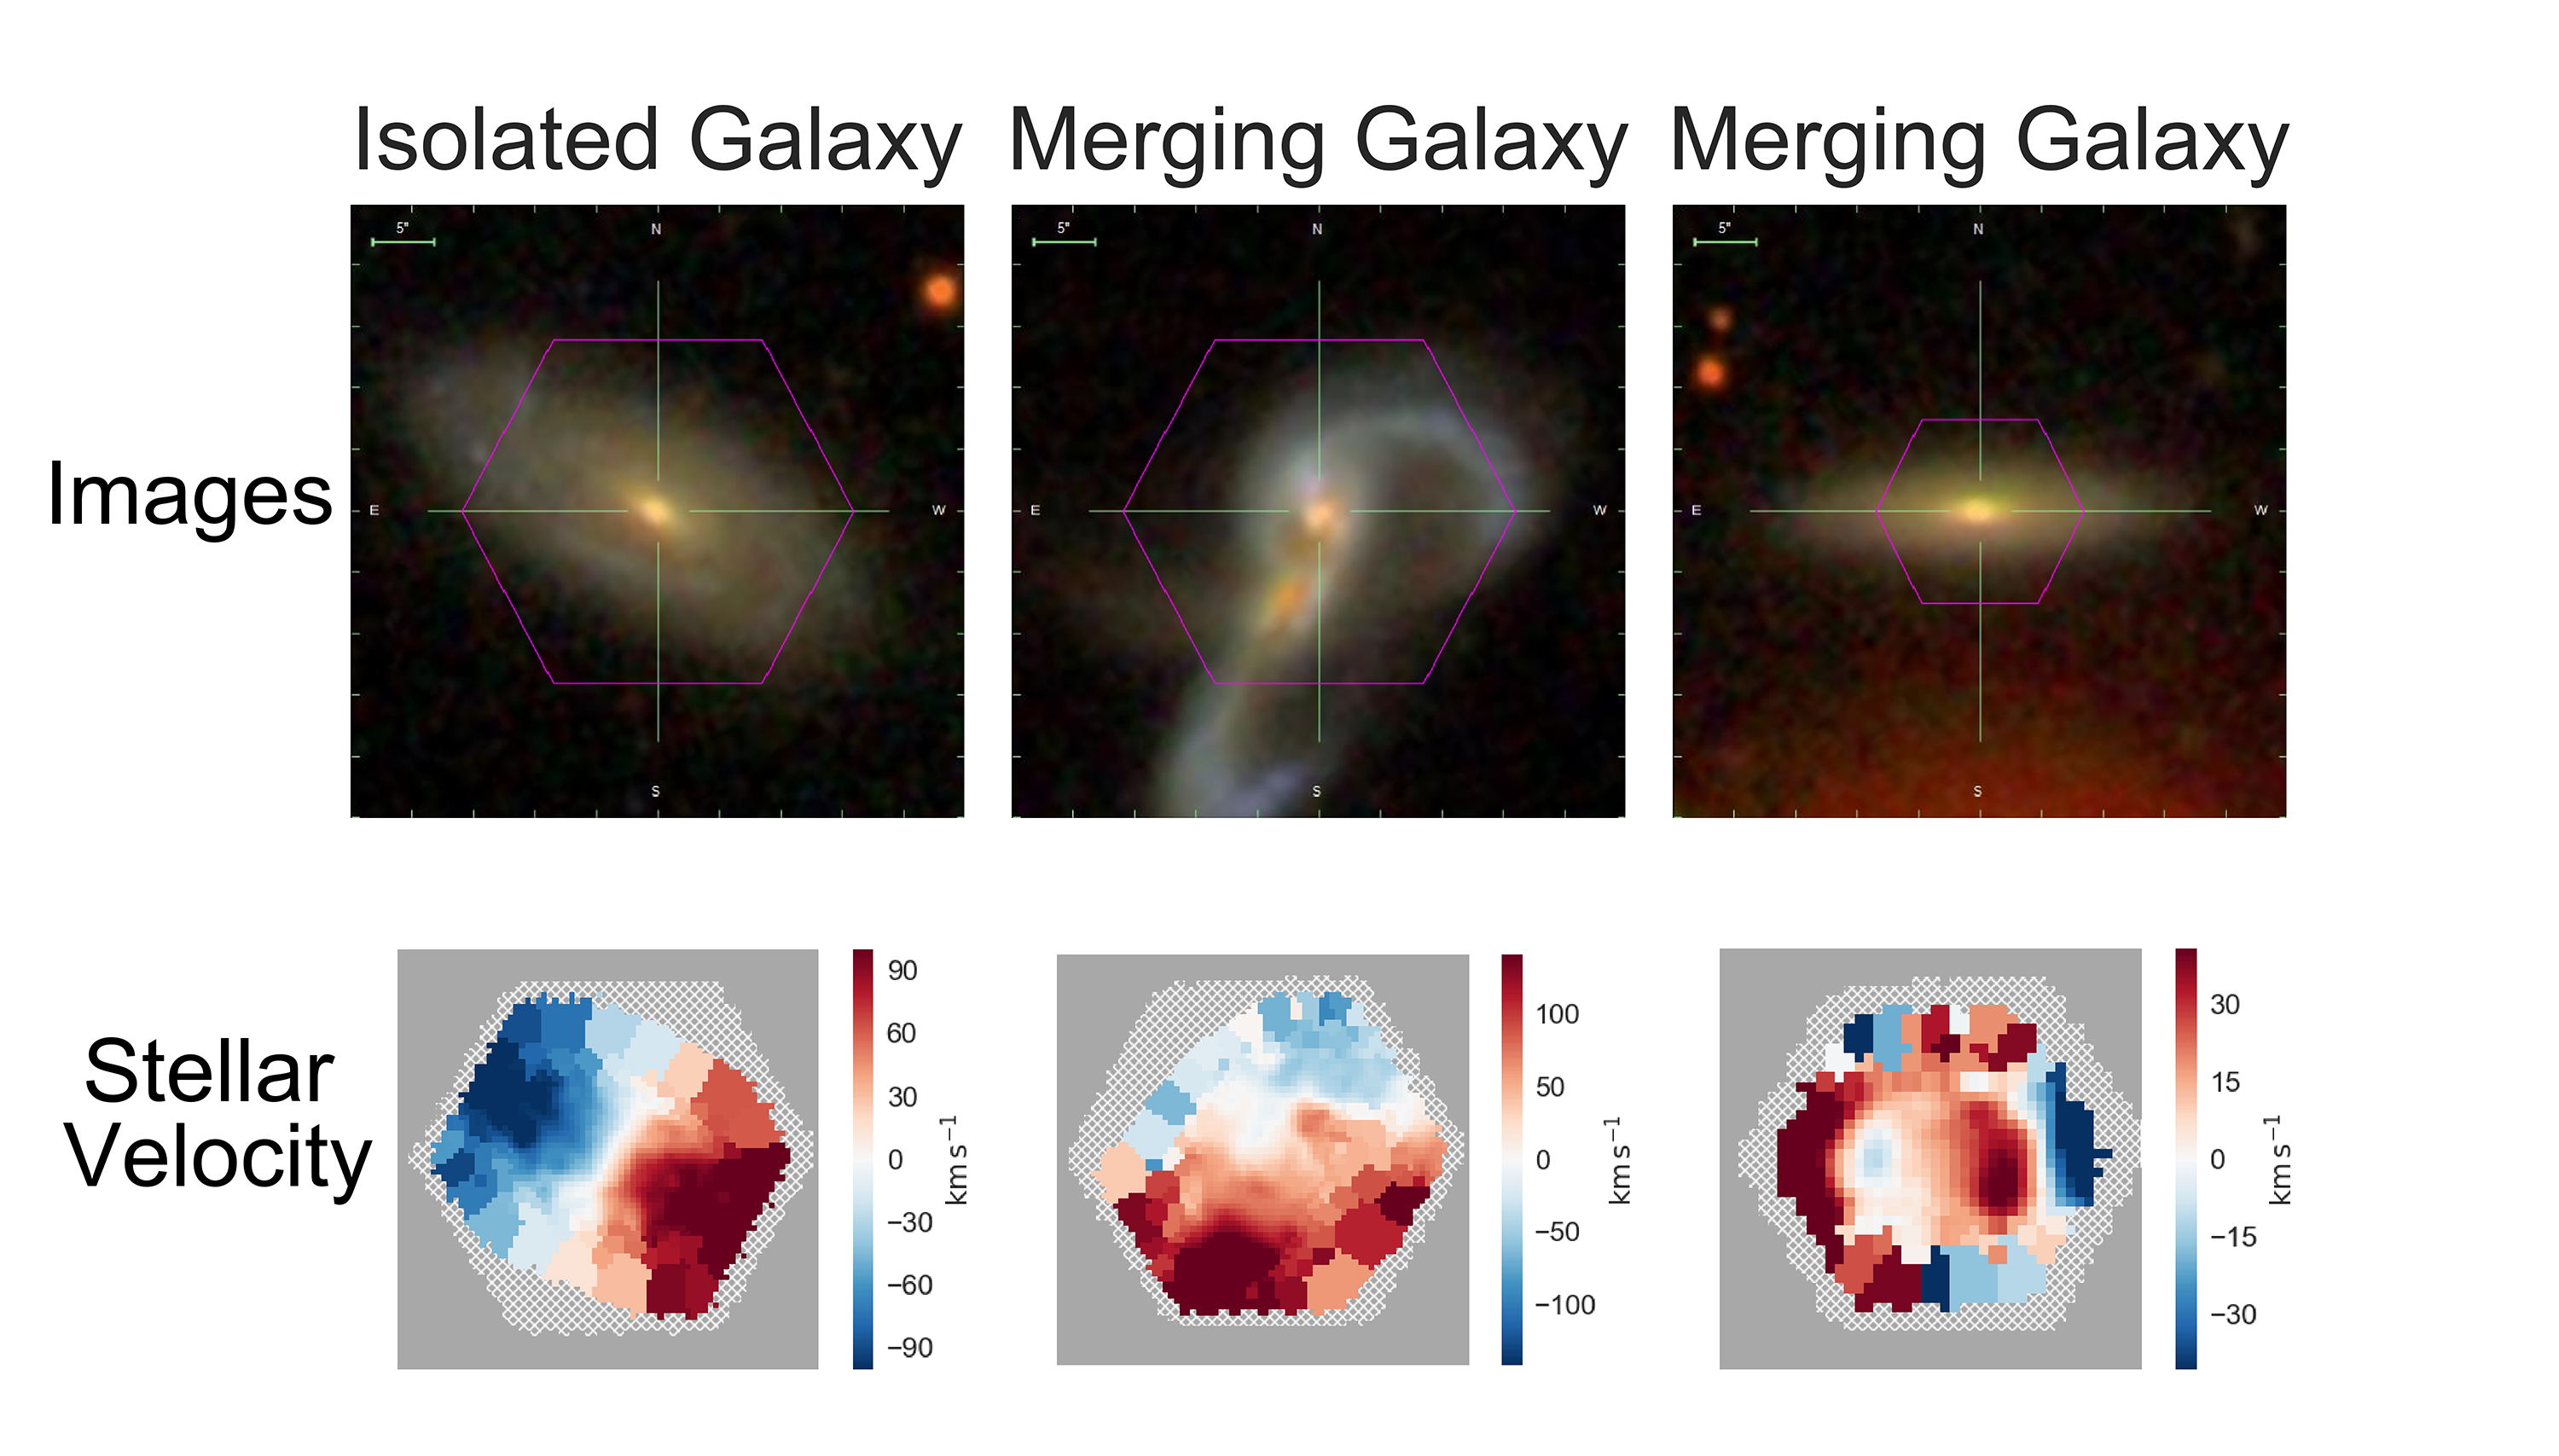
For example, MaNGA data have been used to make movies showing how the location where baby stars form moves around through spiral arms and other features in galaxies. Identifying which spectra came from which internal structure turns out to be tricky for computers, but with the help of citizen scientists, the MaNGA team have been able to do this, providing in this release maps showing where the structures are. And the kinematics of galaxies can reveal previously unknown galaxy interactions.
All of this MaNGA data has been made publicly available, for anyone to use, and the SDSS team have also created a specially designed tool dubbed “Marvin”, to help with data access. Marvin allows anyone to have a quick look at the data of each galaxy in an easy-to-use web interface, and is also available as a powerful set of python modules which allow anyone familiar with coding to access and visualize this complex data. Brian Cherinka, one of the lead developers of Marvin from Space Telescope Science Institute explains, “Marvin was designed specifically to access the complex MaNGA data and help researchers to avoid some of the common pitfalls in data visualization and access.”
Using MaNGA data and an early version of Marvin, scientists have already been discovering many new things about galaxies, with over 500 papers already published using the data. For example, MaNGA team members discovered a new class of galaxy, dubbed a red geyser, in which outflows from the supermassive black hole, revealed in MaNGA maps of ionized gas, are preventing new stars from forming. And to scientists’ surprise this happens even in the smallest galaxies.
Making MaNGA data both publicly available, and accessible will fuel science analyses for years to come, and puts the full power of MaNGA data into the hands of anyone who wants to use it. “It’s important to us that the data is not just available, but also accessible, so that anyone with an interest in galaxies can use MaNGA data for their research, education, or just for fun, can explore the cubes, spectra and maps to learn more these galaxies,” says Anne-Marie Weijmans of the University of St Andrews who led the part of the SDSS team in charge of data releases, “You don’t need to be a galaxy expert to work with MaNGA data: we have many tutorials on our website to get you started.”
The instrumentation innovations developed for MaNGA will reverberate into the future. The next generation of SDSS (SDSS-V) is expanding on the novel fiber-packing methods developed for MaNGA to construct even larger fiber bundles for its Local Volume Mapper program. This survey will also study gas and newly-formed stars, but in an environment much closer to home — our own Milky Way and its nearby smaller neighbors. By combining these data with what MaNGA has learned from thousands of more distant galaxies, astronomers will gain a much deeper understanding of how gas and stars coexist and interact throughout a galaxy’s lifetime.
MaNGA is a special kind of galaxy survey, which makes use of an innovative fiber-bundling technology to make detailed spectral maps of thousands of nearby galaxies. Spectra are graphs that show the amount of light given off by a galaxy at different wavelengths, much like a rainbow shows the amount of sunlight in various colors. Most previous galaxy surveys have either taken detailed images in a handful or just one colour, or measured just a single spectrum for an entire galaxy, but MaNGA works differently.
MaNGA made use of an innovative technique for bundling sets of fiber-optic cables into tightly-packed hexagonal arrays. With these bundles the team measured spectra at tens to hundreds of separate points in each galaxy, resulting in a “datacube” containing full spectroscopic information at each point. Making use of the famous SDSS plug plates, which allow multiple such bundles to be precisely aligned over target galaxies, MaNGA was able to observe seventeen galaxies at once. Similar surveys could only observe one galaxy at a time, making MaNGA almost twenty times faster than previous efforts — and six years of observing in this mode created the largest ever sample size of this kind.
Kevin Bundy, from the University of California at Santa Cruz and MaNGA’s PI, explains the motivation behind the MaNGA survey. “Observing such a large sample with MaNGA allows us to see how the detailed internal properties of galaxies vary in systematic ways with other factors, like galaxy mass, or where galaxies live in the Universe. These patterns are the key to understanding the physical processes that shape galaxy evolution.”
Researchers study each data cube to reveal its galaxy’s detailed chemical composition, find the ages, chemical makeup and motions of the stars inside it and map ionized interstellar gas. MaNGA has created over 30 different maps for each galaxy. These maps can be used for lots of different applications, for example, to estimate how many baby stars are being formed at every position in the galaxy, or to find the influence of the central supermassive black hole. MaNGA dramatically increases the number of galaxies with this detailed information, and a sister project, the MaNGA Stellar Library (MaStar), helped it along.
Galaxies are made of stars, so understanding them in detail requires a detailed library of spectra of stars. Alongside the complete release of MaNGA, SDSS scientists are pleased to announce the completion of MaStar, which made use of otherwise unused time on the MaNGA instrument to observe over 24,000 stars, enabling the scientists to more accurately extract information from the MaNGA data. Renbin Yan of the Chinese University of Hong Kong, and the leader of the MaStar project explained “MaStar is a special kind of library that includes spectra for as many types of stars as possible. Using these data, we can figure out how many of each type of star add up to make each of the many spectra from a MaNGA galaxy, and reconstruct the most accurate view ever of when and where stars formed in that galaxy’s cosmic history.”
For example, MaNGA data have been used to make movies showing how the location where baby stars form moves around through spiral arms and other features in galaxies. Identifying which spectra came from which internal structure turns out to be tricky for computers, but with the help of citizen scientists, the MaNGA team have been able to do this, providing in this release maps showing where the structures are. And the kinematics of galaxies can reveal previously unknown galaxy interactions.
All of this MaNGA data has been made publicly available, for anyone to use, and the SDSS team have also created a specially designed tool dubbed “Marvin”, to help with data access. Marvin allows anyone to have a quick look at the data of each galaxy in an easy-to-use web interface, and is also available as a powerful set of python modules which allow anyone familiar with coding to access and visualize this complex data. Brian Cherinka, one of the lead developers of Marvin from Space Telescope Science Institute explains, “Marvin was designed specifically to access the complex MaNGA data and help researchers to avoid some of the common pitfalls in data visualization and access.”
Using MaNGA data and an early version of Marvin, scientists have already been discovering many new things about galaxies, with over 500 papers already published using the data. For example, MaNGA team members discovered a new class of galaxy, dubbed a red geyser, in which outflows from the supermassive black hole, revealed in MaNGA maps of ionized gas, are preventing new stars from forming. And to scientists’ surprise this happens even in the smallest galaxies.
Making MaNGA data both publicly available, and accessible will fuel science analyses for years to come, and puts the full power of MaNGA data into the hands of anyone who wants to use it. “It’s important to us that the data is not just available, but also accessible, so that anyone with an interest in galaxies can use MaNGA data for their research, education, or just for fun, can explore the cubes, spectra and maps to learn more these galaxies,” says Anne-Marie Weijmans of the University of St Andrews who led the part of the SDSS team in charge of data releases, “You don’t need to be a galaxy expert to work with MaNGA data: we have many tutorials on our website to get you started.”
The instrumentation innovations developed for MaNGA will reverberate into the future. The next generation of SDSS (SDSS-V) is expanding on the novel fiber-packing methods developed for MaNGA to construct even larger fiber bundles for its Local Volume Mapper program. This survey will also study gas and newly-formed stars, but in an environment much closer to home — our own Milky Way and its nearby smaller neighbors. By combining these data with what MaNGA has learned from thousands of more distant galaxies, astronomers will gain a much deeper understanding of how gas and stars coexist and interact throughout a galaxy’s lifetime.
Contacts:
- Kevin Bundy, University of California Santa Cruz, 831-459-3539, kbundy@ucsc.edu
- Renbin YAN, Chinese University of Hong Kong, +852 3943 6362, rbyan@cuhk.edu.hk
- Brian Cherinka, Space Telescope Science Institute, 410-338-672, bcherinka@stsci.edu
- Karen Masters, SDSS-IV Spokesperson, Haverford College, 610-795-6066, klmasters@haverford.edu
- Twitter: @KarenLMasters / @SDSSurveys
- Jordan Raddick, SDSS-IV Press Officer, Johns Hopkins University, 443-570-7105, raddick@jhu.edu
Press Releases:
All prior SDSS press releases can be found in the press release archives of the various phases of the SDSS:
About the Sloan Digital Sky Survey
Funding for the Sloan Digital Sky Survey IV has been provided by the Alfred P. Sloan Foundation, the U.S. Department of Energy Office of Science, and the Participating Institutions. SDSS acknowledges support and resources from the Center for High-Performance Computing at the University of Utah.
The SDSS web site is www.sdss.org.
SDSS is managed by the Astrophysical Research Consortium for the Participating Institutions of the SDSS Collaboration including the Brazilian Participation Group, the Carnegie Institution for Science, Carnegie Mellon University, Center for Astrophysics | Harvard & Smithsonian (CfA), the Chilean Participation Group, the French Participation Group, Instituto de Astrofísica de Canarias, The Johns Hopkins University, Kavli Institute for the Physics and Mathematics of the Universe (IPMU) / University of Tokyo, the Korean Participation Group, Lawrence Berkeley National Laboratory, Leibniz Institut für Astrophysik Potsdam (AIP), Max-Planck-Institut für Astronomie (MPIA Heidelberg), Max-Planck-Institut für Astrophysik (MPA Garching), Max-Planck-Institut für Extraterrestrische Physik (MPE), National Astronomical Observatories of China, New Mexico State University, New York University, University of Notre Dame, Observatório Nacional / MCTI, The Ohio State University, Pennsylvania State University, Shanghai Astronomical Observatory, United Kingdom Participation Group, Universidad Nacional Autónoma de México, University of Arizona, University of Colorado Boulder, University of Oxford, University of Portsmouth, University of Utah, University of Virginia, University of Washington, University of Wisconsin, Vanderbilt University, and Yale University.
SDSS / Press Releases / Galaxies, Assemble!: MaNGA team releases largest-ever collection of 3-D maps of nearby galaxies