Wednesday, March 19, 2014

Herschell completes largest survey of cosmic dust in local Universe

Collage of galaxies in the Herschel Reference Survey at infrared/submillimetre wavelengths by Herschel (left) and at visible wavelengths from the Sloan Digital Sky Survey (SDSS, right). The Herschel image is coloured with blue representing cold dust and red representing warm dust; the SDSS image shows young stars in blue and old stars in red. Together, the observations plot young, dust-rich spiral/irregular galaxies in the top left, with giant dust-poor elliptical galaxies in the bottom right. Copyright: ESA/Herschel/HRS-SAG2 and HeViCS Key Programmes/Sloan Digital Sky Survey/ L. Cortese (Swinburne University)

Collage of galaxies included in the Herschel Reference Survey, the largest census of cosmic dust in the local Universe. The galaxies are presented in false-colour to highlight different dust temperatures, with blue and red representing colder and warmer regions respectively. The collage is presented with dust-rich, spiral and irregular galaxies in the top left, and giant, dust-poor elliptical galaxies in the bottom-right. The images were composed from PACS and SPIRE observations at 100, 160 and 250 microns. Copyright ESA/Herschel/HRS-SAG2 and HeViCS Key Programmes/L. Cortese (Swinburne University)
.
Collage of galaxies included in the Herschel Reference Survey as seen at visible wavelengths in images obtained by the Sloan Digital Sky Survey. The colour distribution highlights different stellar ages, with red and blue indicating older and younger stars, respectively. Copyright: Sloan Digital Sky Survey/L. Cortese (Swinburne University)

The largest census of dust in local galaxies has been completed using data from ESA’s Herschel space observatory, providing a huge legacy to the scientific community. 

Cosmic dust grains are a minor but fundamental ingredient in the recipe of gas and dust for creating stars and planets. But despite its importance, there is an incomplete picture of the dust properties in galaxies beyond our own Milky Way. 

Key questions include how the dust varies with the type of galaxy, and how it might affect our understanding of how galaxies evolve. 

Before concluding its observations in April 2013, Herschel provided the largest survey of cosmic dust, spanning a wide range of nearby galaxies located 50–80 million light-years from Earth. 

The catalogue contains 323 galaxies with varying star formation activity and different chemical compositions, observed by Herschel’s instruments across far-infrared and submillimetre wavelengths. 

A sample of these galaxies is displayed in a collage, arranged from dust-rich in the top left to dust-poor in the bottom right. 

The dust-rich galaxies are typically spiral or irregular, whereas the dust-poor ones are usually elliptical. Blue and red colours represent cooler and warmer regions of dust, respectively. 

Dust is gently heated across a range of temperatures by the combined light of all of the stars in each galaxy, with the warmest dust being concentrated in regions where stars are being born. 

For comparison, the galaxies are also shown in visible light images obtained by the Sloan Digital Sky Survey. 

Here, blue corresponds to young stars – hot, massive stars that burn through their fuel very quickly and are therefore short-lived. 

Conversely, red stars are older population – they are less massive and cooler, and therefore live for longer. 

The Herschel observations allow astronomers to determine how much light is emitted by the dust as a function of wavelength, providing a means to study the physical properties of the dust. 

For example, a galaxy forming stars at a faster rate should have more massive, hot stars in it, and thus the dust in the galaxy should also be warmer. In turn, that means that more of the light emitted by the dust should come out at shorter wavelengths. 

However, the data show greater variations than expected from one galaxy to another based on their star formation rates alone, implying that other properties, such as its chemical enrichment, also play an important role. 

By allowing astronomers to investigate these correlations and dependences, the survey provides a much-needed local benchmark for quantifying the role played by dust in galaxy evolution throughout the history of the Universe. 

The data will complement observations being made by other telescopes, such as the ground-based Atacama Large Millimeter Array in Chile, which will allow astronomers to look at dust in galaxies to the very edge of the observable Universe.

More information:

“PACS photometry of the Herschel Reference Survey – far-infrared/sub-millimeter colours as tracers of dust properties in nearby galaxies,” by L. Cortese et al., is published in the Monthly Notices of the Royal Astronomical Society, 18 March 2014.


For further information, please contact:
 
Markus Bauer


ESA Science and Robotic Exploration Communication Officer


Tel: +31 71 565 6799


Mob: +31 61 594 3954


Email:
markus.bauer@esa.int

Luca Cortese
Swinburne University of Technology, Australia
Email:
lcortese@swin.edu.su

Göran Pilbratt
ESA Herschel Project Scientist
Tel: +31 71 565 3621

Email:
gpilbratt@rssd.esa.int

Source: ESA/Herschel


Mercury’s Contraction Much Greater Than Thought

This image shows a long collection of ridges and scarps on the planet Mercury called a fold-and-thrust belt. The belt stretches over 336 miles (540 kilometers). The colors correspond to elevation—yellow-green is high and blue is low. Image courtesy NASA/Johns Hopkins University Applied Physics Laboratory/Carnegie Institution of Washington

Washington, D.C.—New global imaging and topographic data from MESSENGER* show that the innermost planet has contracted far more than previous estimates. The results are based on a global study of more than 5,900 geological landforms, such as curving cliff-like scarps and wrinkle ridges, that have resulted from the planet’s contraction as Mercury cooled. The findings, published online March 16, 2014, in Nature Geoscience, are key to understanding the planet’s thermal, tectonic, and volcanic history, and the structure of its unusually large metallic core.

Unlike Earth, with its numerous tectonic plates, Mercury has a single rigid, top rocky layer. Prior to the MESSENGER mission only about 45% of Mercury’s surface had been imaged by a spacecraft. Old estimates, based on this non-global coverage, suggested that the planet had contracted radially by about ½ to 2 miles (0.8 to 3 kilometers) substantially less than that indicated by models of the planet’s thermal history. Those models predicted a radial contraction of about 3 to 6 miles (5 to 10 kilometers) starting from the late heavy bombardment of the Solar System, which ended about 3.8 billion years ago.

The new results, which are based on the first comprehensive survey of the planet’s surface, show that Mercury contracted radially by as much as 4.4 miles (7 kilometers)—substantially more than the old estimates, but in agreement with the thermal models. Mercury’s modern radius is 1,516 miles (2,440 kilometers).

“These new results resolved a decades-old paradox between thermal history models and estimates of Mercury’s contraction,” remarked lead author of the study, Paul Byrne, a planetary geologist and MESSENGER visiting investigator at Carnegie’s Department of Terrestrial Magnetism. “Now the history of heat production and loss and global contraction are consistent. Interestingly, our findings are also reminiscent of now-obsolete models for how large-scale geological deformation occurred on Earth when the scientific community thought that the Earth only had one tectonic plate. Those models were developed to explain mountain building and tectonic activity in the nineteenth century, before plate tectonics theory.”

Byrne and his coauthors identified a much greater number and variety of geological structures on the planet than had been recognized in previous research. They identified 5,934 ridges and scarps attributed to global contraction, which ranged from 5 to 560 miles (9 to 900 kilometers) in length.

The researchers used two complementary techniques to estimate the contraction from their global survey of structures. Although the two estimates of radius change differed by 0.6 to 1 mile (1 to 1.6 kilometers), both were substantially greater than old estimates.

“I became interested in the thermal evolution of Mercury’s interior when the Mariner 10 spacecraft sent back images of the planet’s great scarps in 1974–75, but the thermal history models predicted much more global contraction than the geologists inferred from the scarps then observed, even correcting for the fact that Mariner 10 imaged less than half of Mercury’s surface,” noted Sean Solomon, principal investigator of the mission, former director of Carnegie’s Department of Terrestrial Magnetism, and current director of the Lamont-Doherty Earth Observatory at Columbia University. “This discrepancy between theory and observation, a major puzzle for four decades, has finally been resolved. It is wonderfully affirming to see that our theoretical understanding is at last matched by geological evidence.”


* MESSENGER (MErcury Surface, Space ENvironment, GEochemistry, and Ranging) is a NASA-sponsored scientific investigation of the planet Mercury and the first space mission designed to orbit the planet closest to the Sun. The MESSENGER spacecraft launched on August 3, 2004, and entered orbit about Mercury on March 18, 2011 (UTC), to begin its primary mission – a yearlong study of its target planet. MESSENGER’s first extended mission began on March 18, 2012, and ended one year later. MESSENGER is currently operating in its second extended mission. Dr. Sean C. Solomon, of the Lamont-Doherty Earth Observatory of Columbia University, leads the mission as Principal Investigator. The Johns Hopkins University Applied Physics Laboratory built and operates the MESSENGER spacecraft and manages this Discovery-class mission for NASA.

Authors on the paper are Paul Byrne, Carnegie and the Lunar and Planetary Institute; Christian Klimczak, Carnegie; A. M. Celâl Şengör, Eurasia Institute of Earth Sciences; Sean Solomon, Carnegie and Lamont-Doherty Earth Observatory; Thomas Watters, Smithsonian; and Steven Hauk, II, Case Western University.


Tuesday, March 18, 2014

First Direct Evidence of Cosmic Inflation

Gravitational waves from inflation generate a faint but distinctive twisting pattern in the polarization of the cosmic microwave background, known as a "curl" or B-mode pattern. For the density fluctuations that generate most of the polarization of the CMB, this part of the primordial pattern is exactly zero. Shown here is the actual B-mode pattern observed with the BICEP2 telescope, which is consistent with the pattern predicted for primordial gravitational waves. The line segments show the polarization strength and orientation at different spots on the sky. The red and blue shading shows the degree of clockwise and anti-clockwise twisting of this B-mode pattern. Credit: BICEP2 Collaboration. High Resolution (jpg) - Low Resolution (jpg)
Researchers from the BICEP2 collaboration today announced the first direct evidence for this cosmic inflation. Their data also represent the first images of gravitational waves, or ripples in space-time. These waves have been described as the "first tremors of the Big Bang." Finally, the data confirm a deep connection between quantum mechanics and general relativity.

"Detecting this signal is one of the most important goals in cosmology today. A lot of work by a lot of people has led up to this point," said John Kovac (Harvard-Smithsonian Center for Astrophysics), leader of the BICEP2 collaboration.

These groundbreaking results came from observations by the BICEP2 telescope of the cosmic microwave background -- a faint glow left over from the Big Bang. Tiny fluctuations in this afterglow provide clues to conditions in the early universe. For example, small differences in temperature across the sky show where parts of the universe were denser, eventually condensing into galaxies and galactic clusters.

Since the cosmic microwave background is a form of light, it exhibits all the properties of light, including polarization. On Earth, sunlight is scattered by the atmosphere and becomes polarized, which is why polarized sunglasses help reduce glare. In space, the cosmic microwave background was scattered by atoms and electrons and became polarized too.

"Our team hunted for a special type of polarization called 'B-modes,' which represents a twisting or 'curl' pattern in the polarized orientations of the ancient light," said co-leader Jamie Bock (Caltech/JPL).

Gravitational waves squeeze space as they travel, and this squeezing produces a distinct pattern in the cosmic microwave background. Gravitational waves have a "handedness," much like light waves, and can have left- and right-handed polarizations.

"The swirly B-mode pattern is a unique signature of gravitational waves because of their handedness. This is the first direct image of gravitational waves across the primordial sky," said co-leader Chao-Lin Kuo (Stanford/SLAC).

The team examined spatial scales on the sky spanning about one to five degrees (two to ten times the width of the full Moon). To do this, they traveled to the South Pole to take advantage of its cold, dry, stable air.
"The South Pole is the closest you can get to space and still be on the ground," said Kovac. "It's one of the driest and clearest locations on Earth, perfect for observing the faint microwaves from the Big Bang."

They were surprised to detect a B-mode polarization signal considerably stronger than many cosmologists expected. The team analyzed their data for more than three years in an effort to rule out any errors. They also considered whether dust in our galaxy could produce the observed pattern, but the data suggest this is highly unlikely.

"This has been like looking for a needle in a haystack, but instead we found a crowbar," said co-leader Clem Pryke (University of Minnesota).

When asked to comment on the implications of this discovery, Harvard theorist Avi Loeb said, "This work offers new insights into some of our most basic questions: Why do we exist? How did the universe begin? These results are not only a smoking gun for inflation, they also tell us when inflation took place and how powerful the process was."

BICEP2 is the second stage of a coordinated program, the BICEP and Keck Array experiments, which has a co-PI structure. The four PIs are John Kovac (Harvard), Clem Pryke (UMN), Jamie Bock (Caltech/JPL), and Chao-Lin Kuo (Stanford/SLAC). All have worked together on the present result, along with talented teams of students and scientists. Other major collaborating institutions for BICEP2 include the University of California at San Diego, the University of British Columbia, the National Institute of Standards and Technology, the University of Toronto, Cardiff University, Commissariat à l'Energie Atomique.

BICEP2 is funded by the National Science Foundation (NSF). NSF also runs the South Pole Station where BICEP2 and the other telescopes used in this work are located. The Keck Foundation also contributed major funding for the construction of the team’s telescopes. NASA, JPL, and the Moore Foundation generously supported the development of the ultra-sensitive detector arrays that made these measurements possible.
Technical details and journal papers can be found on the BICEP2 release website:  http://bicepkeck.org

Headquartered in Cambridge, Mass., the Harvard-Smithsonian Center for Astrophysics (CfA) is a joint collaboration between the Smithsonian Astrophysical Observatory and the Harvard College Observatory. CfA scientists, organized into six research divisions, study the origin, evolution and ultimate fate of the universe.

For more information, contact:

David A. Aguilar
Director of Public Affairs
Harvard-Smithsonian Center for Astrophysics
617-495-7462

daguilar@cfa.harvard.edu

Christine Pulliam
Public Affairs Specialist
Harvard-Smithsonian Center for Astrophysics
617-495-7463

cpulliam@cfa.harvard.edu


The Workings of an X-ray Binary Star

A schematic image of the X-ray binary source LMC X-3 (not to scale). The disk around the black hole (on the right) is heated by accretion of material falling from the star (at the left) onto the disk, while some X-ray emission from the disk then heats the companion star. Astronomers were able to explain this process by modeling the time delay between the infrared and X-ray flares. Steiner, et al. 

The bright X-ray source known as LMC X-3 resides in the Large Magellanic Cloud, the dwarf galaxy that is the Milky Way’s nearest neighbor. Two decades ago astronomers discovered that the source is actually a binary system with a normal star rapidly orbiting a nearby black hole (whose mass is about 2.3 solar-masses) in only 1.7 days. In X-ray binary systems like this one, material from the normal star falls onto a disk around the black hole, causing it to glow and emit radiation – at X-ray wavelengths from the inner portion of the disk closest to the black hole, and at infrared wavelengths from the outer portions of the disk. The emission typically varies in time, presumably because the infalling matter arrives in clumps or in an uneven stream. The infrared and X-ray emissions also vary from one another, and astronomers have long thought that modeling their behaviors might lead to an enhanced understanding of black hole accretion processes.

CfA astronomers James Steiner and Jeff McClintock, along with a team of five colleagues, analyzed a ten-year collection of optical, infrared and X-ray data on LMC X-3. They discovered from the relative timing of the flares as seen in the two bands that the X-ray emission events lagged the infrared emission by about two weeks, and were able to develop a model that can successfully explain the processes at work. They considered the radiation as coming from three locations: the star itself (normal starlight dominates the emission), the disk (it is heated by accretion and emits in both X-rays and infrared), and other hot material in the disk and/or the star (it is heated by X-rays from the hot inner disk).

The scientists are able to conclude that the infrared probably arises from a narrow annular region of the disk, a somewhat surprising result because it had been thought that infrared would come from a much wider area. They also derive a more precise orbital period for the binary (1.704805 days) and key parameters of the disk. The authors note, however, that their model has about thirty parameters; their proposed scenario is the one that best fits the whole set of data. The new work is an impressive success at understanding a complex and dramatic extragalactic black hole system.

Reference(s): 
"Modeling the Optical–X-ray Accretion Lag in LMC X-3: Insights into Black-Hole Accretion Physics," James F. Steiner, Jeffrey E. McClintock, Jerome A. Orosz, Michelle M. Buxton, Charles D. Bailyn, Ronald A. Remillard, and Erin Kara, ApJ 783, 101, 2014.


Monday, March 17, 2014

Hubble revisits the Monkey Head Nebula for 24th birthday snap


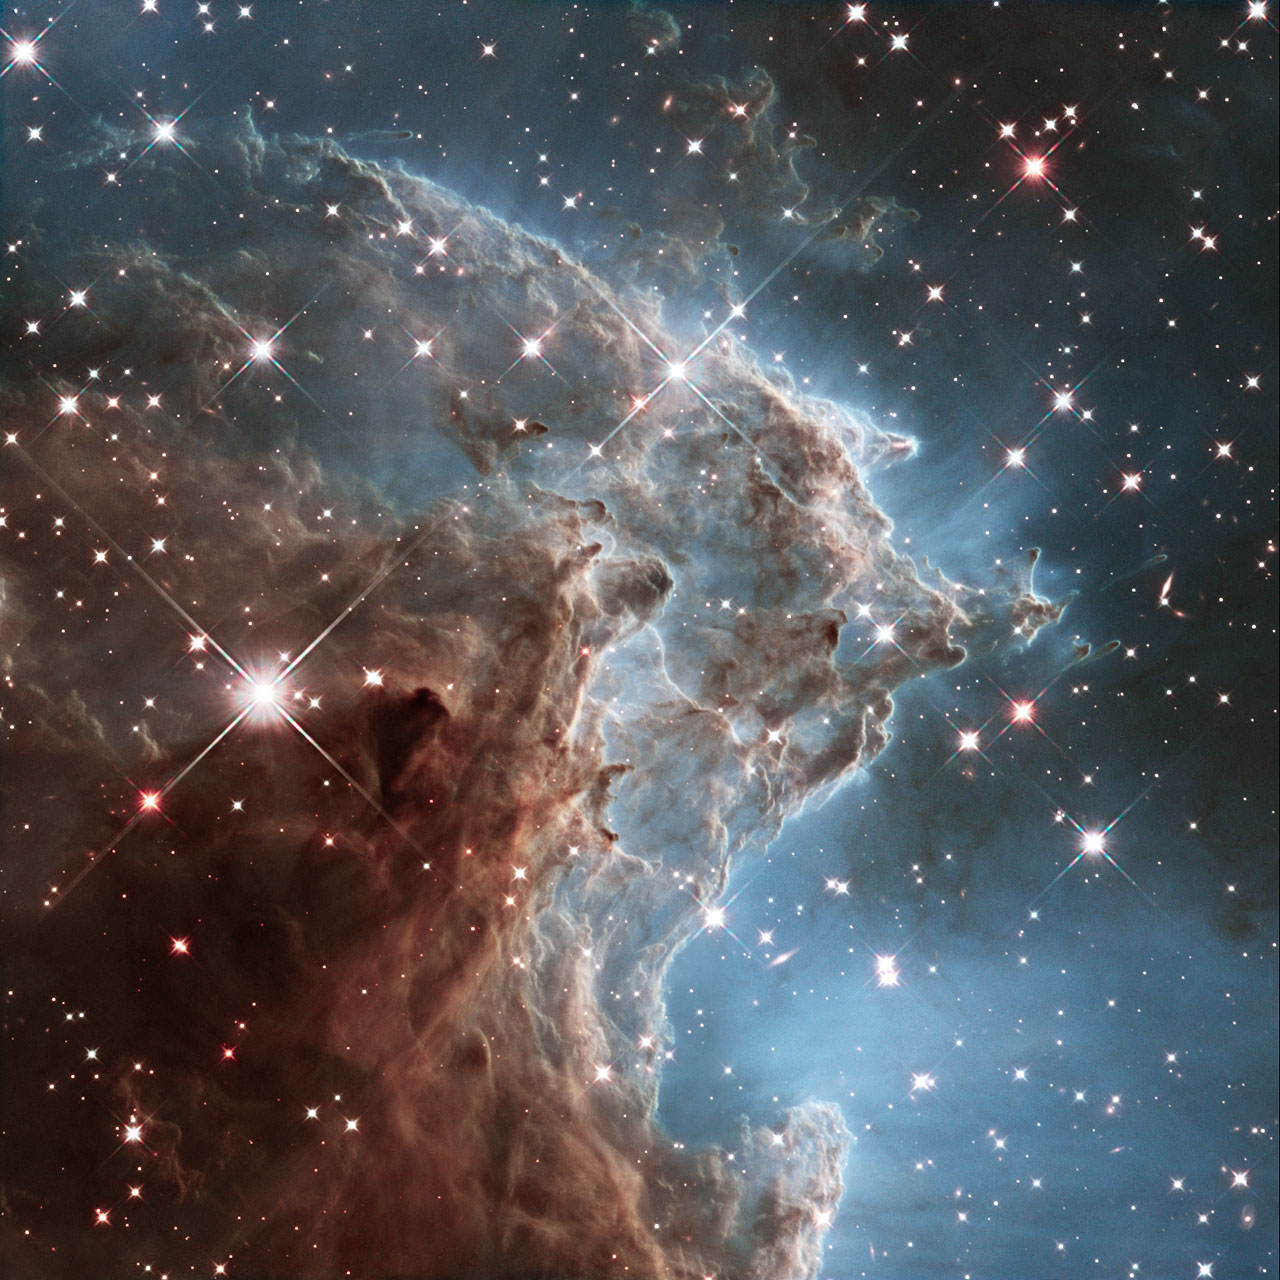
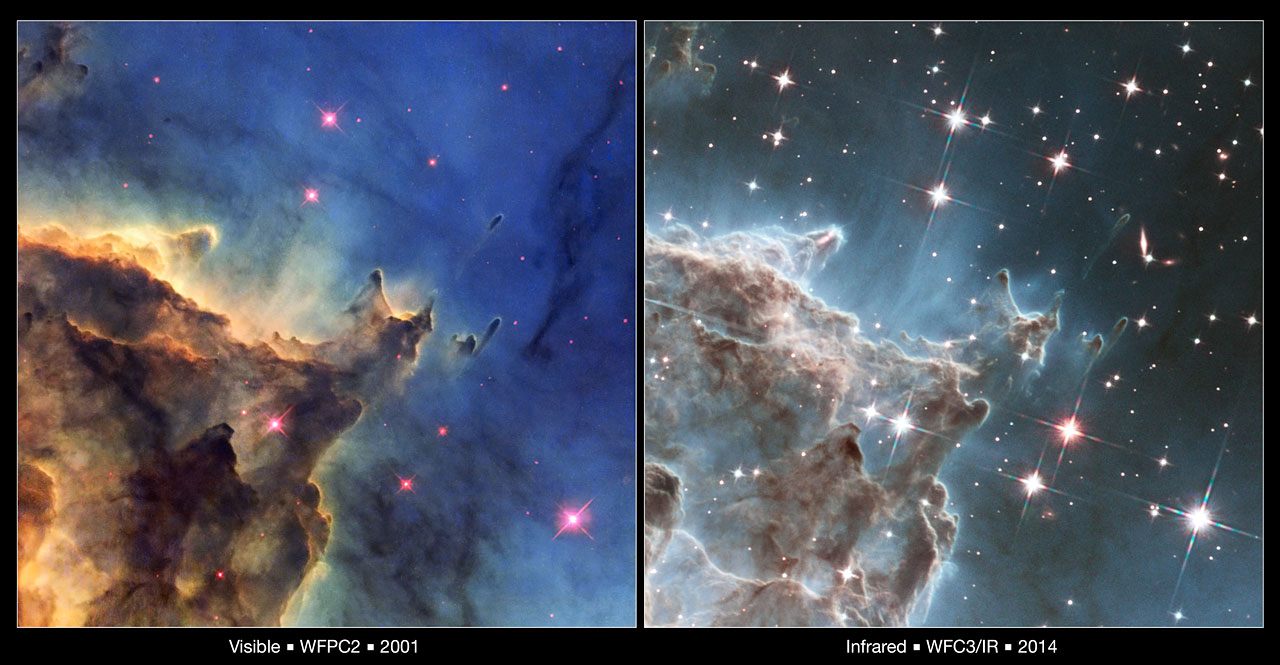
To celebrate its 24th year in orbit, the NASA/ESA Hubble Space Telescope has released this beautiful new image of part of NGC 2174, also known as the Monkey Head Nebula. NGC 2174 lies about 6400 light-years away in the constellation of Orion (The Hunter). Hubble previously viewed this part of the sky back in 2011 – the colourful region is filled with young stars embedded within bright wisps of cosmic gas and dust. This portion of the Monkey Head Nebula was imaged in the infrared using Hubble's Wide Field Camera 3. Copyright: NASA, ESA, and the Hubble Heritage Team (STScI/AURA)

Wide field image of NGC 2174 (ground-based view)
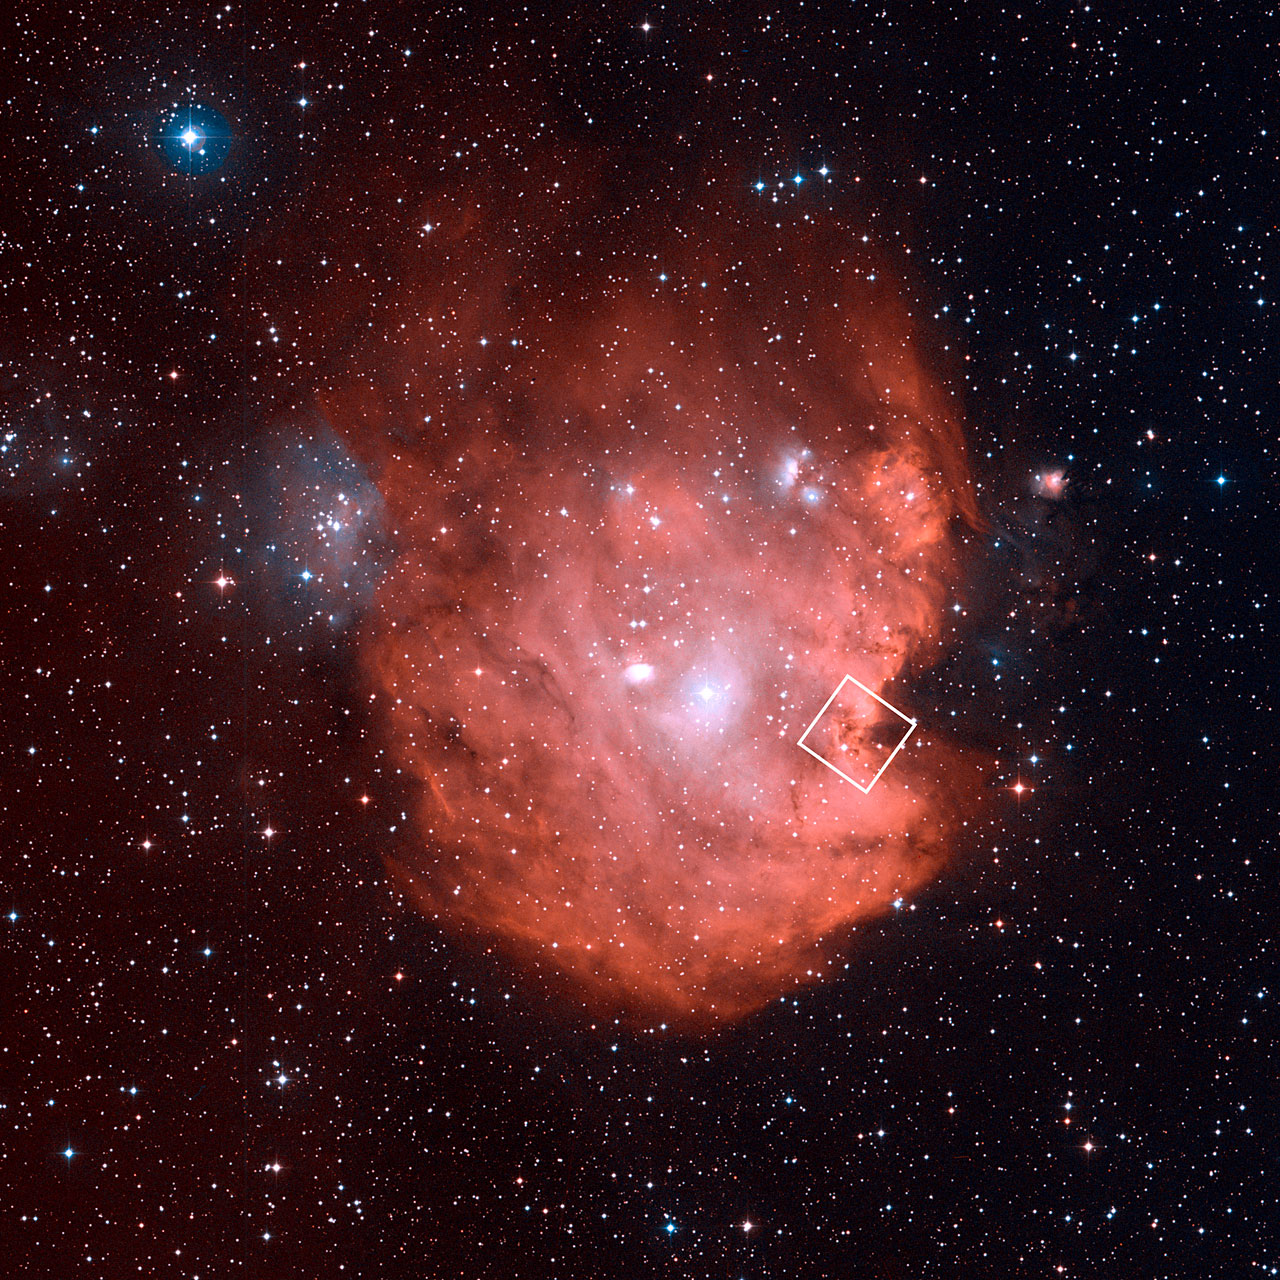
This image, a composite of red and blue exposures from the Digitized Sky Survey 2, shows the region of sky surrounding NGC 2174, more popularly known as the Monkey Head Nebula. To celebrate its 24th year observing Hubble revisited the Monkey Head Nebula and a brand new image was released of one of its breathtaking pillars. The small square near the centre of this image is where the pillar can be found. Copyright: NASA, ESA, Digitized Sky Survey (DSS), STScI/AURA, Palomar/Caltech

Visible and Infrared Comparison of NGC 2174
This image compares two views of the same detailed area in the star-forming nebula NGC 2174 from the Hubble Space Telescope. On the left is a visible-light image made by WFPC2 observations taken in 2001 – and released in 2011 – and on the right is an image made by the WFC3 infrared camera. Infrared light penetrates more dust and gas than visible light, allowing details to become visible. A jet of material from a newly forming star is visible in one of the pillars, just above and left of centre in the right-hand image. Several galaxies are seen in the infrared view, much more distant than the columns of dust and gas. Copyright: NASA and ESA.  Acknowledgment: NASA, ESA, and the Hubble Heritage Team (STScI/AURA), and J. Hester

Location of the Hubble IR Detail in NGC 2174
This image shows the region of NGC 2174, taken in infrared and released for Hubble's 24th birthday, in its wider context. On the left is a ground based image taken by an amateur astrophotographer of the star-forming nebula in visible light, with an outline showing the area of the detailed Hubble image. On the right is a mall detail of a star-forming column in the nebula, made by Hubble's WFC3 infrared camera.  Copyright: NASA and ESA.  Acknowledgment: NASA, ESA, and the Hubble Heritage Team (STScI/AURA), and R. Crisp  

To celebrate its 24th year in orbit, the NASA/ESA Hubble Space Telescope has released a beautiful new image of part of NGC 2174, also known as the Monkey Head Nebula. This colourful region is filled with young stars embedded within bright wisps of cosmic gas and dust. 

NGC 2174 lies about 6400 light-years away in the constellation of Orion (The Hunter). Hubble previously viewed this part of the sky back in 2001, creating a stunning image released in 2011, and the space telescope has now revisited the region to celebrate its 24th year of operation.

Nebulae are a favourite target for Hubble. Their colourful plumes of gas and fiery bright stars create ethereally beautiful pictures. Some of the most famous of Hubble's images have been of nebulae – for example, the telescope's 22nd and 23rd anniversary images of the Tarantula (heic1206) and Horsehead (heic1307) nebulae, and its festive 2012 image of planetary nebula NGC 5189 (heic1220).

The detail shown in this image lies within NGC 2174, a nebula which gets its more common name, the Monkey Head Nebula, from its curiously familiar shape when viewed in wide-field images.
The nebula is a violent stellar nursery, packed with the ingredients needed for star formation.

However, the recipe for cooking up new stars isn't very efficient and most of the ingredients are wasted as the cloud of gas and dust disperses. This process is accelerated by the presence of fiercely hot young stars which trigger high velocity winds that help to blow the gas outwards.

A vibrant palette of colours can be seen in this new image of NGC 2174. Dark brown and rust-coloured dust clouds billow outwards, framed against a background of bright blue gas. These striking hues are formed by combining several Hubble images taken with different coloured filters, to reveal a broad range of colours not normally visible to the human eye.

The icing on this cosmic birthday cake takes the form of young white and pink stars sprinkled amongst the glowing clouds, pushing away the dark stellar nurseries in which they formed. The key ingredient in NGC 2174 is hydrogen gas, which is ionised by the ultraviolet radiation emitted by the young stars. As a result, this region is also known as an HII region [1] – a large cloud of ionised gas.

This image marks 24 years of Hubble. This milestone will be further celebrated by a conference being held in Rome, Italy, in March of this year. The conference, entitled Science with the Hubble Space Telescope IV, will highlight and celebrate the scientific breakthroughs that Hubble has made over the last two decades and look into the future at the topics and key questions that will shape the field of astrophysics in the next decade.

This portion of the Monkey Head Nebula was imaged in the infrared using Hubble's Wide Field Camera 3. Hubble's earlier Wide Field Planetary Camera 2 image from 2011 inspired its choice as the telescope's 24th anniversary image. A processed version of the WFPC2 dataset was entered into the Hubble's Hidden Treasures image processing competition by Yurij Tukachev.

Notes
 
[1] An HI region (pronounced "H-one") contains a lot of neutral hydrogen, an HII (pronounced "H-two") lots of ionised hydrogen, and a H2 region molecular hydrogen.

Notes for editors:
 
The Hubble Space Telescope is a project of international cooperation between ESA and NASA.

Contacts

Georgia Bladon
ESA/Hubble, Public Information Officer
Garching bei München, Germany
Tel: +49-89-3200-6855
Email:
gbladon@partner.eso.org


‘Death Stars’ in Orion Blast Planets before They Even Form

This artist's concept shows two proplyds, or protostars, around a massive O-type star. The nearer proplyd is having its planet-forming dust and gas blasted away by the radiation from the star. The farther proplyd is able to retain its planet-making potential. Credit: NRAO/AUI/NSF; B. Saxton. Click to Download High-Resolution TIFF

Fly-in to the Orion Nebula where ALMA reveals massive stars blasting away the planet-forming dust and gas around young protoplanetary disks.

The Orion Nebula is home to hundreds of young stars and even younger protostars known as proplyds. Many of these nascent systems will go on to develop planets, while others will have their planet-forming dust and gas blasted away by the fierce ultraviolet radiation emitted by massive O-type stars that lurk nearby.

A team of astronomers from Canada and the United States has used the Atacama Large Millimeter/submillimeter Array (ALMA) to study the often deadly relationship between highly luminous O-type stars and nearby protostars in the Orion Nebula. Their data reveal that protostars within 0.1 light-years (about 600 billion miles) of an O-type star are doomed to have their cocoons of dust and gas stripped away in just a few millions years, much faster than planets are able to form.

"O-type stars, which are really monsters compared to our Sun, emit tremendous amounts of ultraviolet radiation and this can play havoc during the development of young planetary systems," remarked Rita Mann, an astronomer with the National Research Council of Canada in Victoria, and lead author on a paper in the Astrophysical Journal. "Using ALMA, we looked at dozens of embryonic stars with planet-forming potential and, for the first time, found clear indications where protoplanetary disks simply vanished under the intense glow of a neighboring massive star."

Many, if not all, Sun-like stars are born in crowded stellar nurseries similar to the Orion Nebula. Over the course of just a few million years, grains of dust and reservoirs of gas combine into larger, denser bodies. Left relatively undisturbed, these systems will eventually evolve into fully fledged star systems, with planets -- large and small -- and ultimately drift away to become part of the galactic stellar population.

Astronomers believe that massive yet short-lived stars in and around large interstellar clouds are essential for this ongoing process of star formation. At the end of their lives, massive stars explode as supernovas, seeding the surrounding area with dust and heavy elements that will get taken up in the next generation of stars. These explosions also provide the kick necessary to initiate a new round of star and planet formation. But while they still shine bright, these larger stars can be downright deadly to planets if an embryonic solar systems strays too close.

"Massive stars are hot and hundreds of times more luminous than our Sun," said James Di Francesco, also with the National Research Council of Canada. "Their energetic photons can quickly deplete a nearby protoplanetary disk by heating up its gas, breaking it up, and sweeping it away."

Earlier observations with the Hubble Space Telescope revealed striking images of proplyds in Orion. Many had taken on tear-drop shapes, with their dust and gas trailing away from a nearby massive star. These optical images, however, couldn't reveal anything about the amount of dust that was present or how the dust and gas concentrations changed in relation to massive stars.

The new ALMA observations detected these and other never-before-imaged proplyds, essentially doubling the number of protoplanetary disks discovered in that region. ALMA also could see past their surface appearance, peering deep inside to actually measure how much mass was in the proplyds.
Combining these studies with previous observations from the Submillimeter Array (SMA) in Hawaii, the researchers found that any protostar within the extreme-UV envelope of a massive star would have much of its disk of material destroyed in very short order. Proplyds in these close-in regions retained only a fraction (one half or less) of the mass necessary to create one Jupiter-size planet. Beyond the 0.1 light-year radius, in the far-UV dominated region, the researchers observed a wide range of disk masses containing anywhere for one to 80 times the mass of Jupiter. This is similar to the amount of dust found in low-mass star forming regions.

"Taken together, our investigations with ALMA suggest that extreme UV regions are not just inhospitable, but they’re downright hazardous for planet formation. With enough distance, however, it’s possible to find a much more congenial environment," said Mann. "This work is really the tip of the iceberg of what will come out of ALMA; we hope to eventually learn how common solar systems like our own are."

Other researchers involved in this project include Doug Johnstone, National Research Council of Canada; Sean M. Andrews, Harvard-Smithsonian Center for Astrophysics; Jonathan P. Williams, University of Hawaii; John Bally, University of Colorado; Luca Ricci, California Institute of Technology; A. Meredith Hughes, Wesleyan University, and Brenda C. Matthews, National Research Council of Canada.

ALMA, an international astronomy facility, is a partnership of Europe, North America and East Asia in cooperation with the Republic of Chile. ALMA construction and operations are led on behalf of Europe by ESO, on behalf of North America by the National Radio Astronomy Observatory (NRAO), and on behalf of East Asia by the National Astronomical Observatory of Japan (NAOJ). The Joint ALMA Observatory (JAO) provides the unified leadership and management of the construction, commissioning and operation of ALMA.

Contact: 

Charles Blue 
Email: cblue@nrao.edu
(434) 296-0314

Friday, March 14, 2014

Mid-Level Solar Flare Seen by NASA's SDO

NASA's Solar Dynamics Observatory captures images of the sun in many wavelengths of light at the same time, each of which is typically colorized in a different color. Each wavelength shows different aspects of the same event, as seen in these three images of a solar flare on March 12, 2014.Image Credit: NASA/SDO/Goddard Space Flight Center

A solar flare erupts on the far right side of the sun, in this image captured by NASA's Solar Dynamics Observatory. The flare peaked at 6:34 p.m. EDT on March 12, 2014. Image Credit: NASA/SDO/Goddard Space Flight Center

The sun emitted a mid-level solar flare, peaking at 6:34 p.m. EDT on March 12, 2014, and NASA's Solar Dynamics Observatory, or SDO, captured an image of it. Solar flares are powerful bursts of radiation. Harmful radiation from a flare cannot pass through Earth's atmosphere to physically affect humans on the ground, however -- when intense enough -- they can disturb the atmosphere in the layer where GPS and communications signals travel.

To see how this event may impact Earth, please visit NOAA's Space Weather Prediction Center at http://spaceweather.gov, the U.S. government's official source for space weather forecasts, alerts, watches and warnings.

This flare is classified as an M9.3 flare, just slightly weaker than the most intense flares, which are labeled X-class. The letters denote broad categories of strength, while the numbers provide more information. An M2 is twice as intense as an M1, an M3 is three times as intense, etc.

This M9.3 flare was emitted by an active region — a magnetically strong and complex region on the sun's surface — labeled AR 11996.  

Updates will be provided as they are available on the flare and whether there was an associated coronal mass ejection, or CME, another solar phenomenon that can send solar particles into space and affect electronic systems in satellites and on Earth. 

Related Links

Karen C. Fox
NASA's Goddard Space Flight Center, Greenbelt, Md.


AFGL 4104 or Roberts 22
Credit: NASA, ESA, and R. Sahai (Jet Propulsion Laboratory)

They say the flap of a butterfly's wings can set off a tornado on the other side of the world. But what happens when a butterfly flaps its wings in the depths of space?

This cosmic butterfly is a nebula known as AFGL 4104, or Roberts 22. Caused by a star that is nearing the end of its life and has shrugged off its outer layers, the nebula emerges as a cosmic chrysalis to produce this striking sight. Studies of the lobes of Roberts 22 have shown an amazingly complex structure, with countless intersecting loops and filaments.

A butterfly's life span is counted in weeks; although on a much longer timescale, this stage of life for Roberts 22 is also transient. It is currently a preplanetary nebula, a short-lived phase that begins once a dying star has pushed much of the material in its outer layers into space, and ends once this stellar remnant becomes hot enough to ionise the surrounding gas clouds and make them glow. About 400 years ago, the star at the centre of Roberts 22 shed its outer shells, which raced outwards to form this butterfly. The central star will soon be hot enough to ionise the surrounding gas, and it will evolve into a fully fledged planetary nebula.

Information about the nature, age, and structure of Roberts 22 was presented in a paper using Hubble data back in 1999, published in The Astronomical Journal.


Thursday, March 13, 2014

Some galaxies in the early universe grew up quickly


Pasadena, CA- Some galaxies grew up in a hurry. Most of the galaxies that have been observed from the early days of the universe were young and actively forming stars. Now, an international team of astronomers, including Carnegie’s Eric Persson and Andy Monson, have discovered galaxies that were already mature and massive in the early days. Fifteen mature galaxies were found at a record-breaking average distance of 12 billion light years, when the universe was just 1.6 billion years old. Their existence at such an early time raises new questions about what forced them to grow up so quickly. The finding is published by The Astrophysical Journal Letters.

Today the universe is filled with galaxies that have largely stopped forming stars, a sign of galactic maturity. But in the distant past, galaxies were still actively growing by consuming gas and turning it into stars. This means that mature galaxies should have been almost non-existent when the universe was still young.

Together with lead author Caroline Straatman and principal investigator Ivo Labbe, both of Leiden University, the astronomers used deep images at near-infrared wavelengths to search for galaxies in the early universe with red colors. The characteristic red colors indicate the presence of old stars and a lack of active star formation. The galaxies are barely detectable at visual wavelengths and are easily overlooked. But in the new near-infrared light images they are easily measured, from which it can be inferred that they already contained as many as 100 billion stars on average per galaxy.

The mature galaxies have masses similar to that of the Milky Way, which still forms new stars at a slow rate. The newly discovered galaxies must have formed very rapidly in roughly 1 billion years, with explosive rates of star-formation. The rate of star formation must have been several hundred times larger than observed in the Milky Way today.

The finding raises new questions about how these galaxies formed so rapidly and why they stopped forming stars so early. It is an enigma that these galaxies seem to come out of nowhere. Another big question is what caused the galaxies to mature at such a young age and if some dramatic event might have caused premature aging.

The galaxies were discovered after 40 nights of observing with the FourStar camera on the Magellan Baade Telescope at Carnegie’s Las Campanas Observatory in Chile and combined with data from Hubble’s Cosmic Assembly Near-infrared Deep Extragalactic Legacy Survey and the Great Observatories Origins Deep Survey. Using special filters to produce images that are sensitive to narrow slices of the near-infrared spectrum, the team was able to measure accurate distances to thousands of distant galaxies at a time, providing a 3-D map of the early universe.

Caption: A Hubble Space Telescope color composite image of the astronomical field Chandra Deep Field South, with two of the 15 mature galaxies. They exhibit the typical red colors of mature galaxies. The other galaxies in the image are much closer.  A larger version is available here. 

*****************************

This research was supported in part by the George P. and Cynthia Woods Mitchell Institute for Fundamental Physics and Astronomy; NSF AST-1009707; ERC HIGHZ #227749; and NL-NWO Spinoza. Australian access to the Magellan Telescopes was supported through the NCRIS of the Australian Federal Government. This work is based on observations made with Herschel, an ESA Cornerstone Mission with significant participation by NASA, through an award issued by JPL/Caltech.


Star Formation in Luminous, Colliding Galaxies

The interacting galaxies Messier 51A and B as seen in the infrared. Two new papers have combined computer simulations with multi-band observations from the Herschel and Spitzer space telescopes and other datasets, to study how luminosity, star formation, dust heating, and other effects evolve during a galaxy collision. NASA; L. Lan. Large Image

Nearly thirty years ago the Infrared Astronomy Satellite discovered that the universe contained many tremendously luminous galaxies, some more than a thousand times brighter than our own Milky Way, but which are practically invisible at optical wavelengths. They are powered by bursts of star formation buried deep within clouds of dust and gas; the dust absorbs the optical light while radiating at infrared wavelengths.

Astronomers suspect that in many cases the hyperactivity was triggered by a collisional encounter that facilitated the collapse of interstellar gas into new stars. Collisions between galaxies are common. Indeed, most galaxies have probably been involved in one or more encounters during their lifetimes, making these interactions an important phase in galaxy evolution and the formation of stars in the universe. The Milky Way, for example, is bound by gravity to the Andromeda galaxy and is approaching it at a speed of about 50 kilometers per second; we are expected to meet in another billion years or so. In the local universe, such encounters can be easily identified by the visible morphological distortions they produce such as tidal tails sweeping out from the galactic discs. But not all infrared luminous galaxies show such distortions; moreover, luminous galaxies in the more distant cosmos are too remote to detect these spatial signatures (at least with current telescopes). Astronomers are therefore working to understand when and how collisions stimulate star formation, whether that star formation resembles conventional star formation or differs (perhaps by making more massive stars, for example), and to determine if some alternative to visual morphology can also quantify these effects.

CfA astronomers Lauranne Lanz, Andreas Zezas, Howard Smith, Matt Ashby, Giovanni Fazio, Lars Hernquist, and Rafael Martinez-Galarza, together with their colleagues, have combined new multi-wavelength observations and computer simulations of interacting galaxies to study what is going on. They place particular emphasis on far infrared results from the Herschel Space Telescope which for the first time have enabled a detailed examination of the conditions of warm and cold dust in these objects. The galaxies they examine are from a sample that includes all stages of interaction, from early stages when disruption has only just began to near final stages when the effects of the collision are prominent.

The scientists present their conclusions, the first such systematic comparisons between interacting galaxy observations and simulations, in two new papers. The first examines the effectiveness of the simulations, which after all can be no more accurate than the physics that has been included. The conclusion is that the simulations are quite good, at least with respect to the broad spectrum of an interaction and its evolution in time. The team also notes that the shape of the spectrum alone is generally insufficient to specify precisely the interaction stage, implying that other measurements will be needed to constrain the evolutionary stages of distant galaxies.

The second paper critiques a common method used for estimating the star formation rate in galaxies, namely, relating it simply to the luminosity (the idea being that more luminosity implies more star formation). The authors conclude from the simulations that during a galaxy’s post-merger evolution its infrared luminosity may be dominated by contributions from older stars rather than new ones, a feature that conventional models do not accurately account for. Thus, the standard method typically over-estimates the rate of star birth, sometimes by a factor of as much as one hundred. Future planned work will propose alternative methods, as well as account more precisely for luminosity contributions from a supermassive black hole in the nucleus.

References: 
"Simulated Galaxy Interactions as Probes of Merger Spectral Energy Distributions," Lauranne Lanz, Christopher C. Hayward, Andreas Zezas, Howard A. Smith, Matthew L. N. Ashby, Nicola Brassington, Giovanni G. Fazio, Lars Hernquist, ApJ 2014 (in press)

"The Total Infrared Luminosity May Significantly Overestimate the Star Formation Rate of Recently Quenched Galaxies,” Christopher C. Hayward, Lauranne Lanz, Matthew L. N. Ashby, Giovanni Fazio,Lars Hernquist, Juan Rafael Martınez-Galarza, Kai Noeske, Howard A. Smith, Stijn Wuyts and Andreas Zezas, MNRAS 2014 (in press)


Wednesday, March 12, 2014

VLT Spots Largest Yellow Hypergiant Star

The field around yellow hypergiant star HR 5171

Artist’s impression of the yellow hypergiant star HR 5171

The yellow hypergiant star HR 5171 in the constellation of Centaurus


Videos

Artist’s impression of the yellow hypergiant star HR 5171

Zooming in on the yellow hypergiant star HR 5171


 Mix of new and old observations reveals exotic binary system

ESO’s Very Large Telescope Interferometer has revealed the largest yellow star — and one of the ten largest stars found so far. This hypergiant has been found to measure more than 1300 times the diameter of the Sun, and to be part of a double star system, with the second component so close that it is in contact with the main star. Observations spanning over sixty years, some from amateur observers, also indicate that this rare and remarkable object is changing very rapidly and has been caught during a very brief phase of its life.

Using ESO’s Very Large Telescope Interferometer (VLTI), Olivier Chesneau (Observatoire de la Côte d’Azur, Nice, France) and an international team of collaborators have found that the yellow hypergiant star HR 5171 A [1] is absolutely huge — 1300 times the diameter of the Sun and much bigger than was expected [2]. This makes it the largest yellow star known. It is also in the top ten of the largest stars known — 50% larger than the famous red supergiant Betelgeuse — and about one million times brighter than the Sun.

The new observations also showed that this star has a very close binary partner, which was a real surprise,” says Chesneau. “The two stars are so close that they touch and the whole system resembles a gigantic peanut.

The astronomers made use of a technique called interferometry to combine the light collected from multiple individual telescopes, effectively creating a giant telescope up to 140 metres in size. The new results prompted the team to thoroughly investigate older observations of the star spanning more than sixty years, to see how it had behaved in the past [3].

Yellow hypergiants are very rare, with only a dozen or so known in our galaxy — the best-known example being Rho Cassiopeiae. They are among the biggest and brightest stars known and are at a stage of their lives when they are unstable and changing rapidly. Due to this instability, yellow hypergiants also expel material outwards, forming a large, extended atmosphere around the star.

Despite its great distance of nearly 12 000 light-years from Earth, the object can just about be seen with the naked eye [4] by the keen-sighted. HR 5171 A has been found to be getting bigger over the last 40 years, cooling as it grows, and its evolution has now been caught in action. Only a few stars are caught in this very brief phase, where they undergo a dramatic change in temperature as they rapidly evolve.  

By analysing data on the star’s varying brightness, using observations from other observatories, the astronomers confirmed the object to be an eclipsing binary system where the smaller component passes in front and behind the larger one as it orbits. In this case HR 5171 A is orbited by its companion star every 1300 days. The smaller companion is only slightly hotter than HR 5171 A’s surface temperature of 5000 degrees Celsius.

Chesneau concludes “The companion we have found is very significant as it can have an influence on the fate of HR 5171 A, for example, stripping off its outer layers and modifying its evolution.

This new discovery highlights the importance of studying these huge and short-lived yellow hypergiants, and could provide a means of understanding the evolutionary processes of massive stars in general.


Notes


[1] The star is also known as V766 Cen, HD 119796 and HIP 67261.

[2] Comparable objects seem to all be red supergiants which reach 1000–1500 times the radius of the Sun and have initial masses not exceeding 20–25 Solar masses. The radius of a yellow supergiant was expected to be 400–700 times that of the Sun.

[3] Spectral data were obtained using the Anglo–Australian Telescope with the University College London Echelle Spectrograph (UCLES), at the South African Astronomical Observatory (SAAO), with PUCHEROS, from the Pontificia Universidad de Chile (PUC) and through coronagraphic observations with the Near-Infrared Coronagraphic Imager (NICI) on the Gemini South telescope. Archival photometric datasets examined include infrared photometry from the South African Astronomical Observatory spanning the time frame from 1975 to 2013 and other datasets from 1983 to 2002, including some amateur observations. The agreement of professional results with those from amateur astronomer Sebastian Otero (2000–2013) is considered by the authors to be “excellent”, and “illustrates the quality of these amateur observations”.

[4] The visual magnitude of HR 5171 A is seen to vary between 6.10 and 7.30. It and can be viewed in the constellation of Centaurus (The Centaur).


More information


This research was presented in a paper “The yellow hypergiant HR 5171 A: Resolving a massive interacting binary in the common envelope phase”, by Chesneau et al., to appear in the journal Astronomy & Astrophysics.


The team is composed of O. Chesneau (Laboratoire Lagrange, Univ. Nice Sophia-Antipolis, CNRS, Observatoire de la Côte d’Azur, Nice, France [Lagrange]), A. Meilland (Lagrange), E. Chapellier (Lagrange), F. Millour (Lagrange), A.M. Van Genderen (Leiden Observatory, Leiden, The Netherlands), Y. Nazé (Le Fonds de la Recherche Scientifique, Liège, Belgium), N. Smith (Steward Observatory, Tucson, USA), A. Spang (Lagrange), J.V. Smoker (ESO, Santiago, Chile), L. Dessart (Aix Marseille Université, CNRS, Laboratoire d’Astrophysique de Marseille, Marseille, France), S. Kanaan (Instituto de Física y Astronomía, Universidad de Valparaíso, Chile [IFA]), Ph. Bendjoya (Lagrange), M.W. Feast (South African Astronomical Observatory, South Africa [SAAO]), J.H. Groh (Geneva Observatory, Geneva, Switzerland), A. Lobel (Royal Observatory of Belgium, Brussels, Belgium), N. Nardetto (Lagrange), S. Otero (American Association of Variable Star Observers, Cambridge, MA, USA), R.D. Oudmaijer (School of Physics & Astronomy, University of Leeds, UK), A.G. Tekola (SAAO and Las Cumbres Observatory Global Telescope Network, Goleta, CA, USA), P.A. Whitelock (SAAO), C. Arcos (IFA), M. Curé (IFA) and L. Vanzi (Department of Electrical Engineering and Center of Astro Engineering, Pontificia Universidad Catolica de Chile, Santiago, Chile).


ESO is the foremost intergovernmental astronomy organisation in Europe and the world’s most productive ground-based astronomical observatory by far. It is supported by 15 countries: Austria, Belgium, Brazil, the Czech Republic, Denmark, France, Finland, Germany, Italy, the Netherlands, Portugal, Spain, Sweden, Switzerland and the United Kingdom. ESO carries out an ambitious programme focused on the design, construction and operation of powerful ground-based observing facilities enabling astronomers to make important scientific discoveries. ESO also plays a leading role in promoting and organising cooperation in astronomical research. ESO operates three unique world-class observing sites in Chile: La Silla, Paranal and Chajnantor. At Paranal, ESO operates the Very Large Telescope, the world’s most advanced visible-light astronomical observatory and two survey telescopes. VISTA works in the infrared and is the world’s largest survey telescope and the VLT Survey Telescope is the largest telescope designed to exclusively survey the skies in visible light. ESO is the European partner of a revolutionary astronomical telescope ALMA, the largest astronomical project in existence. ESO is currently planning the 39-metre European Extremely Large optical/near-infrared Telescope, the E-ELT, which will become “the world’s biggest eye on the sky”.


Links


Contacts


Olivier Chesneau
Laboratoire Lagrange / Univ. Nice Sophia-Antipolis, CNRS - Observatoire de la Côte d’Azur
Nice, France
Tel: +33 (0)4 92 00 19 79
Email:
olivier.chesneau@oca.eu

Richard Hook
ESO, Public Information Officer
Garching bei München, Germany
Tel: +49 89 3200 6655
Cell: +49 151 1537 3591
Email:
rhook@eso.org


Source: ESO


An observational and theoretical view of the atomic gas distribution in galaxies

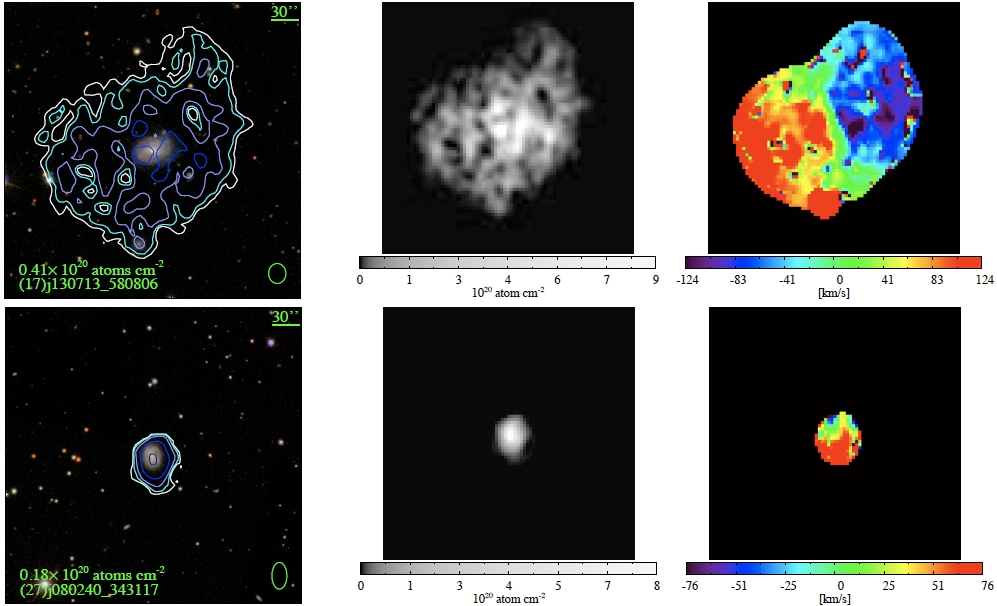
Fig. 1: The top and bottom rows show two galaxies with very different gas disk morphologies. From left to right: the column density contours for neutral hydrogen overlaid on optical images from the Sloan Digital Sky Survey, the neutral hydrogen itself, and the velocity maps of the neutral hydrogen.

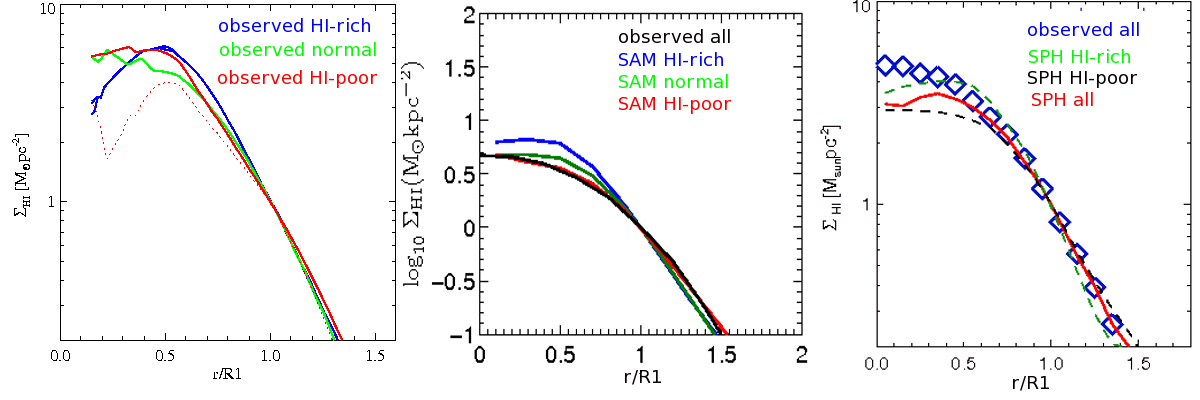
Fig. 2: The median radial profiles of different galaxies (blue: gas rich, green: normal, red: gas poor). For all galaxies, the radius has been scaled to R1, where the gas surface density reaches 1 solar mass / square parsec. The observed profiles in the left plot are compared to results from semi- analytical models (SAM, middle) and results from smoothed particle hydrodynamical simulations (SPH, right). 

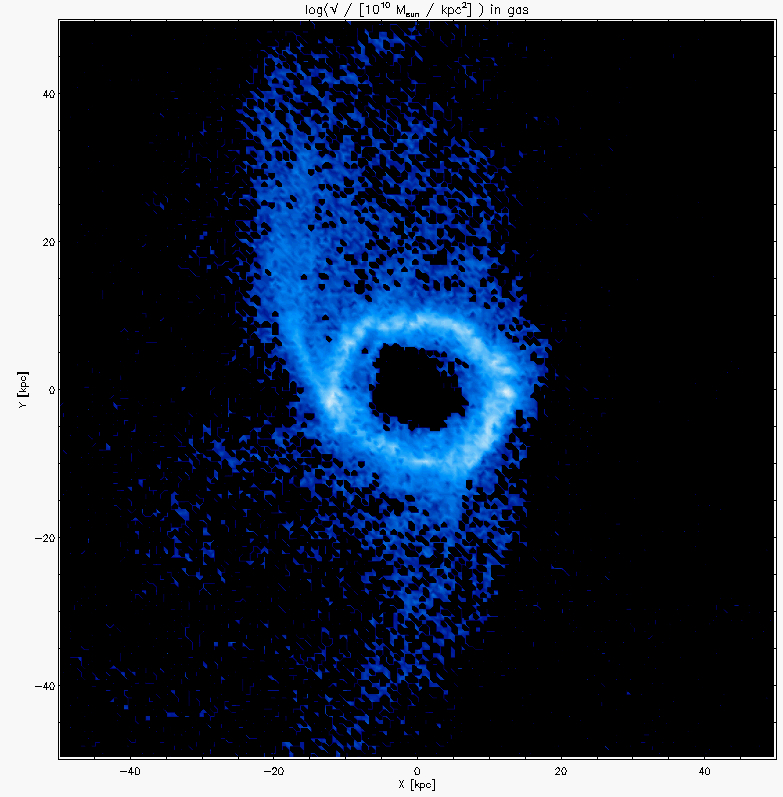
Fig. 3: An extreme case of gas accretion in a ring-shape. This simulated galaxy at a redshift z~0.5 was the result of smoothed particle hydrodynamical simulations.  (Image provided by Michael Aumer)

How is cold gas accreted in galaxies? Observers and theorists from MPA have joined their efforts to investigate the radial distribution of atomic gas in unusually gas-rich nearby galaxies. They found a universal shape for the radial profiles of the gas in the outer regions of the observed galaxies, and obtained remarkable agreement with simulations. In half the galaxies, the atomic gas may have been accreted in the form of "rings" 

Every astronomy student learns that in galaxies stars form from huge gas clouds. However, the details of the accretion and distribution of gas in galaxies is still unclear. Therefore, an international group of scientists at MPA and ASTRON in the Netherlands joined forces and carried out the Bluedisk project to map neutral hydrogen in a sample of 25 very gas-rich galaxies as well as a similar-sized sample of “control” galaxies with similar masses, sizes and distances, but normal gas content. Their main tools were the Westerbork Synthesis Radio Telescope (WSRT) as well as elaborate computer simulations (see Research Highlight May 2013). 

There have been many efforts over the past three decades to map the distribution of cold, atomic gas in galaxies using radio synthesis telescopes. The first analyses showed that the atomic gas exhibits a wide variety of detailed features. These can be attributed to irregularities in the galaxy such as spiral arms, rings, bars, warps etc. Studies of larger samples revealed basic scaling relations that provide hints of the mechanisms regulating the evolution of galaxies. 

In contrast to the stellar surface density, which peaks in the centre of the galaxy and drops steeply with radius, the radial distribution of the atomic gas often flattens or even declines near the centre of the galaxy. In the outer regions, the gas disks usually extend to a larger distance from the centre than the stellar disks, and are well-fit by exponential functions. 

Thanks to improvements in the WSRT instrumentation and data analysis, the observations by the Bluedisk team reached significantly lower column densities than previous surveys, i.e. they were able to map the gas in regions where the gas has low density. This sample is thus also well-suited for direct comparison with theoretical models. Observers and theorists worked together closely to improve their understanding of the radial distribution of the cold, atomic gas and to find a physical explanation for its structure. 

The study revealed an interesting observational phenomenon: in the outer regions of all the galaxies, the gas exhibits a homogeneous surface density profile (if the sizes of the gas disks are properly scaled). This profile is well-fit by an exponential function with a universal scale-length. This universal profile appears to hold for all galaxies, irrespective of their stellar properties, gas masses, sizes, or morphologies (for an example see figure 1). This is remarkable, because the gas-rich galaxies contain on average 10 times more gas than the control sample. 

In addition, the team found surprising agreement between their universal profile and results from simulations, both for smoothed-particle hydrodynamical simulations and for semi-analytic models of disk galaxy formation (see figure 2). It remains something of a mystery why the agreement with the smoothed-particle hydrodynamical simulations is quite so good. 

In the semi-analytic models, the universal shape of the outer radial profiles is a direct consequence of the assumption that infalling gas is always distributed exponentially. However, there are observational indications that the atomic gas could be accreted in the form of "rings". Therefore, more work is underway on the theoretical side using smoothed particle hydrodynamical simulations to try and understand how gas settles onto the simulated galaxies in more detail (see figure 3).

Jing Wang & Guinevere Kauffmann


Further reading:

Wang, J.; Fu, J., Aumer, M., Kauffmann, G., et al., "An observational and theoretical view of radial distribution of HI gas in galaxies", 2014, submitted to MNRAS. http://arxiv.org/abs/1401.8164

Related Links: