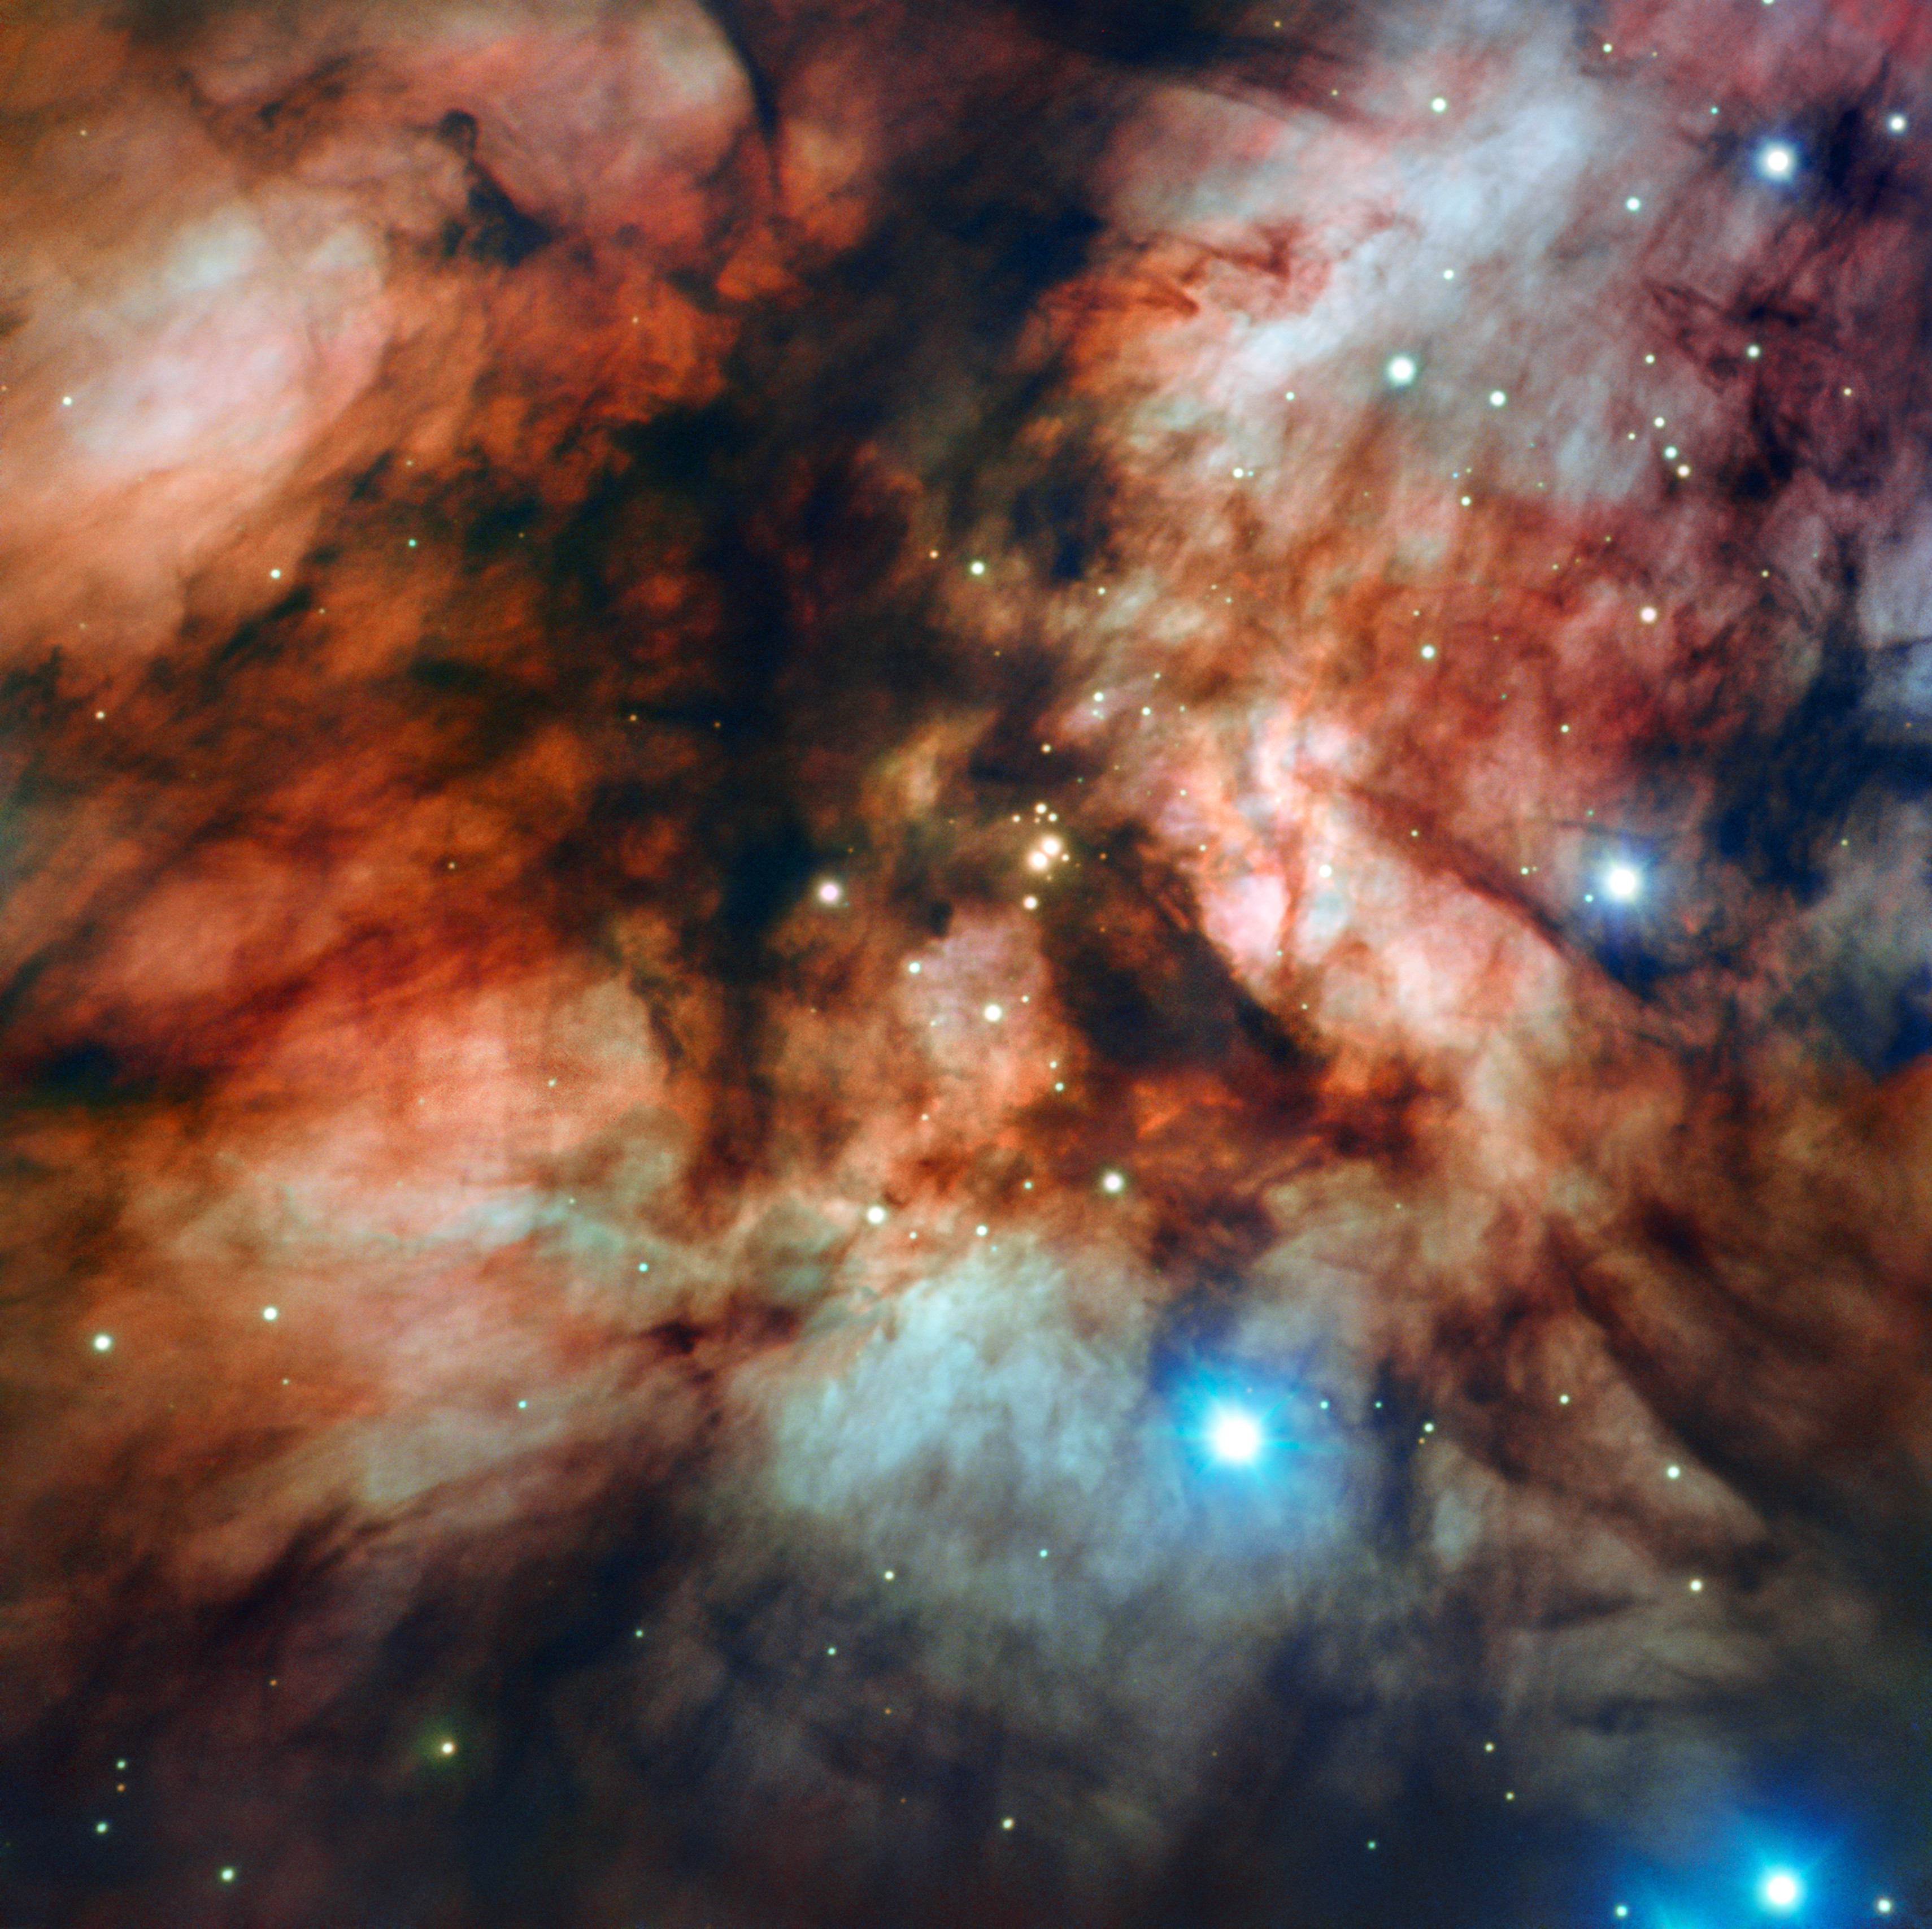
Astronomers from the Max Planck Institute for Astronomy have constructed the first detailed 3D map of the properties of cosmic dust in our home galaxy. For their map, the astronomers used 130 million spectra from ESA’s Gaia mission, results from the LAMOST spectral survey, and machine learning. Dust makes distant astronomical objects appear more reddish and dimmer than they really are, so the new map will be an important tool for astronomers to make sense of their observations. The study has also revealed unusual properties of cosmic dust that will lead to further research.
When we observe distant celestial objects, there is a possible catch: Is that star I am observing really as reddish as it appears? Or does the star merely look reddish, since its light has had to travel through a cloud of cosmic dust to reach our telescope? For accurate observations, astronomers need to know the amount of dust between them and their distant targets. Not only does dust make objects appear reddish (“reddening”), it also makes them appear fainter than they really are (“extinction”). It’s like we are looking out into space through a dirty window. Now, two astronomers have published a 3D map that documents the properties of dust all around us in unprecedented detail, helping us make sense of what we observe.
Behind this is the fact that, fortunately, when looking at stars, there is a way of reconstructing the effect of dust. Cosmic dust particles do not absorb and scatter light evenly across all wavelengths. Instead, they absorb light more strongly at shorter wavelengths (towards the blue end of the spectrum), and less strongly at longer wavelengths (towards the red end). The wavelength-dependence can be plotted as an “extinction curve,” and its shape provides information not only about the composition of the dust, but also about its local environment, such as the amount and properties of radiation in the various regions of interstellar space.
When we observe distant celestial objects, there is a possible catch: Is that star I am observing really as reddish as it appears? Or does the star merely look reddish, since its light has had to travel through a cloud of cosmic dust to reach our telescope? For accurate observations, astronomers need to know the amount of dust between them and their distant targets. Not only does dust make objects appear reddish (“reddening”), it also makes them appear fainter than they really are (“extinction”). It’s like we are looking out into space through a dirty window. Now, two astronomers have published a 3D map that documents the properties of dust all around us in unprecedented detail, helping us make sense of what we observe.
Behind this is the fact that, fortunately, when looking at stars, there is a way of reconstructing the effect of dust. Cosmic dust particles do not absorb and scatter light evenly across all wavelengths. Instead, they absorb light more strongly at shorter wavelengths (towards the blue end of the spectrum), and less strongly at longer wavelengths (towards the red end). The wavelength-dependence can be plotted as an “extinction curve,” and its shape provides information not only about the composition of the dust, but also about its local environment, such as the amount and properties of radiation in the various regions of interstellar space.
Retrieving dust information from 130 million spectra
This is the kind of information used by Xiangyu Zhang, a PhD student at the Max Planck Institute for Astronomy (MPIA), and Gregory Green, an independent research group leader (Sofia Kovalevskaja Group) at MPIA and Zhang’s PhD advisor, to construct the most detailed 3D map yet of the properties of dust in the Milky Way galaxy. Zhang and Green turned to data from ESA’s Gaia mission, which was a 10.5-year-effort to obtain extremely accurate measurements of positions, motions and additional properties for more than a billion stars in our Milky Way and in our nearest galactic neighbours, the Magellanic Clouds. The third data release (DR3) of the Gaia mission, published in June 2022, provides 220 million spectra, and a quality check told Zhang and Green that about 130 million of those would be suitable for their search for dust.
The Gaia spectra are low-resolution, that is, the way that they separate light into different wavelength regions is comparatively coarse. The two astronomers found a way around that limitation: For 1% of their chosen stars, there is high-resolution spectroscopy from the LAMOST survey operated by the National Astronomical Observatories of China. This provides reliable information about the basic properties of the stars in question, such as their surface temperatures, which determines what astronomers call a star’s “spectral type.” Reconstructing a 3D map
Zhang and Green trained a neural network to generate model spectra based on a star’s properties and the properties of the intervening dust. They compared the results to 130 million suitable spectra from Gaia, and used statistical (“Bayesian”) techniques to deduce the properties of the dust between us and those 130 million stars.
The results allowed the astronomers to reconstruct the first detailed, three-dimensional map of the extinction curve of dust in the Milky Way. This map was made possible by Zhang and Green’s measurement of the extinction curve towards an unprecedented number of stars – 130 million, compared to previous works, which contained approximately 1 million measurements.
But dust is not just a nuisance for astronomers. It is important for star formation, which occurs in giant gas clouds shielded by their dust from the surrounding radiation. When stars form, they are surrounded by disks of gas and dust, which are the birthplaces of planets. The dust grains themselves are the building blocks for what will eventually become the solid bodies of planets like our Earth. In fact, within the interstellar medium of our galaxy, most of the elements heavier than hydrogen and helium are locked up in interstellar dust grains.
The Gaia spectra are low-resolution, that is, the way that they separate light into different wavelength regions is comparatively coarse. The two astronomers found a way around that limitation: For 1% of their chosen stars, there is high-resolution spectroscopy from the LAMOST survey operated by the National Astronomical Observatories of China. This provides reliable information about the basic properties of the stars in question, such as their surface temperatures, which determines what astronomers call a star’s “spectral type.” Reconstructing a 3D map
Zhang and Green trained a neural network to generate model spectra based on a star’s properties and the properties of the intervening dust. They compared the results to 130 million suitable spectra from Gaia, and used statistical (“Bayesian”) techniques to deduce the properties of the dust between us and those 130 million stars.
The results allowed the astronomers to reconstruct the first detailed, three-dimensional map of the extinction curve of dust in the Milky Way. This map was made possible by Zhang and Green’s measurement of the extinction curve towards an unprecedented number of stars – 130 million, compared to previous works, which contained approximately 1 million measurements.
But dust is not just a nuisance for astronomers. It is important for star formation, which occurs in giant gas clouds shielded by their dust from the surrounding radiation. When stars form, they are surrounded by disks of gas and dust, which are the birthplaces of planets. The dust grains themselves are the building blocks for what will eventually become the solid bodies of planets like our Earth. In fact, within the interstellar medium of our galaxy, most of the elements heavier than hydrogen and helium are locked up in interstellar dust grains.
Unexpected properties of cosmic dust
The new results not only produce an accurate 3D map. They have also turned up a surprising property of interstellar dust clouds. Previously, it had been expected that the extinction curve should become flatter (less dependent on wavelength) for regions with a higher dust density. “Higher density,” of course, is in this case still very little: approximately ten billionth billionth grams of dust per cubic meter, equivalent to just 10 kg of dust in a sphere with Earth’s radius. In such regions, dust grains tend to grow in size, which changes the overall absorption properties.
Instead, the astronomers found that in areas of intermediate density, the extinction curve actually becomes steeper, with smaller wavelengths absorbed much more effectively than longer ones. Zhang and Green surmise that the steepening might be caused by the growth not of dust, but of a class of molecules called polycyclic aromatic hydrocarbons (PAHs), the most abundant hydrocarbons in the interstellar medium, which may even have played a role in the origin of life. They have already set out to test their hypothesis with future observations.
Instead, the astronomers found that in areas of intermediate density, the extinction curve actually becomes steeper, with smaller wavelengths absorbed much more effectively than longer ones. Zhang and Green surmise that the steepening might be caused by the growth not of dust, but of a class of molecules called polycyclic aromatic hydrocarbons (PAHs), the most abundant hydrocarbons in the interstellar medium, which may even have played a role in the origin of life. They have already set out to test their hypothesis with future observations.
Background information
The results reported here have been published as Xiangyu Zhang and Gregory M. Green, “Three-dimensional maps of the interstellar dust extinction curve within the Milky Way galaxy,” in the journal Science. Both authors work at the Max Planck Institute for Astronomy.
Contacts:
Dr. Markus Pössel
tel: +49 6221 528-261
pr@mpia.de
MPIA press department
Max Planck Institute for Astronomy, Heidelberg
Dr. Gregory Green
Sofia Kovalevskaja Group Leader
tel: +49 6221 528-460
green@mpia.de
Gregory Green / MPIA
Max-Planck-Institut für Astronomie, Heidelberg, Deutschland
Original publication
Xiangyu Zhang, Gregory M. Green
Three-dimensional maps of the interstellar dust extinction curve within the Milky Way galaxy
Science (2025). DOI: 10.1126/science.ado9787
Preprint available at: https://www.eurekalert.org/press/scipak/
Download
- mpia-pm_green_figure_notext 175.53 kB
- mpia-pm_green_figure_withtext 469.75 kB