Showing posts with label Galaxies. Show all posts

Monday, April 20, 2026

DESI Completes Planned 3D Map of the Universe and Continues Exploring

PR Image noirlab2610a
Zoomed-in portion of DESI’s year-five map

PR Image noirlab2610b
Full DESI year-five map

PR Image noirlab2610c
DESI year-five butterfly plot

PR Image noirlab2610d
Kitt Peak National Observatory beneath the Milky Way

PR Image noirlab2610e
Sunset over Kitt Peak National Observatory

PR Image noirlab2610f
Nicholas U. Mayall 4-meter Telescope at Kitt Peak National Observatory

PR Image noirlab2610g
Nicholas U. Mayall 4-meter Telescope at Kitt Peak National Observatory

PR Image noirlab2610h
Nicholas U. Mayall 4-meter Telescope at Kitt Peak National Observatory

PR Image noirlab2610i
Nicholas U.Mayall 4-meter Telescope Interior


Videos

Moving through DESI’s map
PR Video noirlab2610a
Moving through DESI’s map

DESI map rotation
PR Video noirlab2610b
DESI map rotation

DESI five-year map rotation
PR Video noirlab2610c
DESI five-year map rotation

DESI map flythrough
PR Video noirlab2610d
DESI map flythrough

DESI observations over five years (with constellations)
PR Video noirlab2610e
DESI observations over five years (with constellations)

DESI observations over five years
PR Video noirlab2610f
DESI observations over five years

Spacewatch all-sky with DESI pointings
PR Video noirlab2610g
Spacewatch all-sky with DESI pointings

Nicholas U. Mayall Telescope Movement B-Roll
PR Video noirlab2610h
Nicholas U. Mayall Telescope Movement B-Roll

DESI Observing Tiles
PR Video noirlab2610i
DESI Observing Tiles

A small patch of DESI’s 5000 fiber-optic “eyes” at work
PR Video noirlab2610j
A small patch of DESI’s 5000 fiber-optic “eyes” at work

DESI five-year map rotation (fulldome)
PR Video noirlab2610k
DESI five-year map rotation (fulldome)


The Dark Energy Spectroscopic Instrument, one of the most extensive surveys of the cosmos ever conducted, finished all observations for its originally planned 3D map of the Universe

DESI has mapped more than 47 million galaxies and quasars, creating the largest high-resolution 3D map of our Universe to date. Because of the instrument’s excellent performance and hints that dark energy might evolve, DESI will continue observations into 2028 and further expand the map. DESI was constructed with funding from the U.S. Department of Energy Office of Science and is mounted on the U.S. National Science Foundation Nicholas U. Mayall 4-meter telescope.

Last night, the 5000 fiber-optic eyes of the Dark Energy Spectroscopic Instrument (DESI) swiveled onto a patch of sky near the Little Dipper. Roughly every 20 minutes, they locked onto distant pinpricks of light, gathering photons that had traveled toward Earth for billions of years. When the Sun rose, DESI collaborators marked the completion of a major milestone: successfully surveying all of the area in DESI’s planned map of the Universe.

The five-year survey, finished ahead of schedule and with vastly more data than expected, has produced the largest high-resolution 3D map of the Universe ever made. Researchers use that map to explore dark energy, the fundamental ingredient that makes up about 70% of our Universe and is driving its accelerating expansion.

DESI’s quest to understand dark energy is a global endeavor. The international experiment brings together the expertise of more than 900 researchers (including 300 PhD students) from over 70 institutions. The project is managed by the U.S. Department of Energy’s Lawrence Berkeley National Laboratory (Berkeley Lab), and the instrument was constructed and is operated with funding from the DOE Office of Science. DESI is mounted on the U.S. National Science Foundation Nicholas U. Mayall 4-meter Telescope at NSF Kitt Peak National Observatory (KPNO) in Arizona, a Program of NSF NOIRLab.

By comparing how galaxies clustered in the past with their distribution today, researchers can trace dark energy’s influence over 11 billion years of cosmic history. Surprising results using DESI’s first three years of data hinted that dark energy, once thought to be a “cosmological constant,” might be evolving over time. With the full set of five years of data, researchers will have significantly more information to test whether that hint disappears or grows. If confirmed, it would mark a major shift in how we think about our Universe and its potential fate, which hinges on the balance between matter and dark energy.

“It’s impossible to capture everything that went into making DESI such a successful experiment. From instrument builders and software engineers to technicians, observatory staff, and scientists — including many early-career researchers — it truly took a village,” says Stephanie Juneau, associate astronomer and NSF NOIRLab representative for DESI. “Ultimately, we are doing this for all humanity, to better understand our Universe and its eventual fate. After finding hints that dark energy might deviate from a constant, potentially altering that fate, this moment feels like sitting on the edge of my seat as we analyze the new map to see whether those hints will be confirmed. I’m also very intrigued by the many other discoveries that await in this new dataset.”

This visualization shows how DESI’s map of the Universe accumulated over five years. It begins with DESI’s tiles on the night sky and transitions to the 3D map. Earth is at the center of the wedges, and every dot is a galaxy. Credit: DESI collaboration and KPNO/NOIRLab/NSF/AURA/R. Proctor

“The Dark Energy Spectroscopic Instrument has truly exceeded all expectations, delivering an unprecedented 3D map of the Universe that will revolutionize our understanding of dark energy,” says Kathy Turner, Program Manager for the Cosmic Frontier in the Office of High Energy Physics at the Department of Energy. “From its inception, we envisioned a project that would push the boundaries of cosmology, and to see it come to such a spectacularly successful completion for its initial survey, ahead of schedule and with such rich data, is incredibly rewarding. The dedication and ingenuity of the entire DESI collaboration have made this world-leading science a reality, and I am immensely proud of the groundbreaking results we are already seeing and the discoveries yet to come as we continue to explore the mysteries of our cosmos.”

“DESI’s five-year survey has been spectacularly successful,” says Michael Levi, DESI director and a scientist at Berkeley Lab. “The instrument performed better than anticipated. The results have been incredibly exciting. And the size and scope of the map, and how quickly we’ve been able to execute, is phenomenal. We’re going to celebrate completion of the original survey and then get started on the work of churning through the data, because we’re all curious about what new surprises are waiting for us.”

DESI has now measured cosmological data for six times as many galaxies and quasars as all previous measurements combined. The collaboration will immediately begin processing the completed dataset, with the first dark energy results from the full five-year survey expected in 2027. In the meantime, DESI collaborators continue to analyze the survey’s first three years of data, refining dark energy measurements and producing additional results on the structure and evolution of the Universe, with several papers planned later this year.

DESI began collecting data in May 2021. Since then, the instrument has far surpassed the collaboration’s original goals. The plan was to capture light from 34 million galaxies and quasars (extremely distant yet bright objects with black holes at their cores) over the five-year sky survey. DESI instead observed more than 47 million galaxies and quasars, as well as 20 million stars.

The project’s success is even more impressive in light of several challenges. DESI is a complicated machine with thousands of parts to maintain. In 2020, final tests of the instrument were interrupted by the COVID-19 pandemic. In 2022, the Contreras Fire swept over Kitt Peak but, through the efforts of firefighters and staff, did not damage the telescope. Recovery efforts were slowed by monsoons and mudslides.

ESI will continue observations through 2028 and grow its map by about 20%, from 14,000 square degrees to 17,000 square degrees. (For comparison, the Moon covers approximately 0.2 square degrees, and the full sky has over 41,000 square degrees). The extended map will cover parts of the sky that are more challenging to observe: areas that are closer to the plane of the Milky Way, where bright nearby stars can make it harder to see more distant objects, or further to the south, where the telescope must account for peering through more of Earth’s atmosphere.

The experiment will also revisit the existing area of the map to collect data from a new set of galaxies: more distant, fainter “luminous red galaxies.” These will provide an even denser, more detailed map of the regions DESI has already covered, giving researchers a clearer picture of the Universe’s history.

Researchers will also study nearby dwarf galaxies and stellar streams, bands of stars torn from smaller galaxies by the Milky Way’s gravity. The hope is to better understand dark matter, the invisible form of matter that accounts for most of the mass in the Universe but has never been directly detected.


More information

DESI is supported by the DOE Office of Science and by the National Energy Research Scientific Computing Center, a DOE Office of Science national user facility. Additional support for DESI is provided by the U.S. National Science Foundation; the Science and Technology Facilities Council of the United Kingdom; the Gordon and Betty Moore Foundation; the Heising-Simons Foundation; the French Alternative Energies and Atomic Energy Commission (CEA); the Secretariat of Science, Humanities, Technology and Innovation (SECIHTI) of Mexico; the Ministry of Science and Innovation of Spain; and by the DESI member institutions.

Lawrence Berkeley National Laboratory (Berkeley Lab) is committed to groundbreaking research focused on discovery science and solutions for abundant and reliable energy supplies. The lab’s expertise spans materials, chemistry, physics, biology, earth and environmental science, mathematics, and computing. Researchers from around the world rely on the lab’s world-class scientific facilities for their own pioneering research. Founded in 1931 on the belief that the biggest problems are best addressed by teams, Berkeley Lab and its scientists have been recognized with 17 Nobel Prizes. Berkeley Lab is a multiprogram national laboratory managed by the University of California for the U.S. Department of Energy’s Office of Science.

DOE’s Office of Science is the single largest supporter of basic research in the physical sciences in the United States, and is working to address some of the most pressing challenges of our time. For more information, please visit energy.gov/science.

NSF NOIRLab, the U.S. National Science Foundation center for ground-based optical-infrared astronomy, operates the International Gemini Observatory (a facility of NSF, NRC–Canada, ANID–Chile, MCTIC–Brazil, MINCyT–Argentina, and KASI–Republic of Korea), NSF Kitt Peak National Observatory (KPNO), NSF Cerro Tololo Inter-American Observatory (CTIO), the Community Science and Data Center (CSDC), and NSF–DOE Vera C. Rubin Observatory (in cooperation with DOE’s SLAC National Accelerator Laboratory). It is managed by the Association of Universities for Research in Astronomy (AURA) under a cooperative agreement with NSF and is headquartered in Tucson, Arizona.

The scientific community is honored to have the opportunity to conduct astronomical research on I’oligam Du’ag (Kitt Peak) in Arizona, on Maunakea in Hawai‘i, and on Cerro Tololo and Cerro Pachón in Chile. We recognize and acknowledge the very significant cultural role and reverence of I’oligam Du’ag to the Tohono O’odham Nation, and Maunakea to the Kanaka Maoli (Native Hawaiians) community.


Links


Contacts:

Stephanie Juneau
Associate Astronomer
NSF NOIRLab
Email:
stephanie.juneau@noirlab.edu

Will Percival
DESI Collaboration spokesperson
University of Waterloo
Email:
will.percival@uwaterloo.ca

Josie Fenske
Public Information Officer
NSF NOIRLab
Email:
josie.fenske@noirlab.edu

Lauren Biron
Lawrence Berkeley National Laboratory
Science Communication and Media Relations Specialist
Email:
LBiron@lbl.gov


Thursday, December 04, 2014

It’s Filamentary: How Galaxies Evolve in the Cosmic Web

Galaxies are distributed along a cosmic web in the universe. “Mpc/h” is a unit of galactic distance (1 Mpc/h is more than 3.2 million light-years)
Image credit: Volker Springel, Virgo Consortium

Behnam Darvish (left) and Bahram Mobasher are astronomers in the Department of Physics and Astronomy at UC Riverside
Photo credit: UC Riverside


UC Riverside-led team proposes that filaments in the cosmic web played a critical role in the distant universe

RIVERSIDE, Calif. – How do galaxies like our Milky Way form, and just how do they evolve?  Are galaxies affected by their surrounding environment? An international team of researchers, led by astronomers at the University of California, Riverside, proposes some answers.

The researchers highlight the role of the “cosmic web” – a large-scale web-like structure comprised of galaxies – on the evolution of galaxies that took place in the distant universe, a few billion years after the Big Bang.  In their paper, published Nov. 20 in the Astrophysical Journal, they present observations showing that thread-like “filaments” in the cosmic web played an important role in this evolution.

“We think the cosmic web, dominated by dark matter, formed very early in the history of the universe, starting with small initial fluctuations in the primordial universe,” said Behnam Darvish, a Ph.D. graduate student in the Department of Physics and Astronomy at UC Riverside, who led the research project and is the first author on the paper.  “Such a ‘skeletal’ universe must have played, in principle, a role in galaxy formation and evolution, but this was incredibly hard to study and understand until recently.”

The distribution of galaxies and matter in the universe is non-random.  Galaxies are organized, even today, in a manner resembling an enormous network – the cosmic web.  This web has dense regions made up of galaxy clusters and groups, sparsely populated regions devoid of galaxies, as well as the filaments that link overdense regions.

“The filaments are like bridges connecting the denser regions in the cosmic web,” Darvish explained.  “Imagine threads woven into the web.”
Videos showing structures in the cosmic web:

It is well known in astronomy that galaxies residing in less dense regions have higher probability of actively forming stars (much like our Milky Way), while galaxies in denser regions form stars at a much lower rate.
“But the role of intermediate environments and, in particular, the role of filaments and the cosmic web in the early universe remained, until very recently, a mystery,” said coauthor Bahram Mobasher, a professor of physics and astronomy at UCR and Darvish’s adviser.

What greatly assisted the researchers is a giant section of the cosmic web first revealed in two big cosmological surveys (COSMOS and HiZELS).  They proceeded to explore data also from several telescopes (Hubble, VLT, UKIRT and Subaru).  They then applied a new computational method to identify the filaments, which, in turn, helped them study the role of the cosmic web.

They found that galaxies residing in the cosmic web/filaments have a much higher chance of actively forming stars.  In other words, in the distant universe, galaxy evolution seems to have been accelerated in the filaments.

“It is possible that such filaments ‘pre-process’ galaxies, accelerating their evolution while also funneling them towards clusters, where they are fully processed by the dense environment of clusters and likely end up as dead galaxies,” Darvish said.  “Our results also show that such enhancement/acceleration is likely due to galaxy-galaxy interactions in the filaments.”

Because of the complexities involved in quantifying the cosmic web, astronomers usually limit the study of the cosmic web to numerical simulations and observations in our local universe. However, in this new study, the researchers focused their work on the distant universe – when the universe was approximately half its present age.

“We were surprised by the crucial role the filaments play in galaxy formation and evolution,” Mobasher said.  “Star formation is enhanced in them.  The filaments likely increase the chance of gravitational interaction between galaxies, which, in turn, results in this star-formation enhancement. There is evidence in our local universe that this process in filaments also continues to occur at the present time.”

Darvish and Mobasher were joined in this research by L. V. Sales at UCR; David Sobral at the Universidade de Lisboa, Portugal; N. Z. Scoville at the California Institute of Technology; P. Best at the Royal Observatory of Ediburgh, United Kingdom; and I. Smail at Durham University, United Kingdom.
Next, the team plans to extend this study to other epochs in the age of the universe to study the role of the cosmic web/filaments in galaxy formation and evolution across cosmic time.

“This will be a fundamental piece of the puzzle in order to understand how galaxies form and evolve as a whole,” Sobral said.

The UCR researchers were supported in the study by a grant to Mobasher from NASA through the Space Telescope Science Institute.


Media Contact


Tel: (951) 827-6050
E-mail: iqbal@ucr.edu
Twitter:
UCR_Sciencenews


Additional Contacts  

Behnam Darvish
E-mail:
bdarv001@ucr.edu
 
Bahram Mobasher
Tel: 951 827 7190
E-mail:
mobasher@ucr.edu


Saturday, October 18, 2014

Revealing the secrets of galaxies – second CALIFA Data Release

Figure 1: CALIFA data example: Top row: Poststamp images of five galaxies.  Bottom row: Colour coded gas velocity maps of the same galaxies based on CALIFA IFS data.  Credit: Top row: SDSS | Bottom row: CALIFA team

Today, the second large data release of the CALIFA-Survey has been published to the astronomical community and the public. It contains an unprecedented amount of data on 200 galaxies in the local universe allowing astronomers to study in detail numerous galaxy properties regarding their composition, kinematics, formation history and evolution.

The Calar Alto Legacy Integral Field Area survey (CALIFA) is one of the largest surveys of galaxies which is based on an observing technique called "Integral Field Spectroscopy" (IFS). Already a single spectrum of an astronomical object provides important data beyond pure imaging because the light from the source is split into its wavelength-dependent components and shows characteristic signatures related to physical, chemical and dynamical properties. However, using the PMAS Spectrograph at Calar Alto Observatory, the team of the CALIFA Survey is even able to collect 2000 individual spectra for each galaxy which are covering the whole surface of each object.

The 2nd CALIFA data release now provides unique data on a representative sample of 200 galaxies in the local Universe. These spectra allow studies of the stellar content, ages, star formation history, as well as gas and dust properties. However, beyond spectral diagnostics the CALIFA data-cubes allow to study the spatial distribution of all these properties. Moreover, as a unique feature of imaging spectroscopy, the kinematic properties, i.e. motions of the stars and gas over the whole face of a galaxy, enable the inference of the structure of the galaxy, the formation history, and even the presence of dark matter.

Compared to the 1st data release in 2012 this 2nd release presents a much improved preparation of the material. Data is provided with two spectral setups (in low and high resolution) and for each galaxy the data cube contains about 2000 individual spectra. In total this adds up to about 800,000 spectra released in DR2. The data is freely available for anyone interested.


Important Links:


Contact

Dr. Glenn van de Ven (Member CALIFA managing board)
Max Planck Institute for Astronomy
Heidelberg, Germany
Phone: (+49|0) 6221 – 528 275
email:
glenn@mpia.de

Dr. Knud Jahnke (co-founding member, CALIFA)
Max Planck Institute for Astronomy
Heidelberg, Germany
Phone: (+49|0) 6221 – 528 398
email:
jahnke@mpia.de

Dr. Klaus Jäger (MPIA Scientific Coordinator, press officer)
Max Planck Institute for Astronomy
Heidelberg, Germany
Phone: (+49|0) 6221 – 528 379
email:
pr@mpia.de 


Tuesday, June 10, 2014

Stellar halos reveal galactic accretion: Big fish eat small fish

Fig. 1: Up: Image of a single SDSS galaxy which goes into a stack. Below: The stack of early-type galaxies in the highest mass range. The contours indicate the ellipticity measured at various distances from the centre. For the individual galaxy image only the central, high surface brightness regions are visible, the outer areas are dominated by noise. While a typical single SDSS image allows one to go to a depth of 26 magnitudes/arcsec2, in our stacked image we can achieve a depth of nearly 32 magnitudes/arcsec2 in the r-band.  Fig 1a - Fig 1b

Fig. 2: Fraction of accreted stellar light for early-type galaxies as a function of galaxy mass. 

Fig. 3: Same as Fig.2 for late-type galaxies. Here the same trend can be seen, although the fraction of accreted stellar light is much smaller. 

Fig. 4: The stellar halo with a Sagitarius-like stream of Messier 63 from Martinez-Delgado et al. 2010, The Astronomical Journal, 140, 962 

Galaxies contain not only "home-made" stars, but also quite a large fraction of stars that were accreted from other galaxies, as a new analysis of SDSS images has recently shown. The scientists at the MPA "stacked" a large number of individual galaxy images to reveal the faint light of the stellar halo of distant galaxies. For the most massive, early-type galaxies the fraction of accreted stars in the stellar halo can be up to 70%. 

In recent years, deep photometric observations of the local universe have revealed that galaxies are surrounded by a "stellar halo", a group of stars that extend to a distance of up to 100 kpc and more from the centre of the galaxy. This stellar halo consists of field stars, older globular clusters, and stars stripped from in-falling satellite galaxies. Too often, this stellar halo is too faint to observe with present day imaging. 

For our own galaxy, the individual stars of the stellar halo have been resolved with the help of the SDSS survey up to a distance of 50 kpc from the galactic centre. In addition, deep integrated light studies have revealed the stellar halo of neighbouring galaxies in the local universe. However, for large-scale studies of these stellar halos, many more observations are required. Unfortunately, with present telescopes and reasonable integration times, we can only detect the stellar halos of nearby galaxies. 

An alternative approach to deep observations of individual galaxies would be to stack a large number of images of similar galaxies. SDSS with nearly 60,000 galaxies in its spectroscopic sample, for which accurate redshifts and stellar masses are available, is just the right survey for the job. Even though the stellar halos of individual galaxies cannot be directly observed in the photometric images, by stacking these images we can increase the signal-to-noise (S/N) ratio, and thus study the average stellar halos of the galaxies as a function of various galaxy properties. 

The theory of galaxy formation through hierarchical merging predicts not only that galaxies grow in size and mass through minor mergers, but also that these minor mergers give rise to the stellar halo. This implies that the stellar halos of galaxies consist of stars which are not born in the same galaxy (in-situ stars) but rather of stars which are born in smaller galaxies that have been accreted (the accreted component). 

Studying the stellar halos of galaxies gives us vital clues to further constrain the theory of galaxy formation. For example, the fraction of stellar material accreted from other galaxies is an important physical constraint in the theory of galaxy formation. In addition, the local over-densities in the stellar halo of a galaxy often contain vital clues of the accretion history of the individual galaxy, since the low density and large relaxation times of stars in the stellar halo preserves information from the distant past. 

A variety of theoretical simulations have been carried out that help us to better understand the formation of stellar halos. In particular, the particle-tagging simulations done here at MPA have predicted the stellar halos of a large range of galaxies and their accreted fractions. Although the exact properties of the stellar halos of galaxies depend on the individual accretion history of a galaxy, one can predict the average stellar halo properties of galaxies as a function of the dark matter halo mass, of the stellar mass, or as a function of other properties of the galaxy. 

To constrain these theories, we require observations of the stellar halos of a large number of galaxies, or alternatively stacked images as mentioned above. In this work, we have used SDSS images of galaxies in various bins of stellar mass and divided them into late-type and early-type galaxies. In each stack, we have an average of nearly 3000 galaxies. Before stacking, each image of a galaxy was transformed to a common redshift (z=0.1) and oriented along the major axis. Other galaxies and stars in the image are masked out. 

The stacked images of the galaxies reveal extra light out to nearly 100 kpc (see Fig. 1) and we find that the amount of extra light in the stellar halo is a strong function of stellar mass: Larger galaxies have more extended stellar halos than smaller galaxies. Similarly, early-type galaxies have larger stellar halos than late-type galaxies. Also, the ellipticity of the stellar halo is a function of stellar mass and the haloes of early-type galaxies are more elliptical than those of late-type galaxies. 

To characterize the stellar halo of the galaxy stacks in more detail, we model the two-dimensional light distribution with a ''Sersic'' profile (first published in 1963), a general mathematical function to describe the radial light intensity distribution of a wide variety of galaxy types. While this provided a good fit in the past, deviations from the Sersic profile have often been found, as deeper high-resolution data became available with newer telescopes and instruments. 

For our stacked images, we find that the two-dimensional light distribution cannot be fit by a single Sersic profile, but rather needs multiple components: a double Sersic profile is needed for early-type galaxies, and a triple Sersic profile is required for late-type galaxies. 

Each Sersic component traces a different physical and dynamical component of the galaxy. Under the assumption that the inner Sersic profile fits the in-situ component, and that the outer Sersic profile fits the accreted stellar component, we obtain an observational measure of the average accreted stellar light fraction of the galaxy. For early-type galaxies, the fraction of accreted stellar light rises from 30% to 70% while for late-type galaxies it is much smaller, increasing from 2% to 25% over the same mass range (See Figures 2 and 3). This provides important observational constraints for a range of galaxy masses and types, which can help differentiate between various theories of the formation of stellar halos and of the galaxies themselves.

 
Richard D'Souza

References:

1) R. D'Souza, G. Kauffmann, J. Wang, S. Vegetti, "Parametrizing the Stellar Haloes of Galaxies", submitted to MNRAS

2) Cooper, A.P.; D'Souza, R.; Kauffmann, G.; "Galactic accretion and the outer structure of galaxies in the CDM model", MNRAS, 434/4, p.3348-3367, 2013


Wednesday, March 19, 2014

Herschell completes largest survey of cosmic dust in local Universe

Collage of galaxies in the Herschel Reference Survey at infrared/submillimetre wavelengths by Herschel (left) and at visible wavelengths from the Sloan Digital Sky Survey (SDSS, right). The Herschel image is coloured with blue representing cold dust and red representing warm dust; the SDSS image shows young stars in blue and old stars in red. Together, the observations plot young, dust-rich spiral/irregular galaxies in the top left, with giant dust-poor elliptical galaxies in the bottom right. Copyright: ESA/Herschel/HRS-SAG2 and HeViCS Key Programmes/Sloan Digital Sky Survey/ L. Cortese (Swinburne University)

Collage of galaxies included in the Herschel Reference Survey, the largest census of cosmic dust in the local Universe. The galaxies are presented in false-colour to highlight different dust temperatures, with blue and red representing colder and warmer regions respectively. The collage is presented with dust-rich, spiral and irregular galaxies in the top left, and giant, dust-poor elliptical galaxies in the bottom-right. The images were composed from PACS and SPIRE observations at 100, 160 and 250 microns. Copyright ESA/Herschel/HRS-SAG2 and HeViCS Key Programmes/L. Cortese (Swinburne University)
.
Collage of galaxies included in the Herschel Reference Survey as seen at visible wavelengths in images obtained by the Sloan Digital Sky Survey. The colour distribution highlights different stellar ages, with red and blue indicating older and younger stars, respectively. Copyright: Sloan Digital Sky Survey/L. Cortese (Swinburne University)

The largest census of dust in local galaxies has been completed using data from ESA’s Herschel space observatory, providing a huge legacy to the scientific community. 

Cosmic dust grains are a minor but fundamental ingredient in the recipe of gas and dust for creating stars and planets. But despite its importance, there is an incomplete picture of the dust properties in galaxies beyond our own Milky Way. 

Key questions include how the dust varies with the type of galaxy, and how it might affect our understanding of how galaxies evolve. 

Before concluding its observations in April 2013, Herschel provided the largest survey of cosmic dust, spanning a wide range of nearby galaxies located 50–80 million light-years from Earth. 

The catalogue contains 323 galaxies with varying star formation activity and different chemical compositions, observed by Herschel’s instruments across far-infrared and submillimetre wavelengths. 

A sample of these galaxies is displayed in a collage, arranged from dust-rich in the top left to dust-poor in the bottom right. 

The dust-rich galaxies are typically spiral or irregular, whereas the dust-poor ones are usually elliptical. Blue and red colours represent cooler and warmer regions of dust, respectively. 

Dust is gently heated across a range of temperatures by the combined light of all of the stars in each galaxy, with the warmest dust being concentrated in regions where stars are being born. 

For comparison, the galaxies are also shown in visible light images obtained by the Sloan Digital Sky Survey. 

Here, blue corresponds to young stars – hot, massive stars that burn through their fuel very quickly and are therefore short-lived. 

Conversely, red stars are older population – they are less massive and cooler, and therefore live for longer. 

The Herschel observations allow astronomers to determine how much light is emitted by the dust as a function of wavelength, providing a means to study the physical properties of the dust. 

For example, a galaxy forming stars at a faster rate should have more massive, hot stars in it, and thus the dust in the galaxy should also be warmer. In turn, that means that more of the light emitted by the dust should come out at shorter wavelengths. 

However, the data show greater variations than expected from one galaxy to another based on their star formation rates alone, implying that other properties, such as its chemical enrichment, also play an important role. 

By allowing astronomers to investigate these correlations and dependences, the survey provides a much-needed local benchmark for quantifying the role played by dust in galaxy evolution throughout the history of the Universe. 

The data will complement observations being made by other telescopes, such as the ground-based Atacama Large Millimeter Array in Chile, which will allow astronomers to look at dust in galaxies to the very edge of the observable Universe.

More information:

“PACS photometry of the Herschel Reference Survey – far-infrared/sub-millimeter colours as tracers of dust properties in nearby galaxies,” by L. Cortese et al., is published in the Monthly Notices of the Royal Astronomical Society, 18 March 2014.


For further information, please contact:
 
Markus Bauer


ESA Science and Robotic Exploration Communication Officer


Tel: +31 71 565 6799


Mob: +31 61 594 3954


Email:
markus.bauer@esa.int

Luca Cortese
Swinburne University of Technology, Australia
Email:
lcortese@swin.edu.su

Göran Pilbratt
ESA Herschel Project Scientist
Tel: +31 71 565 3621

Email:
gpilbratt@rssd.esa.int

Source: ESA/Herschel


Thursday, March 13, 2014

Some galaxies in the early universe grew up quickly


Pasadena, CA- Some galaxies grew up in a hurry. Most of the galaxies that have been observed from the early days of the universe were young and actively forming stars. Now, an international team of astronomers, including Carnegie’s Eric Persson and Andy Monson, have discovered galaxies that were already mature and massive in the early days. Fifteen mature galaxies were found at a record-breaking average distance of 12 billion light years, when the universe was just 1.6 billion years old. Their existence at such an early time raises new questions about what forced them to grow up so quickly. The finding is published by The Astrophysical Journal Letters.

Today the universe is filled with galaxies that have largely stopped forming stars, a sign of galactic maturity. But in the distant past, galaxies were still actively growing by consuming gas and turning it into stars. This means that mature galaxies should have been almost non-existent when the universe was still young.

Together with lead author Caroline Straatman and principal investigator Ivo Labbe, both of Leiden University, the astronomers used deep images at near-infrared wavelengths to search for galaxies in the early universe with red colors. The characteristic red colors indicate the presence of old stars and a lack of active star formation. The galaxies are barely detectable at visual wavelengths and are easily overlooked. But in the new near-infrared light images they are easily measured, from which it can be inferred that they already contained as many as 100 billion stars on average per galaxy.

The mature galaxies have masses similar to that of the Milky Way, which still forms new stars at a slow rate. The newly discovered galaxies must have formed very rapidly in roughly 1 billion years, with explosive rates of star-formation. The rate of star formation must have been several hundred times larger than observed in the Milky Way today.

The finding raises new questions about how these galaxies formed so rapidly and why they stopped forming stars so early. It is an enigma that these galaxies seem to come out of nowhere. Another big question is what caused the galaxies to mature at such a young age and if some dramatic event might have caused premature aging.

The galaxies were discovered after 40 nights of observing with the FourStar camera on the Magellan Baade Telescope at Carnegie’s Las Campanas Observatory in Chile and combined with data from Hubble’s Cosmic Assembly Near-infrared Deep Extragalactic Legacy Survey and the Great Observatories Origins Deep Survey. Using special filters to produce images that are sensitive to narrow slices of the near-infrared spectrum, the team was able to measure accurate distances to thousands of distant galaxies at a time, providing a 3-D map of the early universe.

Caption: A Hubble Space Telescope color composite image of the astronomical field Chandra Deep Field South, with two of the 15 mature galaxies. They exhibit the typical red colors of mature galaxies. The other galaxies in the image are much closer.  A larger version is available here. 

*****************************

This research was supported in part by the George P. and Cynthia Woods Mitchell Institute for Fundamental Physics and Astronomy; NSF AST-1009707; ERC HIGHZ #227749; and NL-NWO Spinoza. Australian access to the Magellan Telescopes was supported through the NCRIS of the Australian Federal Government. This work is based on observations made with Herschel, an ESA Cornerstone Mission with significant participation by NASA, through an award issued by JPL/Caltech.


Wednesday, March 12, 2014

An observational and theoretical view of the atomic gas distribution in galaxies

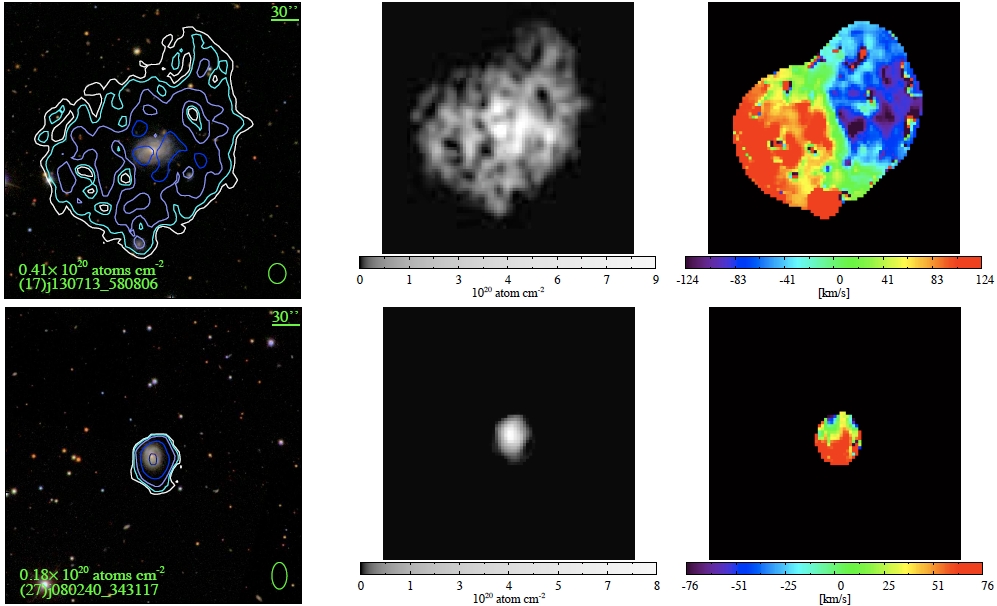
Fig. 1: The top and bottom rows show two galaxies with very different gas disk morphologies. From left to right: the column density contours for neutral hydrogen overlaid on optical images from the Sloan Digital Sky Survey, the neutral hydrogen itself, and the velocity maps of the neutral hydrogen.

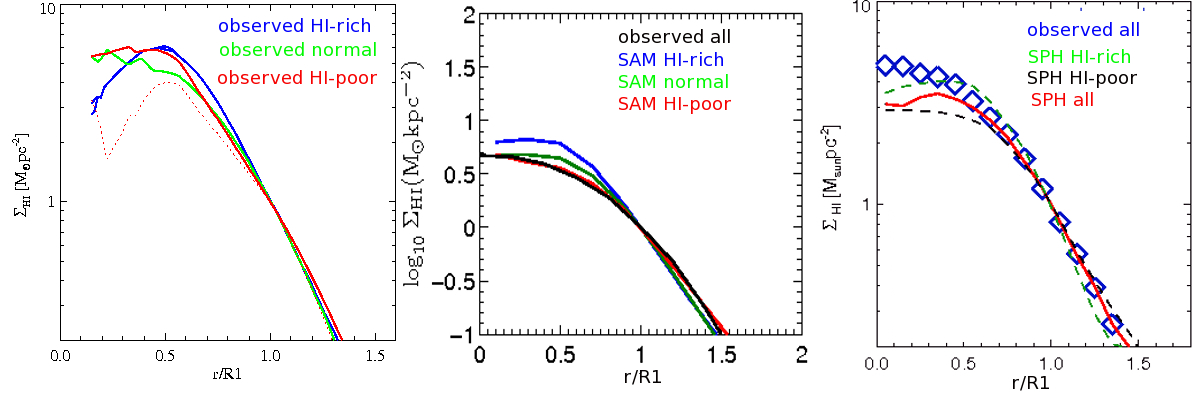
Fig. 2: The median radial profiles of different galaxies (blue: gas rich, green: normal, red: gas poor). For all galaxies, the radius has been scaled to R1, where the gas surface density reaches 1 solar mass / square parsec. The observed profiles in the left plot are compared to results from semi- analytical models (SAM, middle) and results from smoothed particle hydrodynamical simulations (SPH, right). 

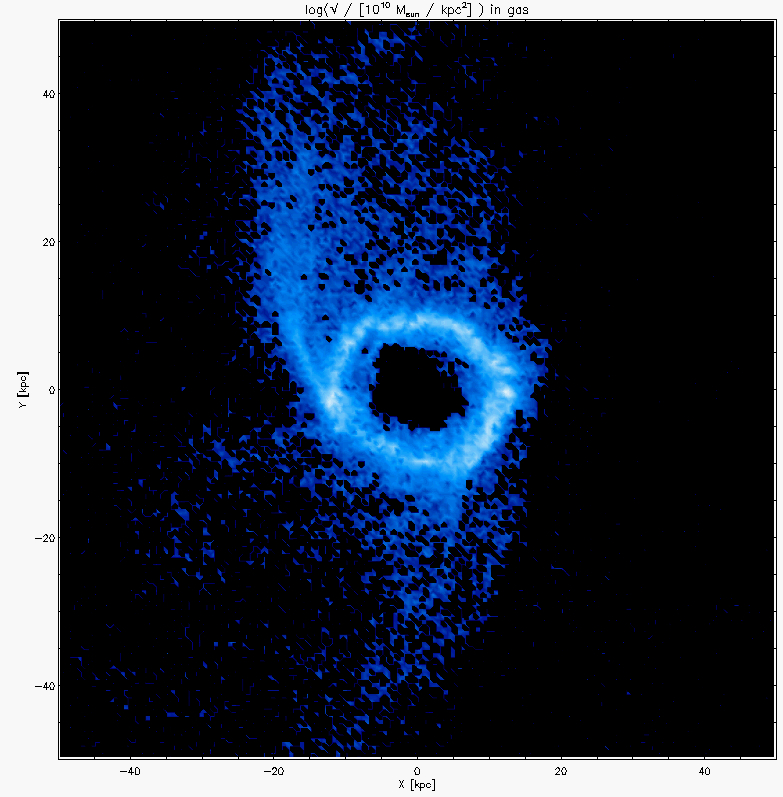
Fig. 3: An extreme case of gas accretion in a ring-shape. This simulated galaxy at a redshift z~0.5 was the result of smoothed particle hydrodynamical simulations.  (Image provided by Michael Aumer)

How is cold gas accreted in galaxies? Observers and theorists from MPA have joined their efforts to investigate the radial distribution of atomic gas in unusually gas-rich nearby galaxies. They found a universal shape for the radial profiles of the gas in the outer regions of the observed galaxies, and obtained remarkable agreement with simulations. In half the galaxies, the atomic gas may have been accreted in the form of "rings" 

Every astronomy student learns that in galaxies stars form from huge gas clouds. However, the details of the accretion and distribution of gas in galaxies is still unclear. Therefore, an international group of scientists at MPA and ASTRON in the Netherlands joined forces and carried out the Bluedisk project to map neutral hydrogen in a sample of 25 very gas-rich galaxies as well as a similar-sized sample of “control” galaxies with similar masses, sizes and distances, but normal gas content. Their main tools were the Westerbork Synthesis Radio Telescope (WSRT) as well as elaborate computer simulations (see Research Highlight May 2013). 

There have been many efforts over the past three decades to map the distribution of cold, atomic gas in galaxies using radio synthesis telescopes. The first analyses showed that the atomic gas exhibits a wide variety of detailed features. These can be attributed to irregularities in the galaxy such as spiral arms, rings, bars, warps etc. Studies of larger samples revealed basic scaling relations that provide hints of the mechanisms regulating the evolution of galaxies. 

In contrast to the stellar surface density, which peaks in the centre of the galaxy and drops steeply with radius, the radial distribution of the atomic gas often flattens or even declines near the centre of the galaxy. In the outer regions, the gas disks usually extend to a larger distance from the centre than the stellar disks, and are well-fit by exponential functions. 

Thanks to improvements in the WSRT instrumentation and data analysis, the observations by the Bluedisk team reached significantly lower column densities than previous surveys, i.e. they were able to map the gas in regions where the gas has low density. This sample is thus also well-suited for direct comparison with theoretical models. Observers and theorists worked together closely to improve their understanding of the radial distribution of the cold, atomic gas and to find a physical explanation for its structure. 

The study revealed an interesting observational phenomenon: in the outer regions of all the galaxies, the gas exhibits a homogeneous surface density profile (if the sizes of the gas disks are properly scaled). This profile is well-fit by an exponential function with a universal scale-length. This universal profile appears to hold for all galaxies, irrespective of their stellar properties, gas masses, sizes, or morphologies (for an example see figure 1). This is remarkable, because the gas-rich galaxies contain on average 10 times more gas than the control sample. 

In addition, the team found surprising agreement between their universal profile and results from simulations, both for smoothed-particle hydrodynamical simulations and for semi-analytic models of disk galaxy formation (see figure 2). It remains something of a mystery why the agreement with the smoothed-particle hydrodynamical simulations is quite so good. 

In the semi-analytic models, the universal shape of the outer radial profiles is a direct consequence of the assumption that infalling gas is always distributed exponentially. However, there are observational indications that the atomic gas could be accreted in the form of "rings". Therefore, more work is underway on the theoretical side using smoothed particle hydrodynamical simulations to try and understand how gas settles onto the simulated galaxies in more detail (see figure 3).

Jing Wang & Guinevere Kauffmann


Further reading:

Wang, J.; Fu, J., Aumer, M., Kauffmann, G., et al., "An observational and theoretical view of radial distribution of HI gas in galaxies", 2014, submitted to MNRAS. http://arxiv.org/abs/1401.8164

Related Links:


Monday, November 18, 2013

WISE Catalog Just Got Wiser

The new AllWISE catalog will bring distant galaxies that were once invisible out of hiding, as illustrated in this image.  › Full image and caption

NASA's WISE mission has released a new and improved atlas and catalog brimming with data on three-quarters of a billion objects detected during two full scans of the sky.

WISE, which stands for Wide-field Infrared Survey Explorer, scanned the entire sky in infrared light in 2010, snapping a dozen pictures of every star and galaxy. By October of that year, the spacecraft ran out of the coolant needed to chill some of its heat-seeking detectors. NASA then decided to fund a second scan of the sky to look for asteroids and comets, in a project called NEOWISE.

But the images from that second sky scan were designed to catch moving asteroids, not stars and galaxies. Now NASA has funded a project called AllWISE to stack up all the WISE images, including those from the second sky scan, thereby doubling exposure times and making new stars and galaxies visible.

"By stacking up the data, we have created a monster database with dozens of individual measurements on every one of the infrared sources we detect," said Ned Wright of UCLA, the principal investigator of WISE.

One new feature of the enhanced WISE images is the ability to search for nearby stars, especially cooler ones that only show up in infrared light. Objects that are closer to us will appear to move across the sky over time in relation to background stars. This is the same reason why the planets march across our night skies while the stars seem to stay still. With the new atlas, astronomers can look at images of the sky taken six months apart; if something jumps across the images, then it must be located nearby and could be a never-before-seen neighbor.

The new catalog will also help with studies of distant galaxies, bringing those that were invisible to us before out of hiding.

"The extra depth of AllWISE lets us see galaxies so distant that their light was emitted in the first half of the history of the universe," said Peter Eisenhardt, the WISE project scientist at NASA's Jet Propulsion Laboratory, Pasadena, Calif.

In addition to AllWISE, NASA decided to wake up the WISE spacecraft again to search for more asteroids (see http://www.jpl.nasa.gov/news/news.php?release=2013-257 ).

The technical details for accessing the AllWISE data are online at: http://wise2.ipac.caltech.edu/docs/release/allwise/ .

NASA's Jet Propulsion Laboratory, Pasadena, Calif., manages and operates the newly activated NEOWISE mission for NASA's Science Mission Directorate. The WISE mission was selected competitively under NASA's Explorers Program managed by the agency's Goddard Space Flight Center in Greenbelt, Md. The science instrument was built by the Space Dynamics Laboratory in Logan, Utah. The spacecraft was built by Ball Aerospace & Technologies Corp. in Boulder, Colo. Science operations and data processing take place at the Infrared Processing and Analysis Center at the California Institute of Technology in Pasadena. Caltech manages JPL for NASA. More information is online at http://www.nasa.gov/wise and http://wise.astro.ucla.edu and http://www.jpl.nasa.gov/wise .


Whitney Clavin (818) 354-4673
Jet Propulsion Laboratory, Pasadena, Calif.

whitney.clavin@jpl.nasa.gov


Tuesday, March 26, 2013

Galaxies the Way They Were

 A Hubble image of a field of distant galaxies. The CANDELS project has analyzed these and other data to study how galaxies form and evolve in the early universe.  Credit: NASA/Hubble.  Low Resolution Image (jpg)

Galaxies today come very roughly in two types: reddish, elliptically shaped collections of older stars, and bluer, spiral shaped objects dominated by young stars. The conventional wisdom is that the two types are related to one another, ellipticals representing an older, more evolved stage of galaxies. Astronomers have discovered during the past decade that these two categories seem also to apply to galaxies in the early universe. In particular, galaxies so distant from us that their light has been traveling for about eleven and one-half billion years, 84% of the age of the universe, also generally fall into these two groups. 

A major puzzle about these early galaxy types involves their specific properties: Red elliptical galaxies today are generally large in diameter, but in the distant cosmos the corresponding galaxies are much smaller - perhaps five times smaller than local ones of the same mass and much smaller than their blue, star-forming colleagues. If galaxies gain in mass with time, through collisions or other processes, they would be expected also to increase in size with time. Therefore, if the early red galaxies really do represent older stages of bluer objects, then as a class they should be more massive and larger, not smaller. 

The CANDELS project (Cosmic Assembly Near-Infrared Deep Extragalactic Legacy Survey) has acquired a very large database of optical and infrared observations of distant galaxies. Writing in one of their new papers this month, CfA astronomer Matt Ashby and the CANDELS team propose a solution to the dilemma. They studied a set of galaxies whose light has been en route for between about nine and twelve billion years. Based on the measured rates of star formation in blue galaxies inferred from the radiation, they conclude that they have undergone collisions that induce star formation. That's what makes them shine exceptionally brightly. After a billion years or so, however, these starbursts leave many of them depleted in fuel, and as a result the galaxies shrink in size to become the compact red galaxies that are so puzzling. In the later universe star-forming galaxies have grown to considerably larger sizes, and their star formation is consequently spread across much larger volumes, so that the same quenching mechanism does not take place, leaving them to retain their sizes as ellipticals.