
Credit: X-ray: NASA/CXC/Meiji Univ./T. Sato et al.; Image Processing: NASA/CXC/SAO/N. Wolk
JPEG (218 kb) -Large JPEG (3.6 MB) - Tiff (12 MB) - More Images
A Tour of Cassiopeia A - More Videos
This graphic features data from NASA’s Chandra X-ray Observatory of the Cassiopeia A (Cas A) supernova remnant,
a frequent target of the telescope for more than a quarter century. New
Chandra data continues to reveal fresh insight into this debris field
from an exploded star.
In the latest result, astronomers have now used Chandra to learn that
the star’s interior violently rearranged itself mere hours before it
exploded, as outlined in our press release. This discovery helps scientists better understand how massive stars explode and what happens to their remains afterward.
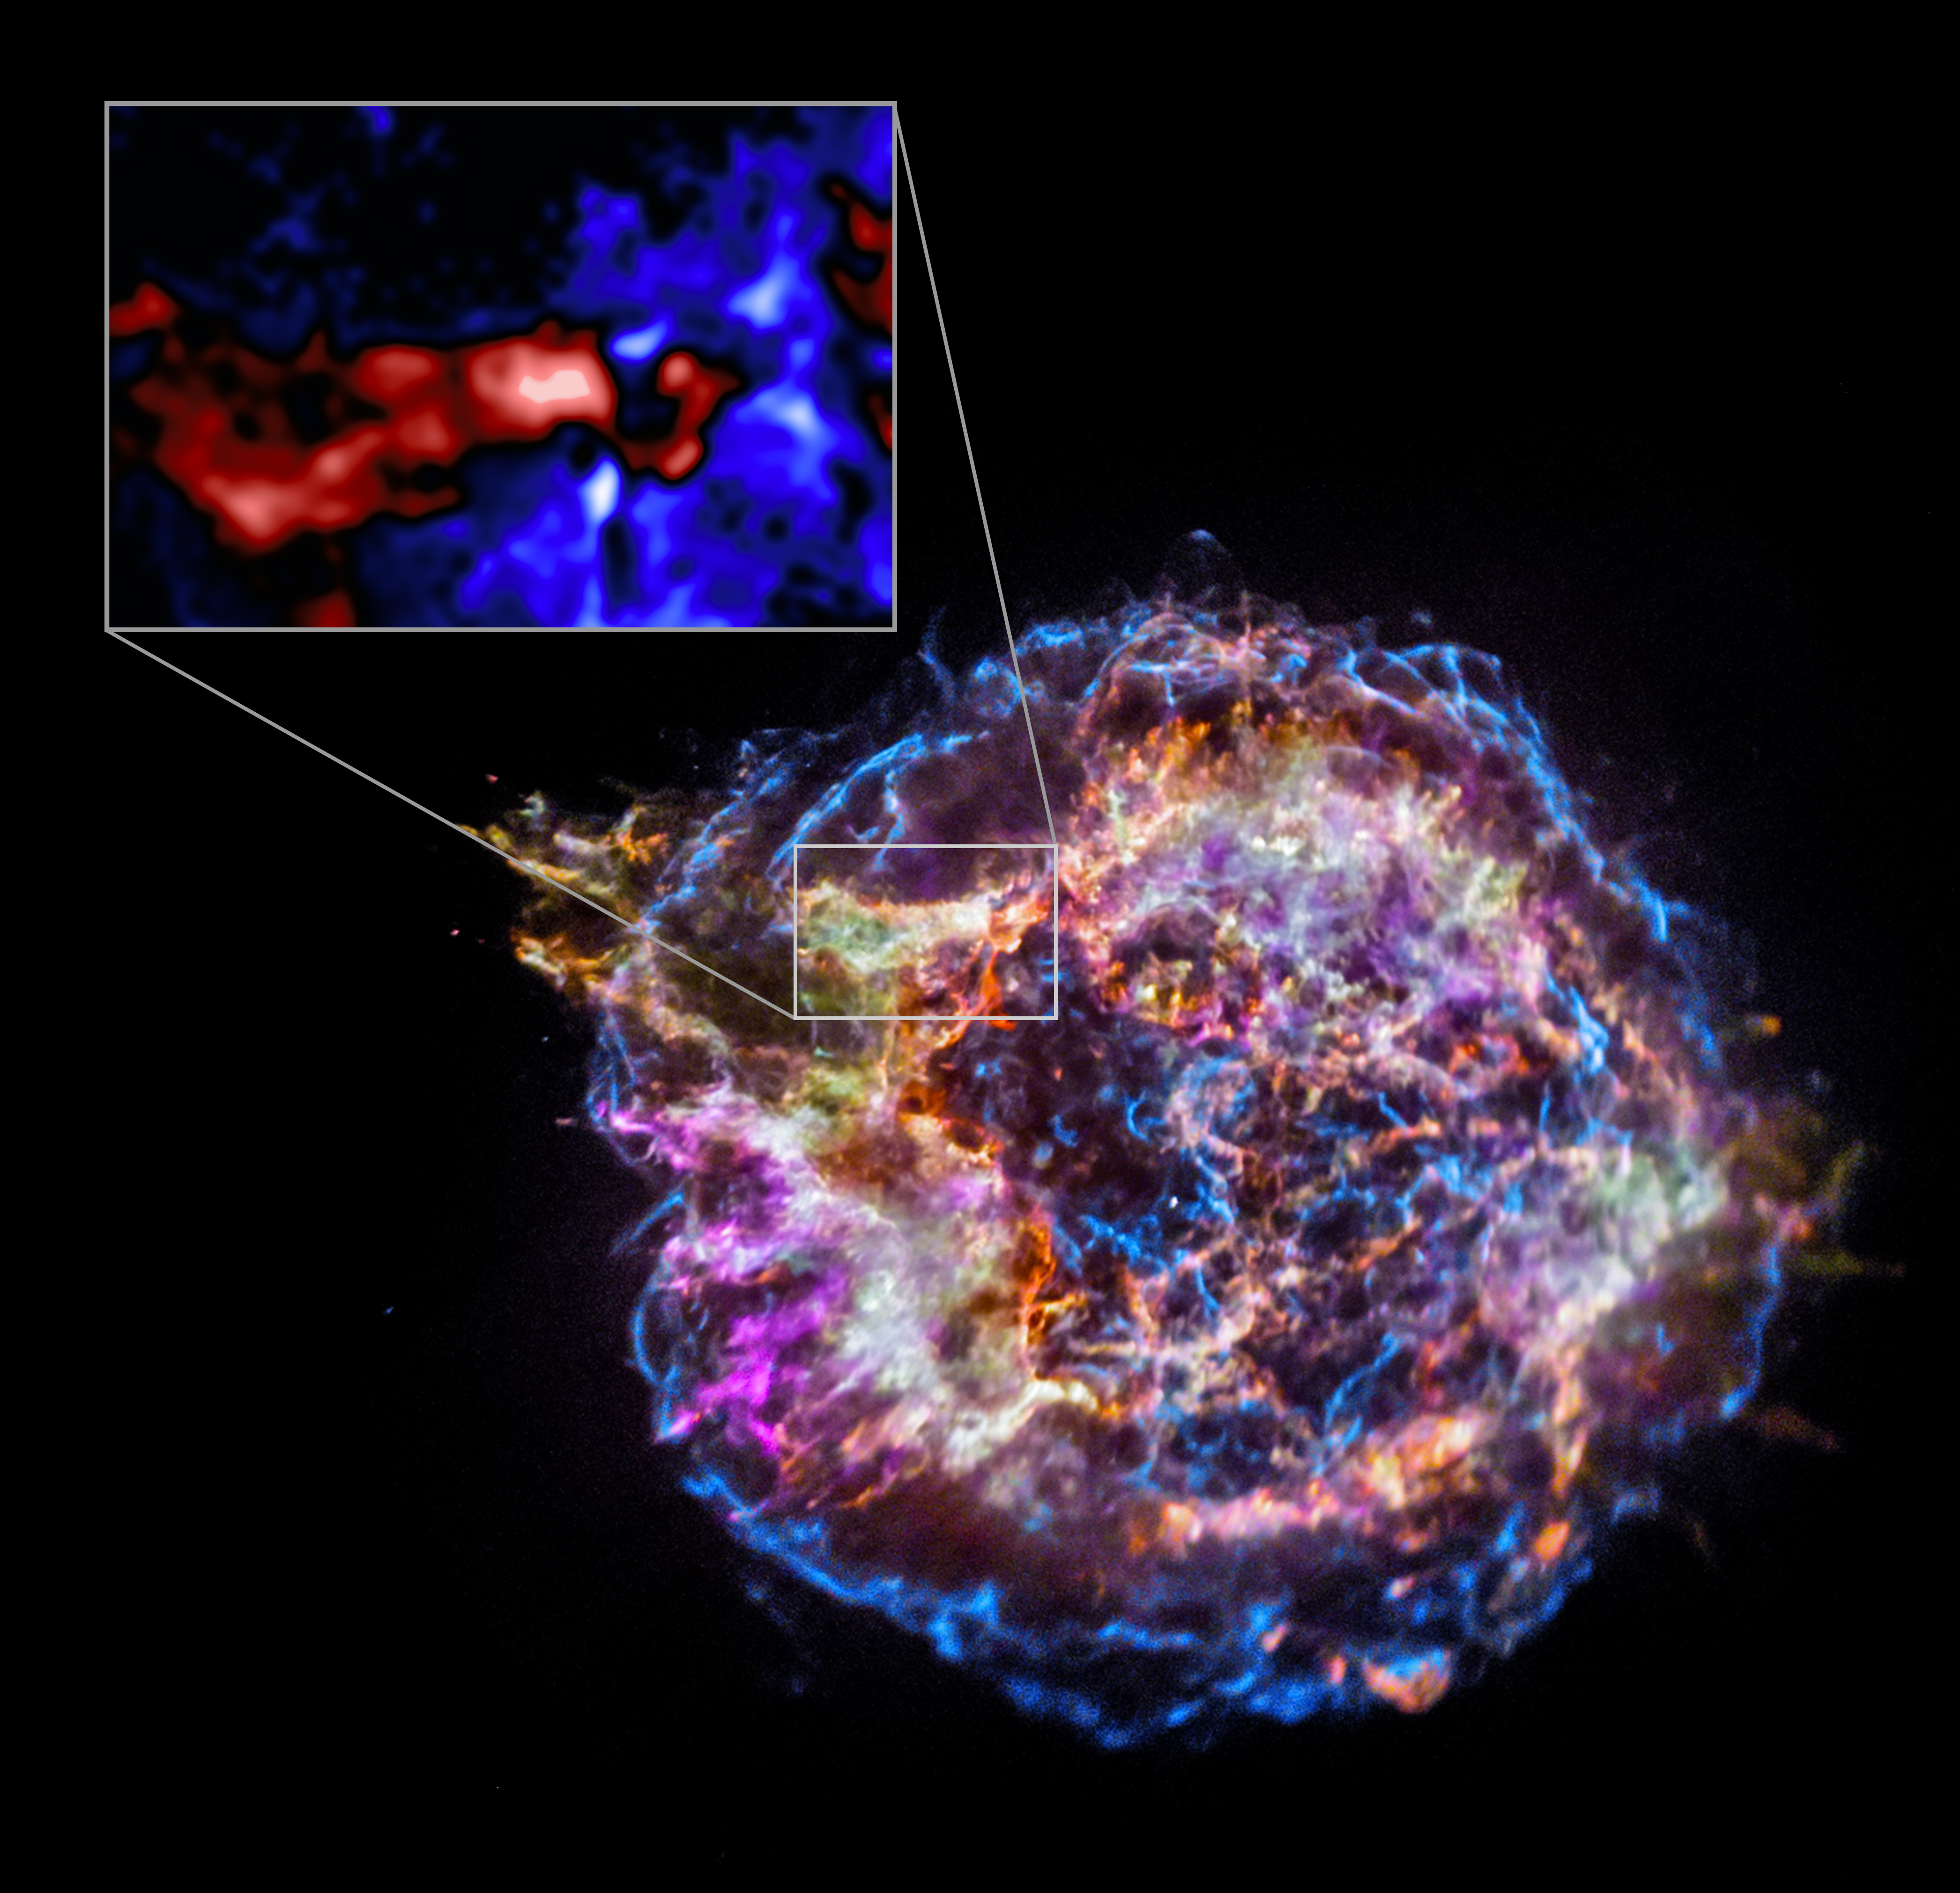
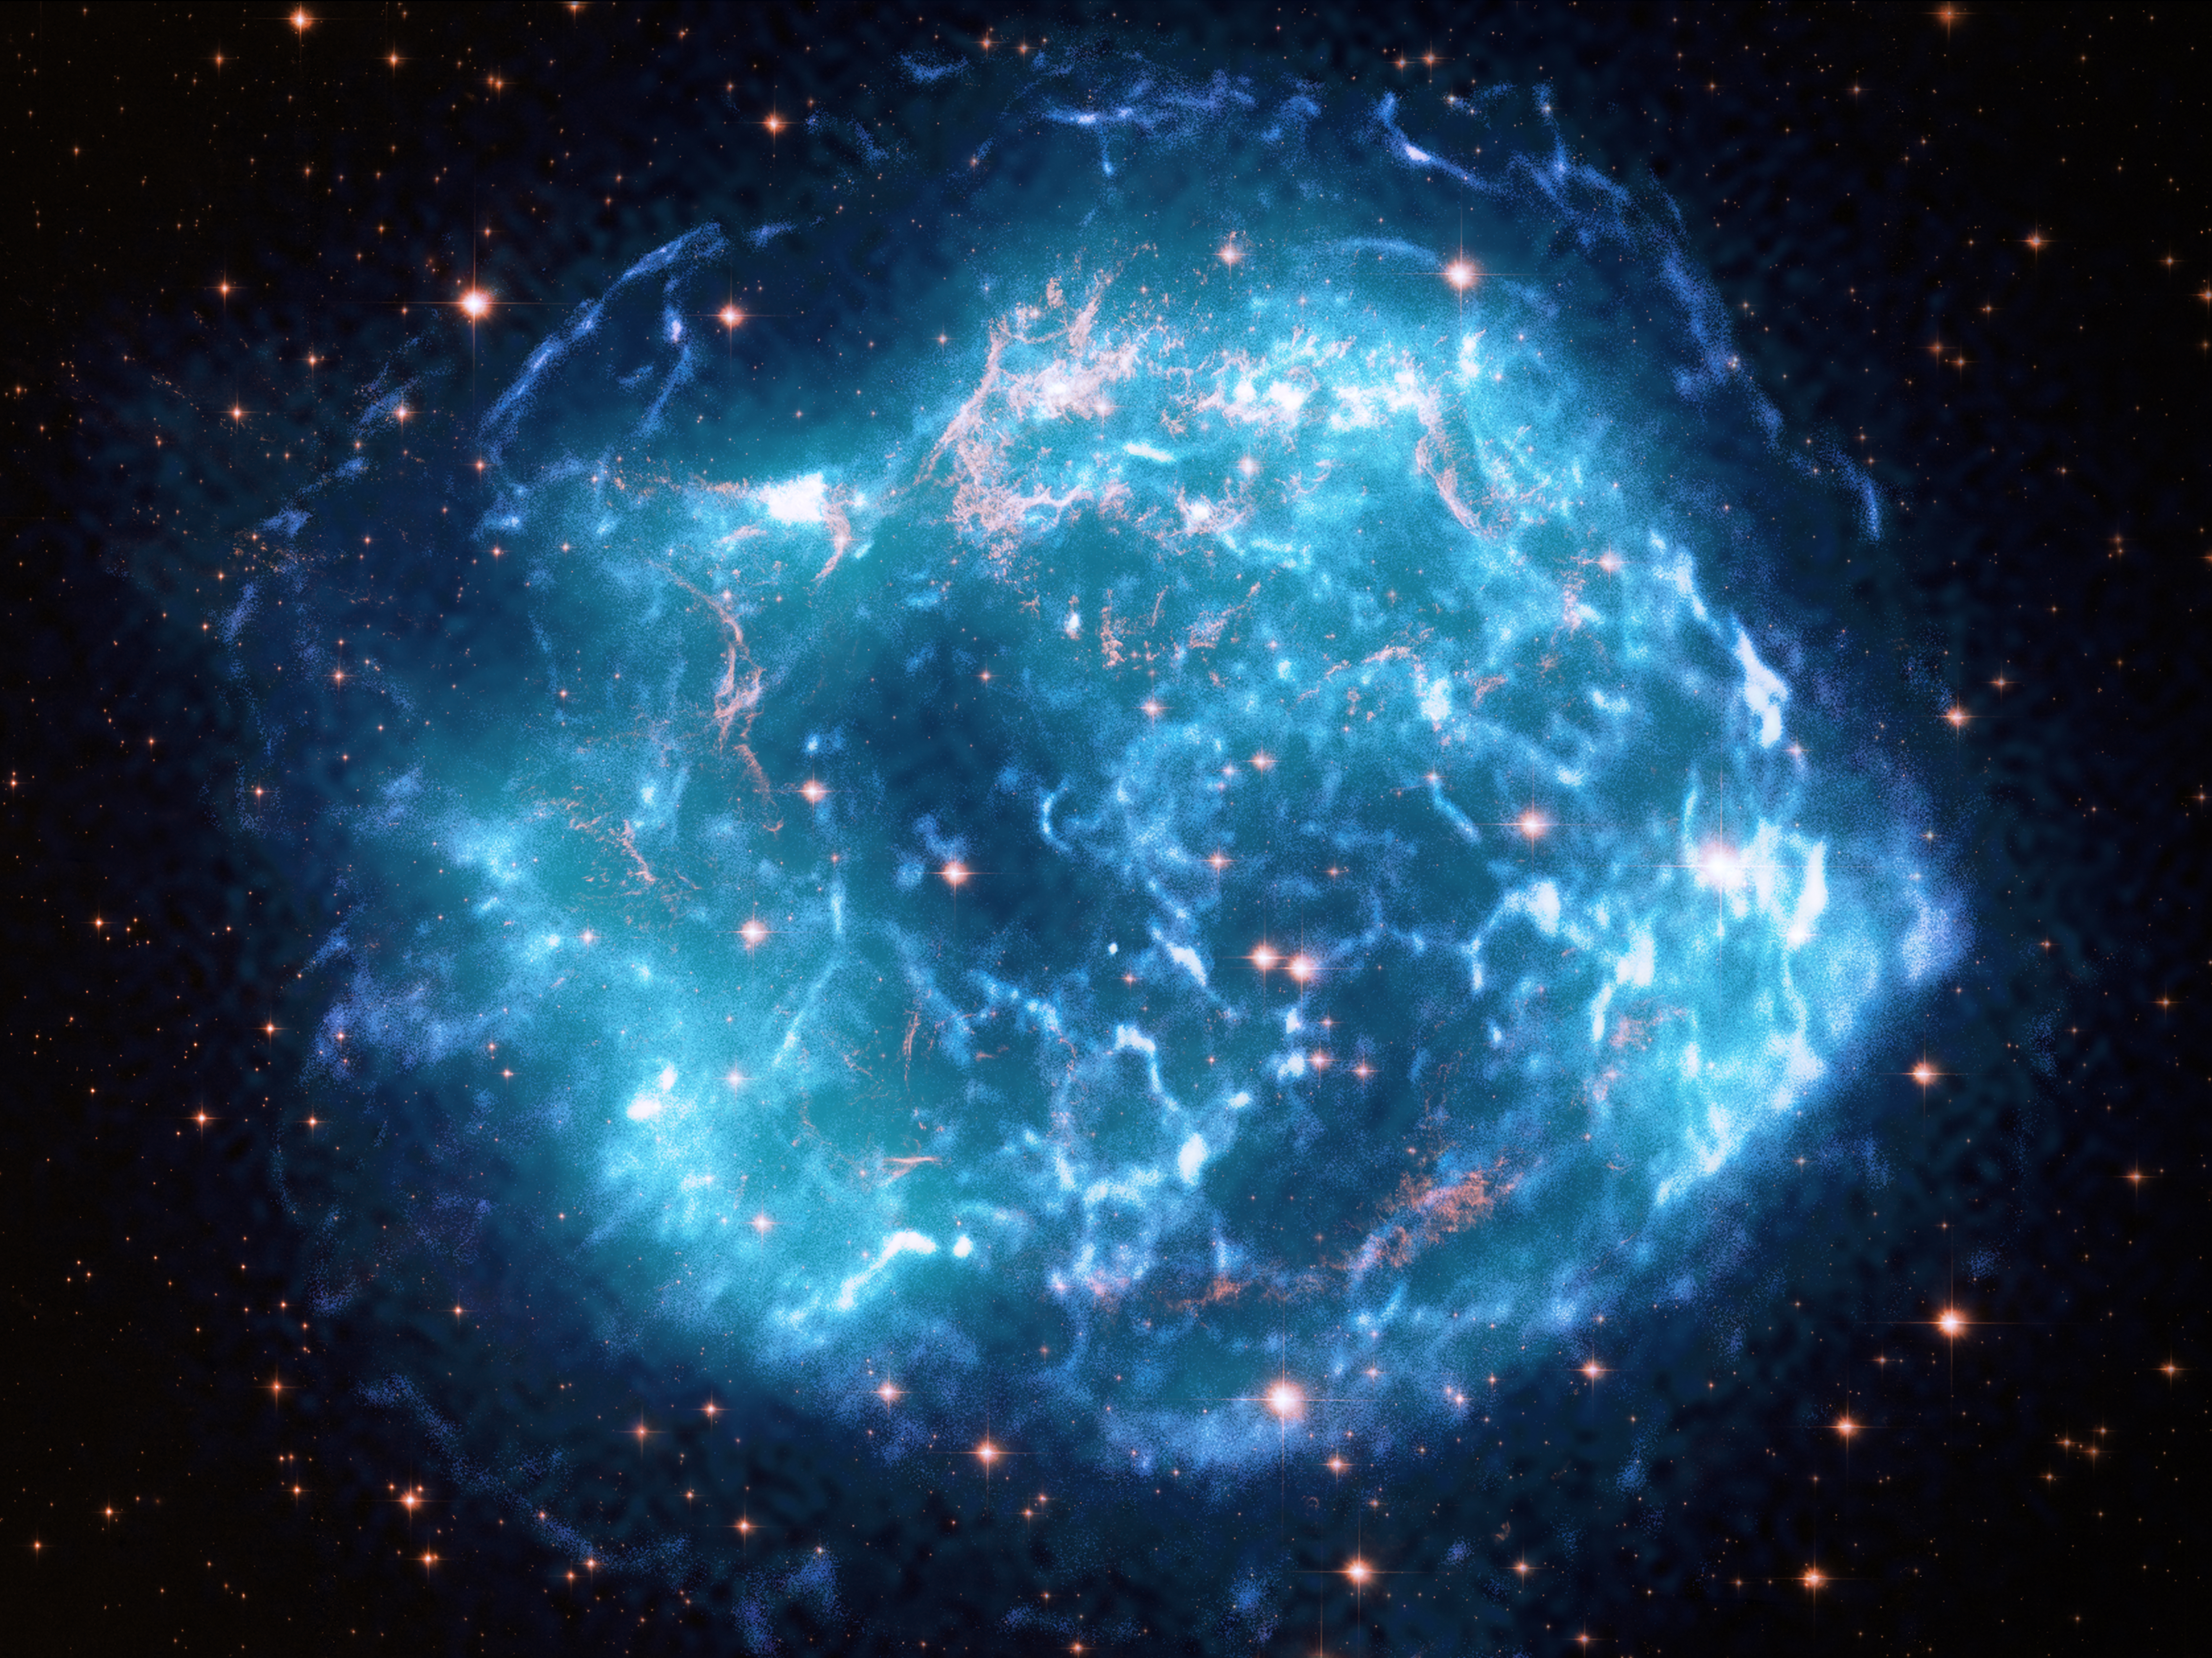
The main panel of this graphic is Chandra data that has been selected to show the location of different elements in the remains of the explosion: silicon (red), sulfur (yellow), calcium (green) and iron (purple). The blue color reveals the highest-energy X-ray emission detected by Chandra in Cas A, with the blue outer ring highlighting the expanding blast wave from the original explosion hundreds of years ago.
The inset to the upper left zooms in a smaller region of Cas A. This reveals data collected by Chandra that picks up relative amounts of silicon and neon. Areas with large amounts of silicon but smaller amounts of neon are labeled as Silicon-rich and Neon-poor, respectively, and are colored red. Alternatively, areas where Chandra detects the opposite — large amounts of neon but smaller amounts of silicon (Neon-rich and Silicon-poor) — are blue.

Cassiopeia A: A labeled version of the main image showing the relative abundances of silicon and neon in the inset. Credit: X-ray: NASA/CXC/Meiji Univ./T. Sato et al.; Image Processing: NASA/CXC/SAO/N. Wolk
These different regions provide crucial information about the supernova's progenitor, the star that exploded to form Cas A. They give evidence that just a few hours before it exploded, the progenitor's onion-like layers of elements in its interior were disrupted. The researchers think that part of an inner layer with large amounts of silicon traveled outwards and broke into a neighboring layer with lots of neon. This upheaval not only caused material rich in silicon to travel outwards, it also forced material rich in neon to travel inwards. Clear traces of these outward silicon flows and inward neon flows in Cas A are shown in the inset image, corresponding to the Silicon-rich and Neon-poor regions, and the Neon-rich and Silicon-poor regions, respectively.
These different regions provide crucial information about the supernova's progenitor, the star that exploded to form Cas A. They give evidence that just a few hours before it exploded, the progenitor's onion-like layers of elements in its interior were disrupted. The researchers think that part of an inner layer with large amounts of silicon traveled outwards and broke into a neighboring layer with lots of neon. This upheaval not only caused material rich in silicon to travel outwards, it also forced material rich in neon to travel inwards. Clear traces of these outward silicon flows and inward neon flows in Cas A are shown in the inset image, corresponding to the Silicon-rich and Neon-poor regions, and the Neon-rich and Silicon-poor regions, respectively.

This illustrated figure shows a cross-section of a massive star similar to the one that created the Cas A supernova remnant. The onion-like layers are dominated by heavier and heavier elements, beginning with hydrogen, and extending to helium, carbon, oxygen, silicon and iron in the center of the star. The cross-section is shown a few hours before the star's explosion as a supernova. Silicon-rich material made in nuclear reactions involving oxygen (in the narrow "O-burning shell"), are buoyant and push outwards in silicon-rich plumes, forcing neon-rich material further out to flow inwards. The motion of these silicon-rich and neon-rich materials disrupt the narrow shell where carbon and neon are undergoing nuclear reactions (the narrow "C-/Ne-burning shell"). Credit: NASA/CXC/Meiji Univ./T. Sato et al.
Because Chandra observes the elements are not smoothly mixed in the remnant now, it suggests there was not complete mixing of the silicon and neon with other elements immediately before or after the explosion.
These results have been published in the latest issue of The Astrophysical Journal and are available online. The authors of the study are Toshiki Sato (Meiji University in Japan), Kai Matsunga (Kyoto University in Japan), Hiroyuki Uchida (Kyoto), Satoru Katsuda (Saitama University in Japan), Koh Takahashi (National Astronomical Observatory of Japan), Hideyuki Umeda (University of Toyko in Japan), Tomoya Takiwaki (NAOJ), Ryo Sawada (University of Toyko), Takashi Yoshida (Kyoto), Ko Nakamura (Fukuoka University in Japan), Yui Kuboike (Meiji), Paul Plucinsky (Center for Astrophysics | Harvard & Smithsonian), and Jack Hughes (Rutgers University).
NASA's Marshall Space Flight Center in Huntsville, Alabama, manages the Chandra program. The Smithsonian Astrophysical Observatory's Chandra X-ray Center controls science operations from Cambridge, Massachusetts, and flight operations from Burlington, Massachusetts.
Source: NASA’s Chandra X-ray Observatory
Visual Description:
This release features a composite image of Cassiopeia A, a donut-shaped supernova remnant located about 11,000 light-years from Earth. Included in the image is an inset closeup, which highlights a region with relative abundances of silicon and neon.
Over three hundred years ago, Cassiopeia A, or Cas A, was a star on the brink of self-destruction. In composition it resembled an onion with layers rich in different elements such as hydrogen, helium, carbon, silicon, sulfur, calcium, and neon, wrapped around an iron core. When that iron core grew beyond a certain mass, the star could no longer support its own weight. The outer layers fell into the collapsing core, then rebounded as a supernova. This explosion created the donut-like shape shown in the composite image. The shape is somewhat irregular, with the thinner quadrant of the donut to the upper left of the off-center hole.
In the body of the donut, the remains of the star's elements create a mottled cloud of colors, marbled with red and blue veins. Here, sulfur is represented by yellow, calcium by green, and iron by purple. The red veins are silicon, and the blue veins, which also line the outer edge of the donut-shape, are the highest energy X-rays detected by Chandra and show the explosion's blast wave.
The inset uses a different color code and highlights a colorful, mottled region at the thinner, upper left quadrant of Cas A. Here, rich pockets of silicon and neon are identified in the red and blue veins, respectively. New evidence from Chandra indicates that in the hours before the star's collapse, part of a silicon-rich layer traveled outwards, and broke into a neighboring neon-rich layer. This violent breakdown of layers created strong turbulent flows and may have promoted the development of the supernova's blast wave, facilitating the star's explosion. Additionally, upheaval in the interior of the star may have produced a lopsided explosion, resulting in the irregular shape, with an off-center hole (and a thinner bite of donut!) at our upper left.
Fast Facts for Cassiopeia A:
Scale: Image is about 12.2 arcmin (39 light-years) across.
Category: Supernovas & Supernova Remnants
Coordinates (J2000): RA 23h 23m 26.7s | Dec +58° 49´ 03.00"
Constellation: Cassiopeia
Observation Dates: Nine observations in 2004: Feb 8, Apr 14, 18, 20, 22, 25 28, May 01, 05
Observation Time: 278 hours (11 days 14 hours)
Obs. ID: 4634-4639, 5196, 5319-5320
Instrument: ACIS
Also Known As: Cas A
References: Sato, T. et al, 2025, Accepted; arXiv:2507.07563.
Color Code: X-ray: red, green, blue; Inset: red, white, blue
Distance Estimate: About 11,000 light-years


