Showing posts with label Great Red Spot (GRS). Show all posts

Monday, October 14, 2024

NASA's Hubble Watches Jupiter's Great Red Spot Behave Like a Stress Ball

Close-up of Jupiter's Great Red Spot (8-Panel)Using Hubble Space Telescope data spanning approximately 90 days (between December 2023 and March 2024) when the giant planet Jupiter ranged from 391 million to 512 million miles from the Sun, astronomers measured the Great Red Spot's size, shape, brightness, color, and vorticity over one full oscillation cycle. The data reveal that the Great Red Spot is not as stable as it might look. It was observed going through an oscillation in its elliptical shape, jiggling like a bowl of gelatin. The cause of the 90-day oscillation is unknown. Credits: Science: NASA, ESA, Amy Simon (NASA-GSFC)/ Image Processing: Joseph DePasquale (STScI)

Using Hubble Space Telescope data spanning approximately 90 days (between December 2023 and March 2024) when the giant planet Jupiter ranged from 391 million to 512 million miles from the Sun, astronomers measured the Great Red Spot's size, shape, brightness, color, and vorticity over a full oscillation cycle. The data reveal that the Great Red Spot is not as stable as it might look. It was observed going through an oscillation in its elliptical shape, jiggling like a bowl of gelatin. The cause of the 90-day oscillation is unknown. The observation is part of the observing programs led by Amy Simon of NASA's Goddard Space Flight Center in Greenbelt, Maryland. Credits: Science: NASA, ESA, Amy Simon (NASA-GSFC)/ Image Processing: Joseph DePasquale (STScI)


This time-lapse movie is assembled from Hubble Space Telescope observations spanning approximately 90 days (between December 2023 and March 2024) when the giant planet Jupiter ranged from 391 million to 512 million miles from the Sun. Astronomers measured the Great Red Spot's size, shape, brightness, color, and vorticity over a full oscillation cycle. The data reveal that the Great Red Spot is not as stable as it might look. It was observed going through an oscillation in its elliptical shape, jiggling like a bowl of gelatin. The cause of the 90-day oscillation is unknown.Credits: Science: NASA, ESA, Amy Simon (NASA-GSFC)/ Image Processing: Joseph DePasquale (STScI)

This animated diagram shows the position of Earth relative to Jupiter during a period spanning approximately 90 days (between December 2023 and March 2024) when the giant planet Jupiter ranged from 391 million to 512 million miles from the Sun. During this period the Hubble Space telescope monitored changes in Jupiter's atmosphere as part of the observing programs led by Amy Simon of NASA Goddard Space Flight Center in Greenbelt, Maryland. Jupiter's orbital period is approximately 12 years. The angular size of the planet shrinks in Hubble's view, as faster-moving Earth pulls ahead of the giant planet. Credits Video: NASA, ESA, Joseph DePasquale (STScI)


Astronomers have observed Jupiter's legendary Great Red Spot (GRS), an anticyclone large enough to swallow Earth, for at least 150 years. But there are always new surprises – especially when NASA's Hubble Space Telescope takes a close-up look at it.

Hubble's new observations of the famous red storm, collected 90 days between December 2023 to March 2024, reveal that the GRS is not as stable as it might look. The recent data show the GRS jiggling like a bowl of gelatin. The combined Hubble images allowed astronomers to assemble a time-lapse movie of the squiggly behavior of the GRS.

"While we knew its motion varies slightly in its longitude, we didn't expect to see the size oscillate as well. As far as we know, it's not been identified before," said Amy Simon of NASA's Goddard Space Flight Center in Greenbelt, Maryland, lead author of the science paper published in The Planetary Science Journal. "This is really the first time we've had the proper imaging cadence of the GRS. With Hubble's high resolution we can say that the GRS is definitively squeezing in and out at the same time as it moves faster and slower. That was very unexpected, and at present there are no hydrodynamic explanations."

Hubble monitors Jupiter and the other outer solar system planets every year through the Outer Planet Atmospheres Legacy program (OPAL) led by Simon, but these observations were from a program dedicated to the GRS. Understanding the mechanisms of the largest storms in the solar system puts the theory of hurricanes on Earth into a broader cosmic context, which might be applied to better understanding the meteorology on planets around other stars.

Simon's team used Hubble to zoom in on the GRS for a detailed look at its size, shape, and any subtle color changes. "When we look closely, we see a lot of things are changing from day to day," said Simon. This includes ultraviolet-light observations showing that the distinct core of the storm gets brightest when the GRS is at its largest size in its oscillation cycle. This indicates less haze absorption in the upper atmosphere.

"As it accelerates and decelerates, the GRS is pushing against the windy jet streams to the north and south of it," said co-investigator Mike Wong of the University of California at Berkeley. "It's similar to a sandwich where the slices of bread are forced to bulge out when there's too much filling in the middle." Wong contrasted this to Neptune, where dark spots can drift wildly in latitude without strong jet streams to hold them in place. Jupiter's Great Red Spot has been held at a southern latitude, trapped between the jet streams, for the extent of Earth-bound telescopic observations.

The team has continued watching the GRS shrink since the OPAL program began 10 years ago. They predict it will keep shrinking before taking on a stable, less-elongated, shape. "Right now it's over-filling its latitude band relative to the wind field. Once it shrinks inside that band the winds will really be holding it in place," said Simon. The team predicts that the GRS will probably stabilize in size, but for now Hubble only observed it for one oscillation cycle.

The researchers hope that in the future other high-resolution images from Hubble might identify other Jovian parameters that indicate the underlying cause of the oscillation.

The results are being presented at the 56th annual meeting of the American Astronomical Society Division for Planetary Sciences, in Boise, Idaho.

The Hubble Space Telescope has been operating for over three decades and continues to make ground-breaking discoveries that shape our fundamental understanding of the universe. Hubble is a project of international cooperation between NASA and ESA (European Space Agency). NASA's Goddard Space Flight Center in Greenbelt, Maryland, manages the telescope and mission operations. Lockheed Martin Space, based in Denver, Colorado, also supports mission operations at Goddard. The Space Telescope Science Institute in Baltimore, Maryland, which is operated by the Association of Universities for Research in Astronomy, conducts Hubble science operations for NASA.


About This Release

Credits:

Media Contact:

Ray Villard:
Space Telescope Science Institute, Baltimore, Maryland

Science Contact:

Amy Simon
NASA Goddard Space Flight Center, Greenbelt, Maryland

Michael H. Wong
University of California, Berkeley, Berkeley, California

Permissions: Content Use Policy

Contact Us: Direct inquiries to the News Team.

Related Links and Documents


Friday, September 18, 2020

Hubble’s Crisp New Image of Jupiter and Europa

Hubble’s Crisp New Image of Jupiter and Europa 
 
Hubble’s New Rainbow View of Jupiter
 
Hubble’s New Views of Jupiter


Videos 
 
Hubble’s New Views of Jupiter


This latest image of Jupiter, taken by the NASA/ESA Hubble Space Telescope on 25 August 2020, was captured when the planet was 653 million kilometres from Earth. Hubble’s sharp view is giving researchers an updated weather report on the monster planet’s turbulent atmosphere, including a remarkable new storm brewing, and a cousin of the Great Red Spot changing colour — again. The new image also features Jupiter’s icy moon Europa.

A unique and exciting detail of Hubble’s new snapshot appears at mid-northern latitudes as a bright, white, stretched-out storm moving at 560 kilometres per hour. This single plume erupted on 18 August 2020 and another has since appeared.

While it’s common for storms to pop up in this region, often several at once, this particular disturbance appears to have more structure behind it than observed in previous storms. Trailing behind the plume are small, counterclockwise dark clumps also not witnessed in the past. Researchers speculate this may be the beginning of a longer-lasting northern hemisphere spot, perhaps to rival the legendary Great Red Spot that dominates the southern hemisphere.

Hubble shows that the Great Red Spot, rolling counterclockwise in the planet’s southern hemisphere, is ploughing into the clouds ahead of it, forming a cascade of white and beige ribbons. The Great Red Spot is currently an exceptionally rich red colour, with its core and outermost band appearing deeper red.

Researchers say the Great Red Spot now measures about 15 800 kilometres across, big enough to swallow the Earth. The super-storm is still shrinking, as noted in telescopic observations dating back to 1930, but its rate of shrinkage appears to have slowed. The reason for its dwindling size is a complete mystery.

Researchers are noticing that another feature has changed: the Oval BA, nicknamed by astronomers as Red Spot Jr., which appears just below the Great Red Spot in this image. For the past few years, Red Spot Jr. has been fading in colour to its original shade of white after appearing red in 2006. However, now the core of this storm appears to be darkening to a reddish hue. This could hint that Red Spot Jr. is on its way to reverting to a colour more similar to that of its cousin.

Hubble’s image shows that Jupiter is clearing out its higher-altitude white clouds, especially along the planet’s equator, which is enveloped in an orangish hydrocarbon smog.

Jupiter’s icy moon Europa is visible to the left of the gas giant. Europa is already thought to harbour a liquid ocean beneath its icy crust, making this moon one of the main targets in the search for habitable worlds beyond Earth. In 2013 it was announced that the Hubble Space Telescope discovered water vapour erupting from the frigid surface of Europa, in one or more localised plumes near its south pole. ESA's JUpiter ICy moons Explorer, a mission planned for launch in 2022, aims to explore both Jupiter and three of its largest moons: Ganymede, Callisto, and Europa.

Hubble also captured a new multiwavelength observation in ultraviolet/visible/near-infrared light of Jupiter on 25 August 2020, which is giving researchers an entirely new view of the giant planet. Hubble’s near infrared imaging, combined with ultraviolet views, provides a unique panchromatic look that offers insights into the altitude and distribution of the planet’s haze and particles. This complements Hubble’s visible-light picture that shows the ever-changing cloud patterns.

Source: ESA/Hubble/News


Notes

These new Hubble images form part of yearly maps of the entire planet taken under the Outer Planets Atmospheres Legacy programme, or OPAL. The programme provides yearly Hubble global views of the outer planets to look for changes in their storms, winds, and clouds.


More Information 
 

The Hubble Space Telescope is a project of international cooperation between ESA and NASA.

Image credit: NASA, ESA, A. Simon (Goddard pace Flight Center), and M. H. Wong (University of California, Berkeley) and the OPAL team.


Links
 
Bethany Downer
ESA/Hubble, Public Information Officer
Garching, Germany
Email: Bethany.Downer@partner.eso.org
 

Thursday, May 07, 2020

Hubble and Gemini watch from afar, capturing high-resolution global views of Jupiter that are key to interpreting Juno's close-up observations of the planet

These images of Jupiter's Great Red Spot were made using data collected by the Hubble Space Telescope and the Gemini Observatory on April 1, 2018. By combining observations captured at almost the same time from the two different observatories, astronomers were able to determine that dark features on the Great Red Spot are holes in the clouds rather than masses of dark material. Credit: NASA, ESA, and M.H. Wong (UC Berkeley) and team. Release image

NASA's Hubble Space Telescope and the ground-based Gemini Observatory in Hawaii have teamed up with the Juno spacecraft to probe the mightiest storms in the solar system, taking place more than 500 million miles away on the giant planet Jupiter.

A team of researchers led by Michael Wong at the University of California, Berkeley, and including Amy Simon of NASA's Goddard Space Flight Center in Greenbelt, Maryland, and Imke de Pater also of UC Berkeley, are combining multiwavelength observations from Hubble and Gemini with close-up views from Juno's orbit about the monster planet, gaining new insights into turbulent weather on this distant world.

"We want to know how Jupiter's atmosphere works," said Wong. This is where the teamwork of Juno, Hubble, and Gemini comes into play.

Radio "Light Show"

Jupiter's constant storms are gigantic compared to those on Earth, with thunderheads reaching 40 miles from base to top—five times taller than typical thunderheads on Earth—and powerful lightning flashes up to three times more energetic than Earth's largest "superbolts."

Like lightning on Earth, Jupiter's lightning bolts act like radio transmitters, sending out radio waves as well as visible light when they flash across the sky.

Every 53 days, Juno races low over the storm systems detecting radio signals known as "sferics" and "whistlers," which can then be used to map lightning even on the day side of the planet or from deep clouds where flashes are not otherwise visible.

Coinciding with each pass, Hubble and Gemini watch from afar, capturing high-resolution global views of the planet that are key to interpreting Juno's close-up observations. "Juno's microwave radiometer probes deep into the planet's atmosphere by detecting high-frequency radio waves that can penetrate through the thick cloud layers. The data from Hubble and Gemini can tell us how thick the clouds are and how deep we are seeing into the clouds," Amy Simon explained.

By mapping lightning flashes detected by Juno onto optical images captured of the planet by Hubble and thermal infrared images captured at the same time by Gemini, the research team has been able to show that lightning outbreaks are associated with a three-way combination of cloud structures: deep clouds made of water, large convective towers caused by upwelling of moist air—essentially Jovian thunderheads—and clear regions presumably caused by downwelling of drier air outside the convective towers.

The Hubble data show the height of the thick clouds in the convective towers, as well as the depth of deep water clouds. The Gemini data clearly reveal the clearings in the high-level clouds where it is possible to get a glimpse down to the deep water clouds.

Wong thinks that lightning is common in a type of turbulent area known as folded filamentary regions, which suggests that moist convection is occurring in them. "These cyclonic vortices could be internal energy smokestacks, helping release internal energy through convection. It doesn't happen everywhere, but something about these cyclones seems to facilitate convection."

The ability to correlate lightning with deep water clouds also gives researchers another tool for estimating the amount of water in Jupiter's atmosphere, which is important for understanding how Jupiter and the other gas and ice giants formed, and therefore how the solar system as a whole formed.

While much has been gleaned about Jupiter from previous space missions, many of the details—including how much water is in the deep atmosphere, exactly how heat flows from the interior, and what causes certain colors and patterns in the clouds—remain a mystery. The combined result provides insight into the dynamics and three-dimensional structure of the atmosphere.

Seeing a "Jack-O-Lantern" Red Spot

With Hubble and Gemini observing Jupiter more frequently during the Juno mission, scientists are also able to study short-term changes and short-lived features like those in the Great Red Spot.

Images from Juno as well as previous missions to Jupiter revealed dark features within the Great Red Spot that appear, disappear, and change shape over time. It was not clear from individual images whether these are caused by some mysterious dark-colored material within the high cloud layer, or if they are instead holes in the high clouds—windows into a deeper, darker layer below.

Now, with the ability to compare visible-light images from Hubble with thermal infrared images from Gemini captured within hours of each other, it is possible to answer the question. Regions that are dark in visible light are very bright in infrared, indicating that they are, in fact, holes in the cloud layer. In cloud-free regions, heat from Jupiter's interior that is emitted in the form of infrared light—otherwise blocked by high-level clouds—is free to escape into space and therefore appears bright in Gemini images.

"It's kind of like a jack-o-lantern," said Wong. "You see bright infrared light coming from cloud-free areas, but where there are clouds, it's really dark in the infrared."

Hubble and Gemini as Jovian Weather Trackers

The regular imaging of Jupiter by Hubble and Gemini in support of the Juno mission is proving valuable in studies of many other weather phenomena as well, including changes in wind patterns, characteristics of atmospheric waves, and the circulation of various gases in the atmosphere.

Hubble and Gemini can monitor the planet as a whole, providing real-time base maps in multiple wavelengths for reference for Juno's measurements in the same way that Earth-observing weather satellites provide context for NOAA's high-flying Hurricane Hunters.

"Because we now routinely have these high-resolution views from a couple of different observatories and wavelengths, we are learning so much more about Jupiter's weather," explained Simon. "This is our equivalent of a weather satellite. We can finally start looking at weather cycles."

Because the Hubble and Gemini observations are so important for interpreting Juno data, Wong and his colleagues Simon and de Pater are making all of the processed data easily accessible to other researchers through the Mikulski Archives for Space Telescopes (MAST) at the Space Telescope Science Institute in Baltimore, Maryland.

"What's important is that we've managed to collect this huge dataset that supports the Juno mission. There are so many applications of the data set that we may not even anticipate. So, we're going to enable other people to do science without that barrier of having to figure out on their own how to process the data," Wong said.

The results were published in April 2020 in The Astrophysical Journal Supplement Series.

The Hubble Space Telescope is a project of international cooperation between NASA and the European Space Agency (ESA). NASA's Goddard Space Flight Center in Greenbelt, Maryland, manages the telescope. The Space Telescope Science Institute (STScI) in Baltimore, Maryland, conducts Hubble science operations. STScI is operated for NASA by the Association of Universities for Research in Astronomy (AURA) in Washington, D.C. AURA operates the Gemini Observatory for the international Gemini partnership including the US, Canada, Chile, Argentina, Brazil, and the Republic of Korea. NASA's Jet Propulsion Laboratory in Pasadena, California, manages the Juno mission for the Southwest Research Institute in San Antonio, Texas. Juno is part of NASA's New Frontiers Program, which is managed at NASA's Marshall Space Flight Center in Huntsville, Alabama for NASA's Science Mission Directorate.


Contact

Margaret W. Carruthers / Ray Villard
Space Telescope Science Institute, Baltimore, Maryland
667-218-6427 / 410-338-4514

mcarruthers@stsci.edu / villard@stsci.edu

Michael H. Wong
UC Berkeley, Berkeley, California

mikewong@astro.berkeley.edu

Amy Simon
Goddard Space Flight Center, Greenbelt, Maryland

amy.simon@nasa.gov


Related Links


Monday, August 26, 2019

Storms on Jupiter Seen by Multi-Wavelength Observations

Figure 1: Subaru/COMICS map of Jupiter at 8.70 microns. Images recorded over the four consecutive nights (January 11-14, 2017) were stitched together to produce an image over 360 degrees in longitude. Several features are indicated on the map (Great Red Spot (GRS), Oval BA (BA), Source SEB Outbreak by arrow #1, Vortices by arrow #3, Hot Spots by arrow #4, and Large Plumes by arrow #5). (Credit: Imke de Pater et al.)

Multi-wavelength measurements from telescopes worldwide capture the eruption of storms in Jupiter's northern and southern equatorial belts.

Astronomers using the Subaru Telescope contributed to coordinated observations of the planet in January 2017, joining observers using the Atacama Large Millimeter/Submillimeter Array (ALMA), the Very Large Array (VLA), NASA's Hubble Space Telescope (HST), the Gemini North Telescope, the Very Large Telescope (VLT), and the W. M. Keck Telescope in tracking the effects of these storms - visible as bright plumes above the planet's main ammonia ice cloud deck over which they appear. The rising plumes then interacted with Jupiter's powerful winds, which stretched the clouds far from their points of origin.

These multi-wavelength, coordinated observations are consistent with one theory, known as moist convection, about how these plumes form. According to this theory, upwelling winds carry a mix of ammonia and water vapor high enough for the water to condense into liquid droplets. The condensing water releases heat that expands the cloud and buoys it quickly upward through other cloud layers, ultimately breaking through the ammonia ice clouds at the top of the atmosphere.

"Mid-infrared images of Jupiter from the Subaru Telescope and the Very Large Telescope and ALMA radio observations indicate the plumes are dark at wavelengths where ammonia gas absorbs", said Glenn Orton of Caltech's Jet Propulsion Laboratory in the United States. "This demonstrates the plumes are rich in ammonia gas, which supports the theory they are driven by moist convection." Yasumasa Kasaba of Tohoku University in Japan added "this is a great example of using coordinated observations over several wavelength regimes to improve the understanding of atmospheric phenomena on other planets".

The observations will ultimately help planetary scientists understand the complex atmospheric dynamics on Jupiter, which, with its Great Red Spot and colorful bands, make it one of the most beautiful and changeable of the giant gas planets in the solar system.

Figure 2: HST map at optical wavelengths from 11 January, 2017, with the zonal wind profile superimposed. 
Credit: Imke de Pater et al.

These results are described in a paper led by Dr. Imke de Pater of UC Berkeley that will be published by the Astronomical Journal online. Glenn Orton, James Sinclair of Caltech's Jet Propulsion Laboratory and Yasumasa Kasaba of Tohoku University in Japan contributed the Subaru mid-infrared images using the COMICS instrument. Among the other co-authors of the paper are graduate students Chris Moeckel and Charles Goullaud and research astronomers Michael Wong and David DeBoer, of UC Berkeley; Robert Sault of the University of Melbourne in Australia; and Bryan Butler of the National Radio Astronomy Observatory. Each was involved in obtaining and analyzing the Hubble, Gemini, ALMA and VLA data, respectively. Leigh Fletcher and Padraig Donnelly of the University of Leicester in the United Kingdom supplied the VLT data. Gordon Bjoraker of the NASA Goddard Space Flight Center in Maryland and Máté Ádámkovics of Clemson University in South Carolina were responsible for the Keck data.

A part of the Subaru Telescope observations presented in the paper were observed through the Keck-Subaru exchange program.


Links:


Sunday, August 11, 2019

Hubble's New Portrait of Jupiter

Jupiter
Credits: NASA, ESA, A. Simon (Goddard Space Flight Center), and M.H. Wong (University of California, Berkeley).

This Hubble Space Telescope image highlights the distinct bands of roiling clouds that are characteristic of Jupiter's atmosphere. Credits: NASA, ESA, A. Simon (Goddard Space Flight Center), and M.H. Wong (University of California, Berkeley).

This new Hubble Space Telescope view of Jupiter, taken on June 27, 2019, reveals the giant planet's trademark Great Red Spot, and a more intense color palette in the clouds swirling in Jupiter's turbulent atmosphere than seen in previous years. The colors, and their changes, provide important clues to ongoing processes in Jupiter's atmosphere.

The bands are created by differences in the thickness and height of the ammonia ice clouds. The colorful bands, which flow in opposite directions at various latitudes, result from different atmospheric pressures. Lighter bands rise higher and have thicker clouds than the darker bands.

Among the most striking features in the image are the rich colors of the clouds moving toward the Great Red Spot, a storm rolling counterclockwise between two bands of clouds. These two cloud bands, above and below the Great Red Spot, are moving in opposite directions. The red band above and to the right (northeast) of the Great Red Spot contains clouds moving westward and around the north of the giant tempest. The white clouds to the left (southwest) of the storm are moving eastward to the south of the spot.

All of Jupiter's colorful cloud bands in this image are confined to the north and south by jet streams that remain constant, even when the bands change color. The bands are all separated by winds that can reach speeds of up to 400 miles (644 kilometers) per hour.

On the opposite side of the planet,the band of deep red color northeast of the Great Red Spot and the bright white band to the southeast of it become much fainter. The swirling filaments seen around the outer edge of the red super storm are high-altitude clouds that are being pulled in and around it.

The Great Red Spot is a towering structure shaped like a wedding cake, whose upper haze layer extends more than 3 miles (5 kilometers) higher than clouds in other areas. The gigantic structure, with a diameter slightly larger than Earth's, is a high-pressure wind system called an anticyclone that has been slowly downsizing since the 1800s. The reason for this change in size is still unknown.

A worm-shaped feature located below the Great Red Spot is a cyclone, a vortex around a low-pressure area with winds spinning in the opposite direction from the Red Spot. Researchers have observed cyclones with a wide variety of different appearances across the planet. The two white oval-shaped features are anticyclones, like small versions of the Great Red Spot.

Another interesting detail is the color of the wide band at the equator. The bright orange color may be a sign that deeper clouds are starting to clear out, emphasizing red particles in the overlying haze.

The new image was taken in visible light as part of the Outer Planets Atmospheres Legacy program, or OPAL. The program provides yearly Hubble global views of the outer planets to look for changes in their storms, winds, and clouds.

Hubble's Wide Field Camera 3 observed Jupiter when the planet was 400 million miles from Earth, when Jupiter was near "opposition" or almost directly opposite the Sun in the sky.

Source: HubbleSite


Contact:

Donna Weaver / Ray Villard
Space Telescope Science Institute, Baltimore, Maryland
410-338-4493 / 410-338-4514
dweaver@stsci.edu / villard@stsci.edu

Amy Simon
Goddard Space Flight Center, Greenbelt, Maryland
amy.simon@nasa.gov

Mike Wong
University of California, Berkeley, California
mikewong@astro.berkeley.edu


Related Links:

NASA's Hubble Portal
ESA/Hubble's Release
"Hubble's Brand New Image of Jupiter" Video (Goddard Media Studios' SVS Website)


Wednesday, March 14, 2018

Jupiter's Great Red Spot Getting Taller as it Shrinks, NASA Team Finds


Scientists have noticed that Jupiter's Great Red Spot has been getting smaller over time. Now, there's evidence the storm is actually growing taller as it shrinks. Credits: NASA's Goddard Space Flight Center. This video is public domain and can be downloaded from NASA's Scientific Visualization Studio.


Though once big enough to swallow three Earths with room to spare, Jupiter’s Great Red Spot has been shrinking for a century and a half. Nobody is sure how long the storm will continue to contract or whether it will disappear altogether.

A new study suggests that it hasn’t all been downhill, though. The storm seems to have increased in area at least once along the way, and it’s growing taller as it gets smaller.

“Storms are dynamic, and that’s what we see with the Great Red Spot. It’s constantly changing in size and shape, and its winds shift, as well,” said Amy Simon, an expert in planetary atmospheres at NASA’s Goddard Space Flight Center in Greenbelt, Maryland, and lead author of the new paper, published in the Astronomical Journal.

Observations of Jupiter date back centuries, but the first confirmed sighting of the Great Red Spot was in 1831. (Researchers aren’t certain whether earlier observers who saw a red spot on Jupiter were looking at the same storm.)

Keen observers have long been able to measure the size and drift of the Great Red Spot by fitting their telescopes with an eyepiece scored with crosshairs. A continuous record of at least one observation of this kind per year dates back to 1878.

Simon and her colleagues drew on this rich archive of historical observations and combined them with data from NASA spacecraft, starting with the two Voyager missions in 1979. In particular, the group relied on a series of annual observations of Jupiter that team members have been conducting with NASA’s Hubble Space Telescope as part of the Outer Planets Atmospheres Legacy, or OPAL, project. The OPAL team scientists are based at Goddard, the University of California at Berkeley, and NASA’s Jet Propulsion Laboratory in Pasadena, California.

The team traced the evolution of the Great Red Spot, analyzing its size, shape, color  and drift rate. They also looked at the storm’s internal wind speeds, when that information was available from spacecraft.

The new findings indicate that the Great Red Spot recently started to drift westward faster than before. The storm always stays at the same latitude, held there by jet streams to the north and south, but it circles the globe in the opposite direction relative to the planet’s eastward rotation. Historically, it’s been assumed that this drift is more or less constant, but in recent observations, the team found the spot is zooming along much faster.

The study confirms that the storm has been decreasing in length overall since 1878 and is big enough to accommodate just over one Earth at this point. But the historical record indicates the area of the spot grew temporarily in the 1920s.

“There is evidence in the archived observations that the Great Red Spot has grown and shrunk over time,” said co-author Reta Beebe, an emeritus professor at New Mexico State University in Las Cruces. “However, the storm is quite small now, and it’s been a long time since it last grew.”

Because the storm has been contracting, the researchers expected to find the already-powerful internal winds becoming even stronger, like an ice skater who spins faster as she pulls in her arms.
Instead of spinning faster, the storm appears to be forced to stretch up. It’s almost like clay being shaped on a potter’s wheel. As the wheel spins, an artist can transform a short, round lump into a tall, thin vase by pushing inward with his hands. The smaller he makes the base, the taller the vessel will grow.

In the case of the Great Red Spot, the change in height is small relative to the area that the storm covers, but it’s still noticeable.

The Great Red Spot’s color has been deepening, too, becoming intensely orange since 2014. Researchers aren’t sure why that’s happening, but it’s possible that the chemicals which color the storm are being carried higher into the atmosphere as the spot stretches up. At higher altitudes, the chemicals would be subjected to more UV radiation and would take on a deeper color.

In some ways, the mystery of the Great Red Spot only seems to deepen as the iconic storm contracts. Researchers don’t know whether the spot will shrink a bit more and then stabilize, or break apart completely.

“If the trends we see in the Great Red Spot continue, the next five to 10 years could be very interesting from a dynamical point of view,” said Goddard co-author Rick Cosentino. “We could see rapid changes in the storm’s physical appearance and behavior, and maybe the red spot will end up being not so great after all.”


By Elizabeth Zubritsky
NASA’s Goddard Space Flight Center in Greenbelt, Md.

Editor: Karl Hille


Source: NASA/Jupiter

Friday, February 16, 2018

Hubble Sees Neptune's Mysterious Shrinking Storm

Three billion miles away on the farthest known major planet in our solar system, an ominous, dark storm – once big enough to stretch across the Atlantic Ocean from Boston to Portugal – is shrinking out of existence as seen in pictures of Neptune taken by NASA’s Hubble Space Telescope.

Immense dark storms on Neptune were first discovered in the late 1980s by NASA’s Voyager 2 spacecraft. Since then, only Hubble has had the sharpness in blue light to track these elusive features that have played a game of peek-a-boo over the years. Hubble found two dark storms that appeared in the mid-1990s and then vanished. This latest storm was first seen in 2015, but is now shrinking.


For the first time, NASA's Hubble Space Telescope has captured time-lapse images of a large, dark storm on Neptune shrinking out of existence. Credits: NASA Goddard's Scientific Visualization Studio.   This video is public domain and can be downloaded from NASA's Scientific Visualization Studio.


Like Jupiter’s Great Red Spot (GRS), the storm swirls in an anti-cyclonic direction and is dredging up material from deep inside the ice giant planet’s atmosphere. The elusive feature gives astronomers a unique opportunity to study Neptune’s deep winds, which can’t be directly measured.

The dark spot material may be hydrogen sulfide, with the pungent smell of rotten eggs. Joshua Tollefson from the University of California at Berkeley explained, “The particles themselves are still highly reflective; they are just slightly darker than the particles in the surrounding atmosphere.”

Unlike Jupiter’s GRS, which has been visible for at least 200 years, Neptune’s dark vortices only last a few years. This is the first one that actually has been photographed as it is dying.

“We have no evidence of how these vortices are formed or how fast they rotate,” said Agustín Sánchez-Lavega from the University of the Basque Country in Spain. “It is most likely that they arise from an instability in the sheared eastward and westward winds.”

This series of Hubble Space Telescope images taken over 2 years tracks the demise of a giant dark vortex on the planet Neptune. The oval-shaped spot has shrunk from 3,100 miles across its long axis to 2,300 miles across, over the Hubble observation period. Credits: NASA, ESA, and M.H. Wong and A.I. Hsu (UC Berkeley). Hi-res image


The dark vortex is behaving differently from what planet-watchers predicted. “It looks like we’re capturing the demise of this dark vortex, and it’s different from what well-known studies led us to expect,” said Michael H. Wong of the University of California at Berkeley, referring to work by Ray LeBeau (now at St. Louis University) and Tim Dowling’s team at the University of Louisville. “Their dynamical simulations said that anticyclones under Neptune’s wind shear would probably drift toward the equator. We thought that once the vortex got too close to the equator, it would break up and perhaps create a spectacular outburst of cloud activity.”

But the dark spot, which was first seen at mid-southern latitudes, has apparently faded away rather than going out with a bang. That may be related to the surprising direction of its measured drift: toward the south pole, instead of northward toward the equator. Unlike Jupiter’s GRS, the Neptune spot is not as tightly constrained by numerous alternating wind jets (seen as bands in Jupiter’s atmosphere). Neptune seems to only have three broad jets: a westward one at the equator, and eastward ones around the north and south poles. The vortex should be free to change traffic lanes and cruise anywhere in between the jets.

“No facilities other than Hubble and Voyager have observed these vortices. For now, only Hubble can provide the data we need to understand how common or rare these fascinating neptunian weather systems may be,” said Wong.

The first images of the dark vortex are from the Outer Planet Atmospheres Legacy (OPAL) program, a long-term Hubble project that annually captures global maps of our solar system’s four outer planets. Only Hubble has the unique capability to probe these worlds in ultraviolet light, which yields important information not available to other present-day telescopes. Additional data, from a Hubble program targeting the dark vortex, are from an international team including Wong, Tollefson, Sánchez-Lavega, Andrew Hsu, Imke de Pater, Amy Simon, Ricardo Hueso, Lawrence Sromovsky, Patrick Fry, Statia Luszcz-Cook, Heidi Hammel, Marc Delcroix, Katherine de Kleer, Glenn Orton, and Christoph Baranec.

Wong’s paper appears online in the Astronomical Journal on Feb. 15, 2018.

The Hubble Space Telescope is a project of international cooperation between NASA and ESA (European Space Agency). NASA’s Goddard Space Flight Center in Greenbelt, Maryland, manages the telescope. The Space Telescope Science Institute (STScI) in Baltimore conducts Hubble science operations. STScI is operated for NASA by the Association of Universities for Research in Astronomy, Inc., in Washington, D.C.

For additional imagery, visit: http://hubblesite.org/news_release/news/2018-08

For NASA’s Hubble web page, visit: www.nasa.gov/hubble


Ray Villard
Space Telescope Science Institute, Baltimore, Maryland
410-338-4514
villard@stsci.edu

Editor: Karl Hille

Source: NASA/Hubble

Wednesday, July 05, 2017

Striking Gemini Images Point Juno Spacecraft Toward Discovery

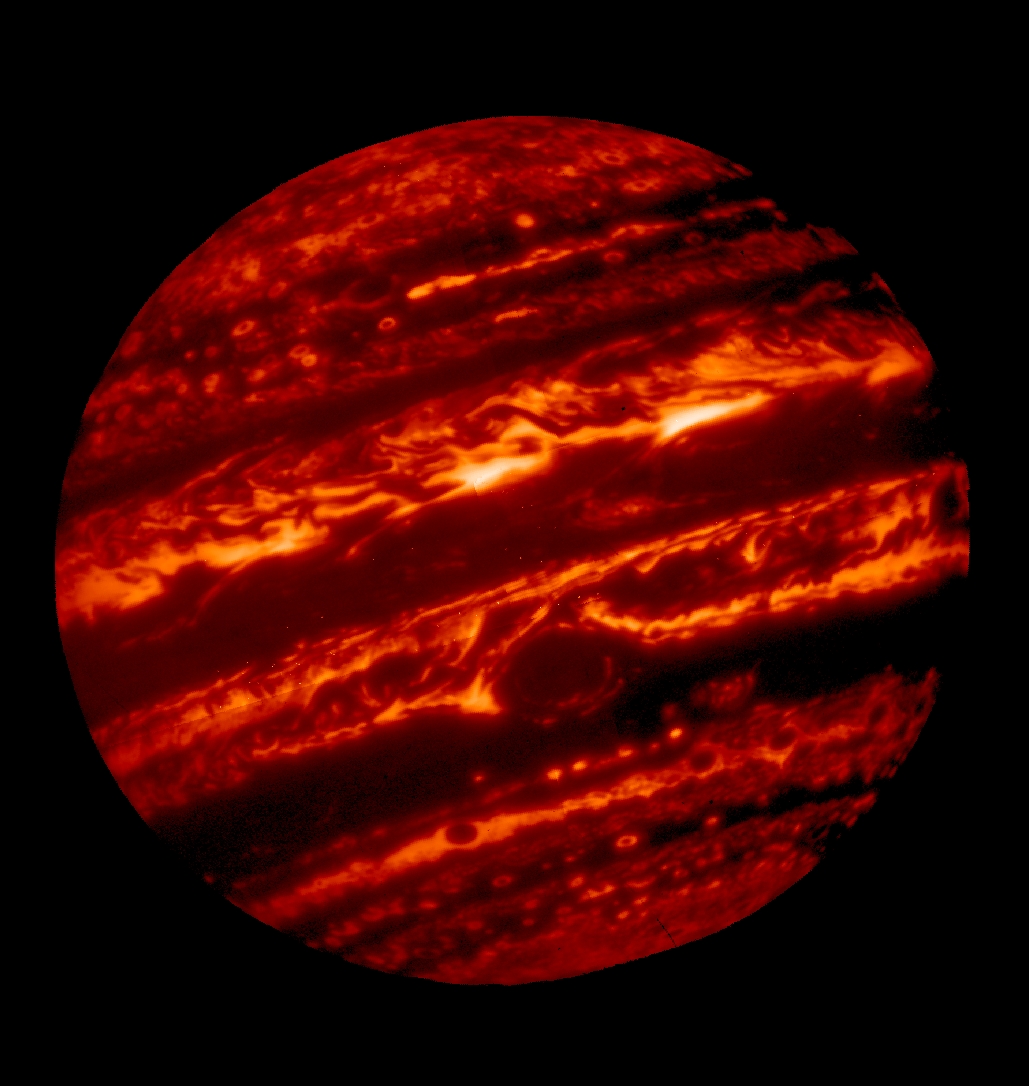
Figure 1. A composite color infrared image of Jupiter reveals haze particles over a range of altitudes, as seen in reflected sunlight. The image was taken using the Gemini North telescope with the Near-InfraRed Imager (NIRI) on May 18, 2017, one day before the Juno mission’s sixth close passage (“perijove”) of the planet. The color filters cover wavelengths between 1.69 to 2.275 microns and are sensitive to pressures of 10 millibars to 2 bars. The Great Red Spot (GRS) appears as the brightest (white) region at these wavelengths, which are primarily sensitive to high-altitude clouds and hazes near and above the top of Jupiter’s convective region – revealing that the GRS is one of the highest-altitude features in Jupiter’s atmosphere. The features that appear yellow/orange at Jupiter’s poles arise from the reflection of sunlight from high-altitude hazes that are the products of auroral-related chemistry in the planet’s upper stratosphere.

Narrow spiral streaks that appear to lead into it or out of it from surrounding regions probably represent atmospheric features being stretched by the intense winds within the GRS, such as the hook-like structure on its western edge (left side). Some are being swept off its eastern edge (right side) and into an extensive wave-like flow pattern; and there is even a trace of flow from its north. Other features near the GRS include the dark block and dark oval to the south and the north of the eastern flow pattern, respectively, indicating a lower density of cloud and haze particles in those locations. Both are long-lived cyclonic circulations, rotating clockwise - in the opposite direction as the counterclockwise rotation of the GRS. A prominent wave pattern is evident north of the equator, along with two bright ovals; these are anticyclones that appeared in January. Both the wave pattern and the ovals may be associated with an impressive upsurge in stormy activity that has been observed in these latitudes this year. Another bright anticyclonic oval is seen further north. Juno may pass over these ovals during its July 11 closest approach. High hazes are evident over both polar regions with much spatial structure that has never been seen quite so clearly in ground-based images, with substantial variability in their spatial structure. The central wavelengths and colors assigned to the filters are:1.69 microns (blue), 2.045 microns (cyan), 2.169 microns (green), 2.124 microns (yellow), and 2.275 microns (red).   Credit: Gemini Observatory/AURA/NSF/JPL-Caltech/NASA. Full resolution JPEG | TIFF

Figure 2. Close up images of the Great Red Spot from Gemini Near-InfraRed Imager (NIRI) images showing differences in the interior structure of this giant vortex with altitude. The top image was taken with a filter at 2.275 microns that is sensitive to particles at, and above, pressures of about 10 millibars (about 1% of the pressure at sea level on the Earth) in Jupiter’s lower stratosphere. It shows that particles at this level tend to increase toward the center of this gigantic vortex. The middle image was taken with a filter at 1.58 microns, sensitive to virtually no gaseous absorption, and is sensitive to the brightness of clouds, very similar to visible red light. Subtle oval-shaped banded structure going from the outside to the interior can be spotted in the image. The difference between these two images illustrates major differences in the dynamics of this vortex with altitude. The bottom image was taken with a filter at 4.68 microns, and shows bright thermal emission from the deeper atmosphere wherever there is “clear sky” (low cloud opacity in the 0.5-3 bar range). Top two panels show data from May 18, 2017, while the bottom panel shows data from January 11, 2017.   Credit: Gemini Observatory/AURA/NSF/JPL-Caltech/NASA/UC Berkeley.  Image in JPEG

Figure 3. At longer infrared wavelengths, Jupiter glows with thermal (heat) emission. In dark areas of this 4.8-micron image, thick clouds block the emission from the deeper atmosphere. The Great Red Spot is visible just below center. This image, obtained with the Gemini North telescope’s Near-InfraRed Imager (NIRI), was obtained on January 11, 2017, so the relative positions of discrete features have changed with respect to the near-infrared image in Figure 1.   Credit: Gemini Observatory/AURA/NSF/UC Berkeley.  Full resolution JPEG


Very detailed Gemini Observatory images peel back Jupiter’s atmospheric layers to support the NASA/JPL Juno spacecraft in its quest to understand the giant planet’s atmosphere. 
 
High-resolution imaging of Jupiter by the Gemini North telescope on Maunakea is informing the Juno mission of compelling events in Jupiter’s atmosphere. “The Gemini observations, spanning most of the first half of this year, have already revealed a treasure-trove of fascinating events in Jupiter’s atmosphere,” said Glenn Orton, PI for this Gemini adaptive optics investigation and coordinator for Earth-based observations supporting the Juno project at Caltech’s Jet Propulsion Laboratory. 

“Back in May, Gemini zoomed in on intriguing features in and around Jupiter’s Great Red Spot: including a swirling structure on the inside of the spot, a curious hook-like cloud feature on its western side and a lengthy, fine-structured wave extending off from its eastern side,” adds Orton. “Events like this show that there’s still much to learn about Jupiter’s atmosphere – the combination of Earth-based and spacecraft observations is a powerful one-two punch in exploring Jupiter.” 

Juno has now made five close-up passes of Jupiter’s atmosphere, the first of which was on August 27, 2016, and the latest (the sixth) on May 19th of this year. Each of these close passes has provided Juno’s science team with surprises, and the Juno science return has benefited from a coordinated campaign of Earth-based support – including observations from spacecraft orbiting the Earth (covering X-ray through visible wavelengths) and ground-based observatories (covering near-infrared through radio wavelengths). 

Next up: Juno’s close passages to Jupiter on July 11, 2017. “Gemini observations, which are already underway for the July flyby, are helping to guide our plans for this passage,” said Orton. He adds that the types of light Gemini captures provide a powerful glimpse into the layers of Jupiter’s atmosphere and provides a 3-dimensional view into Jupiter’s clouds. Among the questions Juno is investigating include poorly understood planetary-scale atmospheric waves south of the equator. “We aren’t sure if these waves might be seen at higher latitudes,” said Orton. “If so it might help us understand phenomena in Jupiter’s circulation that are quite puzzling.” 

“Wow – more remarkable images from the adaptive optics system at Gemini!” said Chris Davis, Program Officer for Gemini at the National Science Foundation (NSF), one of five agencies that operate the observatory. “It’s great to see this powerful combination of ground and space-based observations, and the two agencies, NSF and NASA, working together on such scientifically important discoveries.” 

The Gemini observations use special filters that focus on specific colors of light that can penetrate the upper atmosphere and clouds of Jupiter. These images are sensitive to increasing absorption by mixtures of methane and hydrogen gas in Jupiter’s atmosphere. “The Gemini images provide vertical sensitivity from Jupiter’s cloud tops up to the planet’s lower stratosphere,” according to Orton. 

The observations also employ adaptive optics technology to significantly remove distortions due to the turbulence in the Earth’s atmosphere and produce these extremely high-resolution images. Specifically, the detail visible in these images of Jupiter is comparable to being able to see a feature about the size of Ireland from Jupiter’s current distance of about 600 million kilometers (365 million miles) from Earth. 

In addition to images using adaptive-optics technology, a parallel Gemini program headed by Michael Wong of the University of California, Berkeley, used a longer-wavelength filter, for which adaptive optics is not needed. To obtain these data several images were made with short exposures, and the sharpest images were combined in processing - an approach commonly called “lucky imaging.” Images obtained with this filter are mainly sensitive to cloud opacity (blocks light) in the pressure range of 0.5 to 3 atmospheres. “These observations trace vertical flows that cannot be measured any other way, illuminating the weather, climate and general circulation in Jupiter’s atmosphere,” notes Wong. This image is shown in Figure 3

Subaru Telescope also supplied simultaneous mid-infrared imaging with its COMICS instrument – measuring the planet’s heat output in a spectral region not covered by Juno’s instrumentation, and producing data on composition and cloud structure that complement both the Juno and Gemini observations. For example, they show a very cold interior to the Great Red Spot that is surrounded by a warm region at its periphery, implying upwelling air in the center that is surrounded by subsidence. They also show a very turbulent region to the northwest of the Great Red Spot. The Subaru image is available at: http://subarutelescope.org/Topics/2017/06/30/index.html

The NASA Juno spacecraft was launched in August 2011 and began orbiting Jupiter in early July 2016. A primary goal of the mission is to improve our understanding of Jupiter – from its atmospheric properties to our understanding of how Jupiter and other planets in the outer Solar System formed. Juno’s payload of nine instruments can probe the atmospheric composition, temperature, cloud dynamics as well as the properties of Jupiter’s intense magnetic fields and aurora.
Gemini’s near-infrared images are particularly helpful to Juno’s Jupiter Infrared Auroral Mapper (JIRAM). JIRAM takes images at 3.5 and 4.8 microns and moderate-resolution spectra at 2–5 microns. The Gemini images provide a high-resolution spatial context for JIRAM’s spectroscopic observations and cover wavelengths and regions of the planet not observed by JIRAM. They also place an upper-atmospheric constraint on Jupiter’s circulation in the deep atmosphere determined by Juno’s Microwave Radiometer (MWR) experiment. 

Orton leads the observing team for the adaptive-optics imaging and Wong heads the observing team for the thermal imaging. Additional team members include Andrew Stephens (Gemini Observatory); Thomas Momary, James Sinclair (JPL); Kevin Baines (JPL, University of Wisconsin), Michael Wong, Imke de Pater (University of California, Berkeley); Patrick Irwin (University of Oxford); Leigh Fletcher (University of Leicester); Gordon Bjoraker (NASA Goddard Space Flight Center); and John Rogers (British Astronomical Association). 

In the full campaign of Earth-based support, the Gemini observations provide a key element that extends the spectral coverage of other facilities, as well as providing a strategic sampling to compare with the lower-resolution but more frequent imaging by NASA’s Infrared Telescope Facility (IRTF) that tracks the evolution of atmospheric features. These Gemini data are also a useful measure of cloud properties to compare with mid-infrared thermal imaging and spectroscopy of Jupiter’s atmosphere, such as that provided by Subaru’s COMICS experiment. The space platforms are involved in the Juno-support campaign include the XMM, Chandra and NuSTAR X-ray observatories and the Hisaki ultraviolet observatory, together with the Hubble Space Telescope. The many ground-based observatories include the Very Large Telescope (VLT), the Atacama Large Millimeter Array (ALMA), Calar Alto Observatory, and a suite of visible and radio observatories. Full details of the campaign can be found on: https://www.missionjuno.swri.edu/planned-observations.


Science Contacts:


Media Contacts:


Sunday, April 09, 2017

Hubble takes close-up portrait of Jupiter

Jupiter's swirling colourful clouds 

Hubble observes Jupiter at oppositiom
Credits: Video: NASA, STScI, and Goddard Space Flight Center/K. Jackson; Music: "Triangulate" by Gianluigi Gallo [PRS]; El Murmullo Sarao SGAE, Universal Sarao SGAE; SaraoMusic; Killer Tracks Production Music


During April 2017 Jupiter is in opposition: it is at its closest to Earth and the hemisphere facing Earth is fully illuminated by the Sun. The NASA/ESA Hubble Space Telescope used this special configuration to capture an image of what is by far the largest planet in the Solar System. This image adds to many others made in the past, and together they allow astronomers to study changes in the atmosphere of the gas giant.

On 7 April Jupiter will come into opposition, the point at which the planet is located directly opposite the Sun in the sky. This means that the Sun, Earth and Jupiter line up, with Earth sitting in between the Sun and the gas giant.

Opposition also marks the planet’s closest approach to Earth — about 670 million kilometres — so that Jupiter appears brighter in the night sky than at any other time in the year. This event allows astronomers using telescopes in space and on the ground to see more detail in the atmosphere of Jupiter.

On 3 April Hubble took advantage of this favourable alignment and turned its sharp eye towards Jupiter to add to the collection of images of our massive neighbour. Hubble observed Jupiter using its Wide Field Camera 3 (WFC3), which allows observations in ultraviolet, visible and infrared light.

The final image shows a sharp view of Jupiter and reveals a wealth of features in its dense atmosphere. As it is so close, Hubble can resolve features as small as about 130 kilometres across.

The surface of Jupiter is divided into several distinct, colourful bands, running parallel to the equator. These bands are created by differences in the opacity of the clouds which have varying quantities of frozen ammonia in them; the lighter bands have higher concentrations than the darker bands. The differing concentrations are kept separate by fast winds which can reach speeds of up to 650 kilometres per hour.

The most recognisable feature on Jupiter is the huge anticyclonic storm, called the Great Red Spot — this storm is large enough to engulf a whole Earth-sized planet at once. However, as with the last images of Jupiter taken by Hubble and telescopes on the ground, this new image confirms that the huge storm which has raged on Jupiter’s surface for at least 150 years continues to shrink. The reason for this is still unknown. So Hubble will continue to observe Jupiter in the hope that scientists will solve this stormy riddle.

Next to the famous Great Red Spot a much smaller storm can be seen at farther southern latitudes. Because of its similar appearance but much smaller size it was dubbed “Red Spot Junior”.

The observations of Jupiter form part of the Outer Planet Atmospheres Legacy (OPAL) programme, which allows Hubble to dedicate time each year to observing the outer planets. This way scientists have access to a collection of maps, which helps them to understand not only the atmospheres of the giant planets in the Solar System, but also the atmospheres of our own planet and of the planets that are being discovered around other stars. The programme began in 2014 with Uranus, and has been studying Jupiter and Neptune since 2015. In 2018, it will begin viewing Saturn. 


More Information

The Hubble Space Telescope is a project of international cooperation between ESA and NASA.
Image credit: NASA, ESA, and A. Simon (GSFC) 

Links


Contacts:

Mathias JägerContacts:
ESA/Hubble, Public Information Officer
Garching bei München, Germany
Cell: +49 176 62397500
Email
: mjaeger@partner.eso.org


Source: HubbleSite

Friday, July 01, 2016

Hubble captures vivid auroras in Jupiter’s atmosphere

Auroras on Jupiter


Videos
 
Timelapse of Jupiter’s auroras

Timelapse of Jupiter’s auroras (2)


Astronomers are using the NASA/ESA Hubble Space Telescope to study auroras — stunning light shows in a planet’s atmosphere — on the poles of the largest planet in the Solar System, Jupiter. This observation programme is supported by measurements made by NASA’s Juno spacecraft, currently on its way to Jupiter.

Jupiter, the largest planet in the Solar System, is best known for its colourful storms, the most famous being the Great Red Spot. Now astronomers have focused on another beautiful feature of the planet, using the ultraviolet capabilities of the NASA/ESA Hubble Space Telescope.

The extraordinary vivid glows shown in the new observations are known as auroras [1]. They are created when high energy particles enter a planet’s atmosphere near its magnetic poles and collide with atoms of gas. As well as producing beautiful images, this programme aims to determine how various components of Jupiter’s auroras respond to different conditions in the solar wind, a stream of charged particles ejected from the Sun.

This observation programme is perfectly timed as NASA’s Juno spacecraft is currently in the solar wind near Jupiter and will enter the orbit of the planet in early July 2016. While Hubble is observing and measuring the auroras on Jupiter, Juno is measuring the properties of the solar wind itself; a perfect collaboration between a telescope and a space probe [2].

“These auroras are very dramatic and among the most active I have ever seen”, says Jonathan Nichols from the University of Leicester, UK, and principal investigator of the study. “It almost seems as if Jupiter is throwing a firework party for the imminent arrival of Juno.”

To highlight changes in the auroras Hubble is observing Jupiter daily for around one month. Using this series of images it is possible for scientists to create videos that demonstrate the movement of the vivid auroras, which cover areas bigger than the Earth.

Not only are the auroras huge, they are also hundreds of times more energetic than auroras on Earth. And, unlike those on Earth, they never cease. Whilst on Earth the most intense auroras are caused by solar storms — when charged particles rain down on the upper atmosphere, excite gases, and cause them to glow red, green and purple — Jupiter has an additional source for its auroras.

The strong magnetic field of the gas giant grabs charged particles from its surroundings. This includes not only the charged particles within the solar wind but also the particles thrown into space by its orbiting moon Io, known for its numerous and large volcanos.

The new observations and measurements made with Hubble and Juno will help to better understand how the Sun and other sources influence auroras. While the observations with Hubble are still ongoing and the analysis of the data will take several more months, the first images and videos are already available and show the auroras on Jupiter’s north pole in their full beauty.


Notes

[1] Jupiter’s auroras were first discovered by the Voyager 1 spacecraft in 1979. A thin ring of light on Jupiter's nightside looked like a stretched-out version of our own auroras on Earth. Only later on was it discovered that the auroras were best visible in the ultraviolet.

[2] This is not the first time astronomers have used Hubble to observe the auroras on Jupiter, nor is it the first time that Hubble has cooperated with space probes to do so. In 2000 the NASA/ESA/ASI Cassini spacecraft made its closest approach to Jupiter and scientists used this opportunity to gather data and images about the auroras simultaneously from Cassini and Hubble (heic0009). In 2007 Hubble obtained images in support of its sister NASA Mission New Horizons which used Jupiter's gravity for a manoeuvre on its way to Pluto (opo0714a).


More Information 

The Hubble Space Telescope is a project of international cooperation between ESA and NASA.

Image credit: NASA, ESA


Links


Contacts

Jonathan Nichols
University of Leicester
United Kingdom
Tel: +44 116 252 5049
Email: jdn4@leicester.ac.uk

Mathias Jäger
ESA/Hubble, Public Information Officer
Garching bei München, Germany
Cell: +49 176 62397500
Email: mjaeger@partner.eso.org