Showing posts with label NGC 1566. Show all posts

Thursday, November 02, 2023

The dancer in Dorado


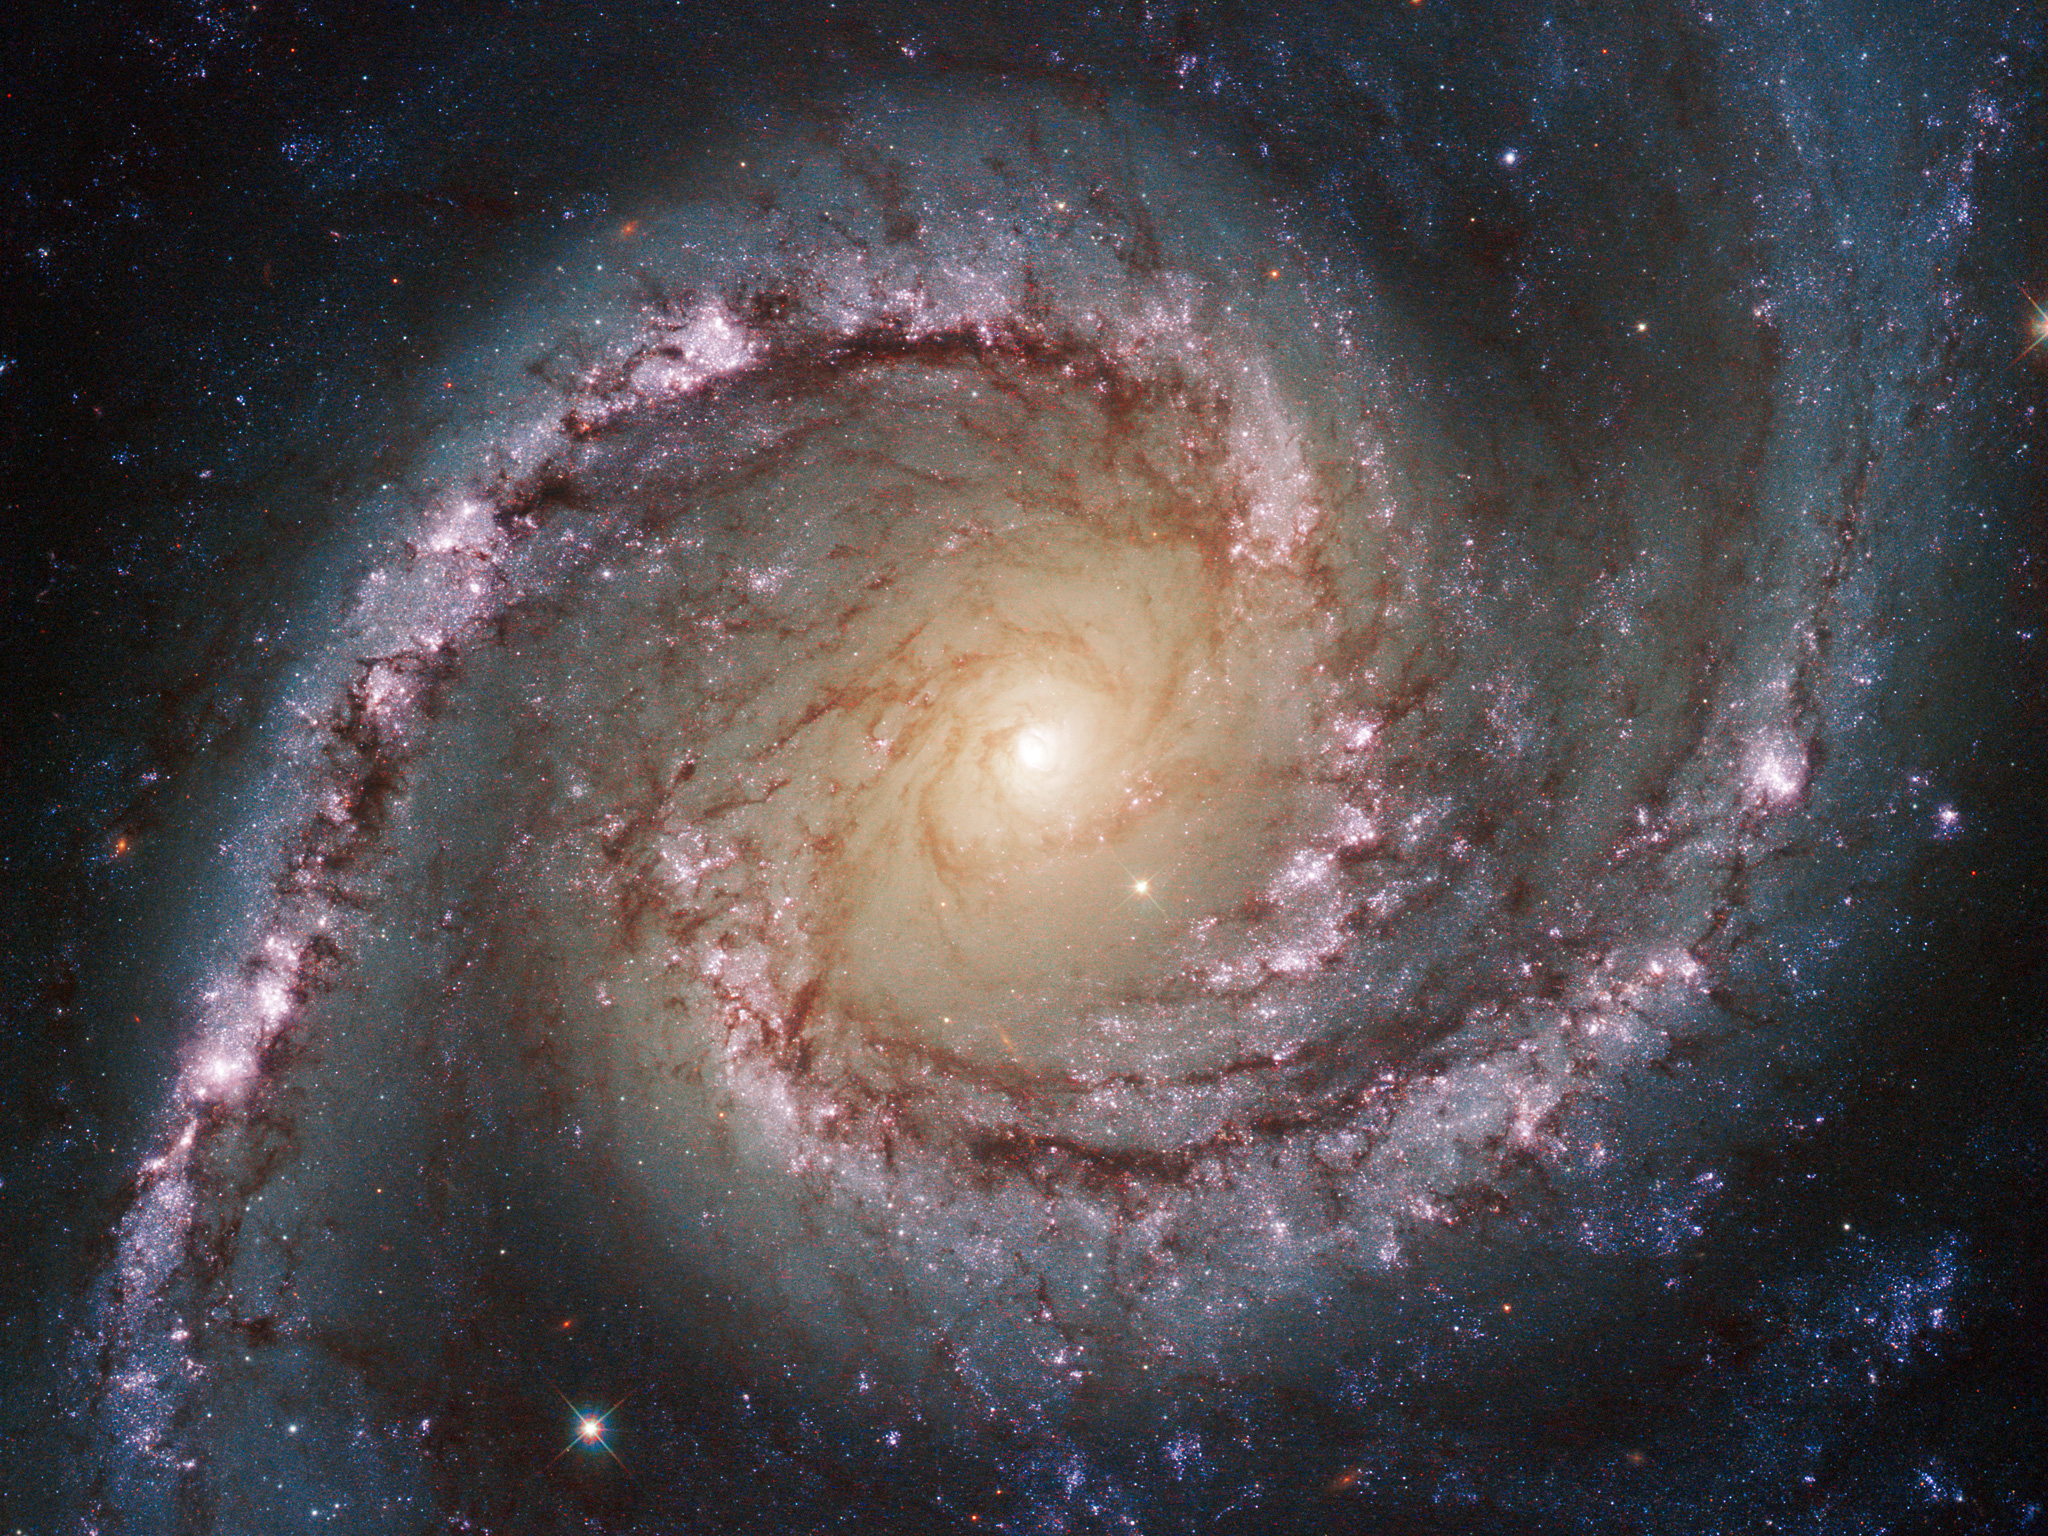
A spiral galaxy. The entire galaxy is displayed, centred and face-on to the viewer. It has two spiral arms that each make only a half-turn from start to finish, resembling the shape of a comma. Lanes of dark dust follow the arms into the centre, and split into many fibres that swirl around the glowing galactic core. Bright pink blooms along the arms show areas of new star formation; Credit: ESA/Hubble & NASA, D. Calzetti and the LEGUS team, R. Chandar

This vibrant and dynamic-looking image features the spiral galaxy NGC 1566, which is sometimes informally referred to as the ‘Spanish Dancer Galaxy’. Like the subject of another recent Hubble Picture of the Week, NGC 1566 is a weakly-barred or intermediate spiral galaxy, meaning that it does not have either a clearly present or a clearly absent bar-shaped structure at its centre. The galaxy owes its nickname to the vivid and dramatic swirling lines of its spiral arms, which could evoke the shapes and colours of a dancer’s moving form. NGC 1566 lies around 60 million light-years from Earth in the constellation Dorado, and is also a member of the Dorado galaxy group.

Galaxy groups are assemblages of gravitationally bound galaxies. Groups differ from galaxy clusters in size and mass: galaxy clusters may contain hundreds of galaxies, whereas groups might contain several tens of galaxies. That said, there is not a precise delineation between the definition of a galaxy group and a galaxy cluster. Some astronomers have proposed that the definitions be sharpened up, with one suggestion that galaxy aggregations with less mass than 80 trillion Suns should qualify as galaxy groups.

The Dorado group has had a fluctuating membership over the past few decades, with various scientific papers changing its list of constituent galaxies. As an example of why it is so challenging for astronomers to pin down members of groups such as the Dorado group, we can imagine a photograph of an adult human and a large oak tree. We have foreknowledge of the approximate size of the person and the tree, so if we were to see a photo where the person appeared roughly the same size as the tree, then we would be able to guess that, in reality, the person was positioned much closer to the camera than the tree was, giving the false impression that they were the same size. When working out members of a galaxy group, astronomers are not necessarily equipped with the knowledge of the size of the individual galaxies, and so have to work out whether galaxies really are relatively close together in space, or whether some of them are actually much closer or much further away. This has become easier with more sophisticated observation techniques, but still sometimes presents a challenge.


Friday, April 22, 2022

Black Holes Raze Thousands of Stars to Fuel Growth

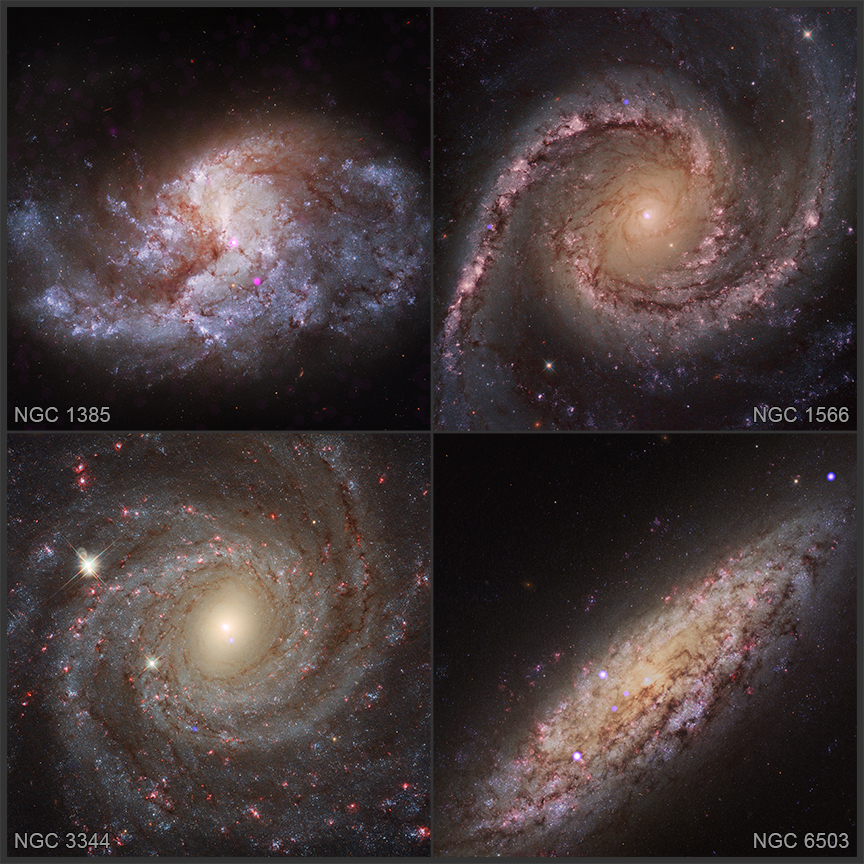
NGC 1385 - NGC 1566 - NGC 3344 - NGC 6503
Credit: X-ray: NASA/CXC/Washington State Univ./V. Baldassare et al.; Optical: NASA/ESA/STScI


JPEG (849.3 kb) - Large JPEG (42.2 MB)- Tiff (107.8 MB)- More Images

Tour: Chandra Archive Collection-More Animations


A new survey of over 100 galaxies by NASA's Chandra X-ray Observatory has uncovered signs that black holes are demolishing thousands of stars in a quest to pack on weight. The four galaxies shown in this graphic are among 29 galaxies in the sample that showed evidence for growing black holes near their centers. X-rays from Chandra (blue) have been overlaid on optical images from NASA's Hubble Space Telescope of the galaxies NGC 1385, NGC 1566, NGC 3344, and NGC 6503. The boxes that appear in the roll-over outline the location of the burgeoning black holes.

These new results suggest a somewhat violent path for at least some of these black holes to reach their present size — stellar destruction on a scale that has rarely if ever been seen before.

Astronomers have made detailed studies of two distinct classes of black holes. The smaller variety are "stellar-mass" black holes that typically weigh 5 to 30 times the mass of the Sun. On the other end of the spectrum are the supermassive black holes that live in the middle of most large galaxies, which weigh millions or even billions of solar masses. In recent years, there has also been evidence that an in-between class called "intermediate-mass black holes" (IMBHs) exists. The new study with Chandra could explain how such IMBHs are made through the runaway growth of stellar-mass black holes.

One key to making IMBHs may be their environment. This latest research looked at very dense clusters of stars in the centers of galaxies. With stars in such close proximity, many stars will pass within the gravitational pull of black holes in the centers of the clusters. Theoretical work by the team implies that if the density of stars in a cluster — the number packed into a given volume — is above a threshold value, a stellar-mass black hole at the center of the cluster will undergo rapid growth as it pulls in, shreds and ingests the abundant neighboring stars in close proximity.

Of the clusters in the new Chandra study, the ones with density above this threshold had about twice as many growing black holes as the ones below the density threshold. The density threshold depends also on how quickly the stars in the clusters are moving.

The process suggested by the latest Chandra study can occur at any time in the universe's history, implying that intermediate-mass black holes can form billions of years after the Big Bang, right up to the present day.

A paper describing these results was accepted and appears in The Astrophysical Journal. It is also available online. The authors of the study are Vivienne Baldassare (Washington State University), Nicolas C. Stone (Hebrew University in Jerusalem, Israel), Adi Foord (Stanford University), Elena Gallo (University of Michigan), and Jeremiah Ostriker (Princeton University).

NASA's Marshall Space Flight Center manages the Chandra program. The Smithsonian Astrophysical Observatory's Chandra X-ray Center controls science operations from Cambridge, Massachusetts, and flight operations from Burlington, Massachusetts.


Fast Facts for NGC 1385:

Credit: X-ray: NASA/CXC/Washington State Univ./V. Baldassare et al.; Optical: NASA/ESA/STScI
Scale: Image is about 2.68 arcmin (33,400 light years) across
Category: Black Holes, Normal Galaxies & Starburst Galaxies
Coordinates (J2000): RA 3h 37m 28.33s | -24° 30' 3.22"
Constellation:
Fornax
Observation Dates: Dec 6, 2018
Observation Time: 1 hour 24 minutes
Obs. IDs: 21473
Instrument:
ACIS
Color Code: X-ray: blue; Optical: red, green, and blue
Distance Estimate: About 43 million light years


Fast Facts for NGC 1566:

Credit: X-ray: NASA/CXC/Washington State Univ./V. Baldassare et al.; Optical: NASA/ESA/STScI
Scale: Image is about 2.77 arcmin (25,700 million light years) across
Category: Black Holes, Normal Galaxies & Starburst Galaxies
Coordinates (J2000): RA 4h 20m 0.27s | Dec -54° 56' 12.02"
Constellation:
Dorado
Observation Dates: Dec 3, 2018
Observation Time: 51 minutes
Obs. IDs: 21478
Instrument:
ACIS
Color Code: X-ray: blue; Optical: red, green, and blue
Distance Estimate: About 32 million light years


Fast Facts for NGC 3344:

Credit: X-ray: NASA/CXC/Washington State Univ./V. Baldassare et al.; Optical: NASA/ESA/STScI
Scale: Image is about 2.58 arcmin (46,400 light years) across
Category: Black Holes, Normal Galaxies & Starburst Galaxies
Coordinates (J2000): RA 10h 43m 31.08s | Dec +24° 55" 14.25'
Constellation: Leo Minor
Observation Dates: 2 observations, Jan 25, 2006 & Jan 21, 2013
Observation Time: 13 hours 40 minutes
Obs. IDs: 7087, 15387
Instrument:
ACIS
Color Code: X-ray: blue; Optical: red, green, and blue
Distance Estimate: About 62 million light years


Fast Facts for NGC 6503:

Credit: X-ray: NASA/CXC/Washington State Univ./V. Baldassare et al.; Optical: NASA/ESA/STScI
Scale: Image is about 2.68 arcmin (13,700 light years) across
Category: Black Holes, Normal Galaxies & Starburst Galaxies
Coordinates (J2000): RA 17h 49m 23.4s | Dec +70° 8' 51.12"
Constellation:
Draco
Observation Dates: 2 observations, Mar 23, 2000 & Oct 27, 2000
Observation Time: 4 hours 14 minutes
Obs. IDs: 872, 1640
Instrument:
ACIS
Color Code: X-ray: blue; Optical: red, green, and blue
Distance Estimate: About 18 million light years


Tuesday, August 03, 2021

Astronomers discover how to feed a black hole


The image shows the process of nuclear feeding of a black hole in the galaxy NGC 1566, and how the dust filaments, which surround the active nucleus, are trapped and rotate in a spiral around the black hole until it swallows them. Credit: ESO.

Authors: Science Communication and Outreach Unit 
References: M. Almudena Prieto, Jakub Nadolny, Juan A. Fernández-Ontiveros, Mar Mezcua. “Du… 

The black holes at the centres of galaxies are the most mysterious objects in the Universe, not only because of the huge quantities of material within them, millions of times the mass of the Sun, but because of the incredibly dense concentration of matter in a volume no bigger than that of our Solar System. When they capture matter from their surroundings they become active, and can send out enormous quantities of energy from the capture process, although it is not easy to detect the black hole during these capture episodes, which are not frequent.

However, a study led by the researcher Almudena Prieto, of the Instituto de Astrofísica de Canarias (IAC), has discovered long narrow dust filaments which surround and feed these black holes in the centres of galaxies, and which could be the natural cause of the darkening of the centres of many galaxies when their nuclear black holes are active. The results of this study have recently been published in the journal Monthly Notices of the Royal Astronomical Society (MNRAS).

Using images from the Hubble Space Telescope, the Very Large Telescope (VLT) at the European Southern Observatory (ESO), and the Atacama Large Millimetre Array (ALMA) in Chile, the scientists have been able to obtain a direct visualization of the process of nuclear feeding of a black hole in the galaxy NGC 1566 by these filaments. The combined images show a snapshot in which one can see how the dust filaments separate, and then go directly towards the centre of the galaxy, where they circulate and rotate in a spiral around the black hole before being swallowed by it.

“This group of telescopes has given us a completely new perspective of a supermassive black hole, thanks to the imaging at high angular resolution and the panoramic visualization of its surroundings, because it lets us follow the disappearance of the dust filaments as they fall into the black hole”, explains Almudena Prieto, the first author on the paper.

The study is the result of the long-term PARSEC project of the IAC, which aims to understand how supermassive black holes wake up from their long lives of hibernation, and after a process in which they accrete material from their surroundings, they become the most powerful objects in the Universe.

Part of this work was carried out within the Master’s thesis in Astrophysics of the University of La Laguna of Jakub Nadolny, carried out at the IAC within the PARSEC project. Researchers Mar Mezcua and Juan A. Fernández Ontiveros were also advisers to this work, while they had PARSEC postdoctoral contracts at the IAC.

Article: M. Almudena Prieto, Jakub Nadolny, Juan A. Fernández-Ontiveros, Mar Mezcua. “Dust in the central parsecs of unobscured AGN: more challenges to the torus”. Monthly Notices of the Royal Astronomical Society, July 8, 2021. DOI: https://doi.org/10.1093/mnras/stab1704

Contact at the IAC:

- Almudena Prieto:  aprieto@iac.es


Saturday, June 07, 2014

Grand swirls

Credit: ESA/Hubble & NASA

Acknowledgement: Flickr user Det58

This new Hubble image shows NGC 1566, a beautiful galaxy located approximately 40 million light-years away in the constellation of Dorado (The Dolphinfish). NGC 1566 is an intermediate spiral galaxy, meaning that while it does not have a well defined bar-shaped region of stars at its centre — like barred spirals — it is not quite an unbarred spiral either (heic9902o).

The small but extremely bright nucleus of NGC 1566 is clearly visible in this image, a telltale sign of its membership of the Seyfert class of galaxies. The centres of such galaxies are very active and luminous, emitting strong bursts of radiation and potentially harbouring supermassive black holes that are many millions of times the mass of the Sun.

NGC 1566 is not just any Seyfert galaxy; it is the second brightest Seyfert galaxy known. It is also the brightest and most dominant member of the Dorado Group, a loose concentration of galaxies that together comprise one of the richest galaxy groups of the southern hemisphere. This image highlights the beauty and awe-inspiring nature of this unique galaxy group, with NGC 1566 glittering and glowing, its bright nucleus framed by swirling and symmetrical lavender arms.

This image was taken by Hubble’s Wide Field Camera 3 (WFC3) in the near-infrared part of the spectrum. A version of the image was entered into the Hubble’s Hidden Treasures image processing competition by Flickr user Det58.


Wednesday, August 19, 2009

Galaxies Demand a Stellar Recount


A Lesson in Counting Stars
Credit: NASA/JPL-Caltech/JHU
These two photographs were made by combining data from NASA's Galaxy Evolution Explorer spacecraft and the Cerro Tololo Inter-American Observatory in Chile. By combining the data, astronomers were able to learn that not all galaxies make stars of different sizes in the same quantities, as was previously assumed. In other words, the proportion of small to big stars can differ from galaxy to galaxy. In these pictures, images taken with the Galaxy Evolution Explorer at shorter ultraviolet wavelengths are dark blue, while longer ultraviolet wavelengths are lighter blue. The optical images are colored red and yellow; red light is shown in yellow, while specially filtered red light from a type of hydrogen emission called H-alpha is colored red. In these pictures, the portions of galaxies that are rich in massive stars, called "O" stars, show up as white or pink. Areas dominated by slightly smaller stars, called "B" stars, appear blue. The spiral galaxy on the left, called NGC 1566, is an example of a galaxy that is comparatively rich in O stars compared to B stars. By contrast, the galaxy on the right, NGC 6902, has a weaker population of O stars compared to its B stars. NGC 1566 is 68 million light years away in the southern constellation of Dorado. NGC 6902 is about 33 million light years away in the constellation Sagittarius.


Adding up Stars in a Galaxy
Credit: NASA/JPL-Caltech
This diagram illustrates the extent to which astronomers have been underestimating the proportion of small to big stars in certain galaxies. Data from NASA's Galaxy Evolution Explorer spacecraft and the Cerro Tololo Inter-American Observatory in Chile have shown that, in some cases, there can be as many as four times more small stars compared to large ones.

In the diagram, a massive blue star is shown next to a stack of lighter, yellow stars. These big blue stars are three to 20 times more massive than our sun, while the smaller stars are typically about the same mass as the sun or smaller. Before the Galaxy Evolution Explorer study, astronomers assumed there were 500 small stars for every massive one (lower stack on right). The new observations reveal that, in certain galaxies, this estimation is off by a factor of four; for every massive star, there could be as many as 2,000 small counterparts (entire stack on right).

For decades, astronomers have gone about their business of studying the cosmos with the assumption that stars of certain sizes form in certain quantities. Like grocery stores selling melons alone, and blueberries in bags of dozens or more, the universe was thought to create stars in specific bundles. In other words, the proportion of small to big stars was thought to be fixed. For every star 20 or more times as massive as the sun, for example, there should be 500 stars with the sun's mass or less.

This belief, based on years of research, has been tipped on its side with new data from NASA's Galaxy Evolution Explorer. The ultraviolet telescope has found proof that small stars come in even bigger bundles than previously believed; for example, in some places in the cosmos, about 2,000 low-mass stars may form for each massive star. The little stars were there all along but masked by massive, brighter stars.

"What this paper is showing is that some of the standard assumptions that we've had - that the brightest stars tell you about the whole population of stars - this doesn't seem to work, at least not in a constant way," said Gerhardt R. Meurer, principal investigator on the study and a research scientist at Johns Hopkins University, Baltimore, Md.

Astronomers have long known that many stars are too dim to be seen in the glare of their brighter, more massive counterparts. Though the smaller, lighter stars outnumber the big ones, they are harder to see. Going back to a grocery story analogy, the melons grab your eyes, even though the total weight of the blueberries may be more.

Beginning in the 1950s, astronomers came up with a method for counting all the stars in a region, even the ones they couldn't detect. They devised a sort of stellar budget, an equation called the "stellar initial mass function," to estimate the total number of stars in an area of the sky based on the light from only the brightest and most massive. For every large star formed, a set number of smaller ones were thought to have been created regardless of where the stars sat in the universe.

"We tried to understand properties of galaxies and their mass by looking at the light we can see," Meurer said.

But this common assumption has been leading astronomers astray, said Meurer, especially in galaxies that are intrinsically small and faint.

To understand the problem, imagine trying to estimate the population on Earth by observing light emitted at night. Looking from above toward North America or Europe, the regions where more people live light up like signposts. Los Angeles, for example, is easily visible to a scientist working on the International Space Station. However, if this method were applied to regions where people have limited electricity, populations would be starkly underestimated, for example in some sections of Africa.

The same can be said of galaxies, whose speckles of light in the dark of space can be misleading. Meurer and his team used ultraviolet images from the Galaxy Evolution Explorer and carefully filtered red-light images from telescopes at the Cerro Tololo International Observatory in Chile to show that many galaxies do not form a lot of massive stars, yet still have plenty of lower-mass counterparts. The ultraviolet images are sensitive to somewhat small stars three times or more massive than the sun, while the filtered optical images are only sensitive to the largest stars with 20 or more times the mass of the sun.

The effects are particularly important in parts of the universe where stars are spread out over a larger volume -- the rural Africa of the cosmos. There could be about four times as many stars in these regions than previously estimated.

"Especially in these galaxies that seem small and piddling, there can be a lot more mass in lower mass stars than we had previously expected from what we could see from the brightest, youngest stars," Meurer said. "But we can now reduce these errors using satellites like the Galaxy Evolution Explorer."

This research was published in the April 10, 2009, issue of Astrophysical Journal.

Media Contacts:
Whitney Clavin 818-354-4673
Jet Propulsion Laboratory, Pasadena, Calif.