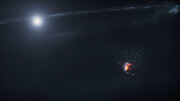
Tuesday, December 16, 2025

Painting Galaxy Clusters by Numbers (and Physics)

MS 0735.6+7421 - Perseus Cluster - M87 - Abell 2052 - Cygnus A
Credit: X-ray: NASA/CXC/Univ. of Chicago/H. McCall


JPEG (168.9 kb) - Large JPEG (10.5 MB) - Tiff (34.6 MB) - More Images

MS 0735.6+7421 - Perseus Cluster - M87 - Abell 2052 - Cygnus A
Astronomical Images of Objects Processed Using X-arithmetic Technique (Labeled) Credit: X-ray: NASA/CXC/Univ. of Chicago/H. McCall; Image processing: NASA/CXC/SAO/N. Wolk

A Tour of X-arithmetic - More Videos


Galaxy clusters are the most massive objects in the universe held together by gravity, containing up to several thousand individual galaxies and huge reservoirs of superheated, X-ray-emitting gas. The mass of this hot gas is typically about five times higher than the total mass of all the galaxies in galaxy clusters. In addition to these visible components, 80% of the mass of galaxy clusters is supplied by dark matter. These cosmic giants are bellwethers not only for the galaxies, stars and black holes within them, but also for the evolution and growth of the universe itself.

It is no surprise then that NASA’s Chandra X-ray Observatory has observed many galaxy clusters over the lifetime of the mission. Chandra’s X-ray vision allows it to see the enormous stockpiles of hot cluster gas, with temperatures as high as 100 million degrees, with exquisite clarity. This blazing gas tells stories about past and present activity within galaxy clusters.

Many of these galaxy clusters host supermassive black holes at their centers, which periodically erupt in powerful outbursts. These explosions generate jets that are visible in radio wavelengths, which inflate bubbles full of energetic particles; these bubbles carry energy out into the surrounding gas. Chandra’s images have revealed a wealth of other structures formed during these black hole outbursts, including hooks, rings, arcs, and wings. However, appearances alone don’t tell us what these structures are or how they formed.

To tackle this problem, a team of astronomers developed a novel image-processing technique to analyze X-ray data, allowing them to identify features in the gas of galaxy clusters like never before, classifying them by their nature rather than just their appearance. Prior to this technique, which they call “X-arithmetic,” scientists could only identify the nature of some of the features and in a much less efficient way, via studies of the amounts of X-ray energy dispersed at different wavelengths. The authors applied X-arithmetic to 15 galaxy clusters and galaxy groups (these are similar to galaxy clusters but with fewer member galaxies). By comparing the outcome from the X-arithmetic technique to computer simulations, researchers now have a new tool that will help in understanding the physical processes inside these important titans of the universe.

A new paper looks at how these structures appear in different parts of the X-ray spectrum. By splitting Chandra data into lower-energy and higher-energy X-rays and comparing the strengths of each structure in both, researchers can classify them into three distinct types, which they have colored differently. A pink color is given to sound waves and weak shock fronts, which arise from pressure disturbances traveling at close to the speed of sound, compressing the hot gas into thin layers. The bubbles inflated by jets are colored yellow, and cooling or slower-moving gas is blue. The resulting images, “painted” to reflect the nature of each structure, offer a new way to interpret the complex aftermath of black hole activity using only X-ray imaging data. This method works not only on Chandra (and other X-ray) observations, but also on simulations of galaxy clusters, providing a tool to bridge data and theory.

The images in this new collection show the central regions of five galaxy clusters in the sample: Abell 2052 and Cygnus A in the top row and MS 0735+7421, the Perseus Cluster, and M87 in the Virgo Cluster on the bottom row. All of these objects have been released to the public before by the Chandra X-ray Center, but this is the first time this special technique has been applied. The new treatment highlights important differences between the galaxy clusters and galaxy groups in the study.

The galaxy clusters in the study often have large regions of cooling or slow-moving gas near their centers, and only some show evidence for shock fronts. The galaxy groups, on the other hand, are different. They show multiple shock fronts in their central regions and smaller amounts of cooling and slow-moving gas compared to the sample of galaxy clusters.

This contrast between galaxy clusters and galaxy groups suggests that black hole feedback — that is, the interdependent relationship between outbursts from a black hole and its environment — appears stronger in galaxy groups. This may be because feedback is more violent in the groups than in the clusters, or because a galaxy group has weaker gravity holding the structure together than a galaxy cluster. The same outburst from a black hole, with the same power level, can therefore more easily affect a galaxy group than a galaxy cluster.

There are still many open questions about these black hole outbursts. For example, scientists would like to know how much energy they put into the gas around them and how often they occur. These violent events play a key role in regulating the cooling of the hot gas and controlling the formation of stars in clusters. By revealing the physics underlying the structures they leave behind, the X-arithmetic technique brings us closer to understanding the influence of black holes on the largest scales.

A paper describing this new technique and its results has been published in The Astrophysical Journal and is led by Hannah McCall from the University of Chicago. The other authors are Irina Zhuravleva (University of Chicago), Eugene Churazov (Max Planck Institute for Astrophysics, Germany), Congyao Zhang (University of Chicago), Bill Forman and Christine Jones (Center for Astrophysics | Harvard & Smithsonian), and Yuan Li (University of Massachusetts at Amherst).

NASA's Marshall Space Flight Center in Huntsville, Alabama, manages the Chandra program. The Smithsonian Astrophysical Observatory's Chandra X-ray Center controls science operations from Cambridge, Massachusetts, and flight operations from Burlington, Massachusetts.


Visual Description:

This release includes two sets of images featuring galaxy clusters. The first set of five images are traditional composite renderings. The second set of images features the same galaxy clusters rendered with a new image-processing technique called "X-arithmetic".

The traditional composite renderings share many visual similarities with digital photography; the images are relatively crisp, and feature cloud-like objects with blended colors, set against black backgrounds, dotted with distant specks of light. The X-arithmetic images are more visually similar to color MRI scans; they feature pixelated objects with distinct patches of vibrant color, set against neutral black backgrounds.

The first image in the two sets features the seemingly spherical galaxy cluster Abell 2052. In the composite rendering, the cluster resembles a pink rose in a cloud of powder blue haze. In the X-arithmetic rendering, interwoven pockets of hot pink, neon blue, and golden yellow appear brighter near the center, and somewhat muted near the outer edges.

The second image in the two sets features Cygnus A, a galaxy cluster with jets blasting in opposite directions out of a central black hole. In the composite image, the black hole appears as bright white light, the cluster resembles a neon blue cloud, and the jets exiting the cluster are surrounded by plumes resembling red smoke. In the X-arithmetic rendering, Cygnus A is depicted as a marbled ball of pixelated pockets in neon pink, blue, and golden yellow.

The third image in the sets features the galaxy cluster MS 0735. In the composite rendering, a vertical red cloud squiggle with a bright yellow dot in the center, is surrounded by a faint blue haze. In the X-arithmetic rendering, large pockets of yellow are surrounded by irregular hot pink shapes and dappled pockets of blue, which grow more granular near the outer edges.

The fourth pair of images feature the Perseus Cluster. The composite rendering resembles the view down a swirling cone of pink cotton candy, with a collection of dark blue filaments at the distant center. In the X-arithmetic rendering, the cluster resembles a corkscrew swirl of neon blue water, dotted with pink flecks, and blobs of golden yellow.

The fifth and final pair of images feature the galaxy cluster M87. In the composite rendering, the cluster is presented as ethereal overlapping clouds in purple, red, and white, with a golden orange embryonic shape at the core. The X-arithmetic rendering of the same cluster resembles a faint yellow cloud, digitally spattered with blue and pink pixels.


Fast Facts for MS 0735.6+7421:

Credit: X-ray: NASA/CXC/Univ. of Chicago/H. McCall
Release Date: December 9, 2025
Scale: Image is about 4.0 arcmin (2.8 million light-years) across.
Category: Groups and Clusters of Galaxies
Coordinates (J2000): RA 07h 41m 50.20s | Dec +74° 14´ 51.00"
Constellation: Camelopardalis
Observation Dates: 9 observations from Nov 2003 to Jan 2015
Observation Time: 149 hours 27 minute (6 days 5 hours 27 minutes)
Obs. ID: 4197, 10468-10471, 10822, 10918, 10922, 16275
Instrument:
ACIS
References: McCall, H. et al, 2025, ApJ, 989,159; DOI 10.3847/1538-4357/adea67
Color Code: X-ray: pink, yellow, blue
Distance Estimate: About 2.6 billion light-years from Earth


Fast Facts for Perseus Cluster:

Credit: X-ray: NASA/CXC/Univ. of Chicago/H. McCall
Release Date: December 9, 2025
Scale: Image is about 6 arcmin (410,000 light-years) across.
Category: Groups and Clusters of Galaxies
Coordinates (J2000): RA 3h 19m 47.60 | Dec +41° 30´ 37.00"
Constellation: Perseus
Observation Dates: 16 observations from Aug 2002 to Dec 2009
Observation Time: 330 hours 14 minutes (13 days 18 hours 14 minutes)
Obs. ID: 3209, 4289, 4946-4949, 6139, 4951-4953, 6139, 6145, 6146, 11713-11716
Instrument: ACIS
References: McCall, H. et al, 2025, ApJ, 989,159; DOI 10.3847/1538-4357/adea67
Color Code: X-ray: pink, yellow, blue
Distance Estimate: About 240 million light-years from Earth


Fast Facts for M87:

Credit: X-ray: NASA/CXC/Univ. of Chicago/H. McCall
Release Date: December 9, 2025v Scale: Image is about 15 arcmin (230,000 light-years) across.
Category: Groups and Clusters of Galaxies
Coordinates (J2000): RA 12h 30m 49.19s | Dec +12° 22´ 47.86"
Constellation: Virgo
Observation Dates: 10 observations from Jul 2003 to Apr 2010
Observation Time: 174 hours 26 minutes (7 days 6 hours 26 minutes)
Obs. ID: 2707, 3717, 5826-5828, 6186, 7210-7212, 11783
Instrument: ACIS
References: McCall, H. et al, 2025, ApJ, 989,159; DOI 10.3847/1538-4357/adea67
Color Code: X-ray: pink, yellow, blue
Distance Estimate: About 54 million light-years from Earth


Fast Facts for Abell 2052:

Credit: X-ray: NASA/CXC/Univ. of Chicago/H. McCall
Release Date: December 9, 2025
Scale: Image is about 4.4 arcmin (600,000 light-years) across.
Category: Groups and Clusters of Galaxies
Coordinates (J2000): RA 15h 16m 44.40s | Dec +07° 01´ 20.00"
Constellation: Serpens
Observation Dates: 10 observations from Mar, 2006 to Jun, 2009
Observation Time: 171 hours 28 minutes (7 days 3 hours 28 minutes)
Obs. ID: 5807, 10477-10480, 10879, 10914-10917
Instrument: ACIS
References: McCall, H. et al, 2025, ApJ, 989,159; DOI 10.3847/1538-4357/adea67
Color Code: X-ray: pink, yellow, blue
Distance Estimate: About 480 million light-years from Earth


Fast Facts for Cygnus A:

Credit: X-ray: NASA/CXC/Univ. of Chicago/H. McCall
Release Date: December 9, 2025
Scale: Image is about 3.4 arcmin (740,000 light-years) across.
Category: Groups and Clusters of Galaxies
Coordinates (J2000): RA 19h 59m 28.3s | Dec +44° 44´ 02"
Constellation: Cygnus
Observation Dates: 26 observations from Feb 2005 to May 2017
Observation Time: 221 hours 5 minutes (9 days 5 hours 5 minutes)
Obs. ID: 5830, 5831, 6225, 6226, 6228, 6229, 6250, 6252, 17133-17136, 17507-17514, 18688, 18871, 19989, 19996, 20077, 20079
Instrument: ACIS
References: McCall, H. et al, 2025, ApJ, 989,159; DOI 10.3847/1538-4357/adea67
Color Code: X-ray: pink, yellow, blue
Distance Estimate: About 760 million light-years from Earth


Monday, December 15, 2025

Michelangelo in Space: A Planet Carving the Fomalhaut Debris Disk?

This image combines observations from the Hubble Space Telescope and the Atacama Large Millimeter/submillimeter Array to show the dusty debris disk surrounding the star Fomalhaut. Credit:
ALMA (ESO/NAOJ/NRAO). Visible light image: the NASA/ESA Hubble Space Telescope A. Fujii/Digitized Sky Survey 2. Acknowledgment: Davide De Martin (ESA/Hubble); CC BY 4.0


Title:ALMA Reveals an Eccentricity Gradient in the Fomalhaut Debris Disk
Authors: Joshua B. Lovell et al.
First Author’s Institution: Center for Astrophysics | Harvard & Smithsonian
Status: Published in ApJ

Step 1: Understanding How to Carve Your Debris Disk

Let’s start with our solar system: the Kuiper belt, a large ring of icy asteroids, is believed to have been sculpted into its current shape by Neptune. Neptune may have previously scattered objects in the Kuiper Belt through gravitational interactions, but some of them (like Pluto) remain in an orbital resonance with Neptune. In the same way that Neptune shapes the Kuiper Belt, today’s authors believe a planet could be shaping an exo-Kuiper Belt around the star Fomalhaut.
.
What on Neptune is an orbital resonance, though? A planet orbiting a star has an orbital period, and the gravitational forces between nearby (astronomically speaking) objects can push these objects into a state where their orbital periods are multiples of each other. For example, Pluto and Neptune have a 2:3 orbital resonance, meaning Pluto completes two orbits for every three that Neptune does. The same can happen for the asteroids and planetesimals in the Kuiper Belt, so the same should happen in other star systems!
.
Step 2: Make Your Observations

If we understand how debris disks carved by exoplanets look — and we think we do — then we should be able to infer the existence of exoplanets! Today’s authors have used observations from the Atacama Large Millimeter/submillimeter Array (ALMA) of the debris disk around Fomalhaut and made some very clever calculations. We’ve known about this disk for a while, which is why today’s authors have studied it with a new analysis technique they developed.

Planeteismals — basically big rocks from a few to hundreds of kilometers across — that orbit in this disk do so with a certain eccentricity, and typically things in the same orbit would have the same eccentricity. But today’s authors were clever — they checked if there was an eccentricity gradient, meaning the planetesimals’ eccentricities depend on their semi-major axis (i.e., the mean orbit radius); we would typically not expect any eccentricity gradient for bodies orbiting a star unperturbed. The authors discovered that the gradient for planetesimals around Fomalhaut is negative, which implies the presence of a planet when you look at the maths behind gravitational interactions between planets and planetesimals.

A negative eccentricity gradient means the planetesimals gather up at the point on the orbit farthest from the star (the apocenter), and since there are more planetesimals in that region, they appear brighter in the ALMA data (see Fig. 1 left); the ring also appears slightly wider. If the eccentricity gradient were positive, the same thing would happen at the point on the orbit closest to the star (the pericenter). The authors term this phenomenon the “eccentric velocity divergence.”


Figure 1: Left: The observed intensity of the Fomalhaut debris disk with ALMA. Middle: the authors’ model that fits the ALMA data the best. Right: The residual (data – model) between model and data. White means there is a close match to the data (which is better). Credit: Lovell et al. 2025


When the authors ran their eccentric velocity divergence calculations for the Fomalhaut disk model, they compared it to observations using a Markov Chain Monte Carlo algorithm.

Figure 1 shows their best-fitting model, which fits remarkably well, based on the residual (i.e., the difference between model and data) you can see on the right — including the slightly wider ring at the apocenter!

The authors tested other scenarios with different gradients and allowed for the planetesimals to oscillate their eccentricity around their orbit, but they didn’t find a better-fitting scenario.

Step 3: Find a Carving Planet

Okay, so those were the details. The authors investigated a few scenarios to see what could be causing the observed debris disk and its negative eccentricity gradient, as well as an intermediate ring sitting between the main disk and the star that recently was seen with JWST. The authors tested two scenarios: one where a planet sits between the rings and evacuates the nearby region, and another where a planet is interior to the inner ring and clears the gap through orbital resonances (kind of like Neptune!). An illustration can be seen in Figure 2.

Figure 2: Illustration of possible planet-based scenarios that could create the observed debris disk around Fomalhaut. One features a planet between the observed debris disk rings, and another is where the planet is interior to both and carves the gap with orbital resonances. Credit: J. Williams


A planet was previously thought to exist around Fomalhaut, but it is now accepted there is not one we can currently observe. The authors point out that the possible planet sculpting this debris disk could be the same planet we thought existed previously, but at a lower mass (1–16 Earth masses; almost a Neptune mass). We can’t observe a planet with these parameters yet, but maybe with future observing facilities!

Finally, the authors stress, however, that it might not be a planet causing the observed structure — it could instead be the gravity of the planetesimals in the disk. Unfortunately, existing models are not equipped to explore this scenario, which is why the authors are planning to develop tools to investigate this next.

Original astrobite edited by Sandy Chiu.


About the author, Joe Williams:

I’m a third-year PhD student at the University of Exeter in the UK, and I study protoplanetary discs — mainly the tiny dust grains and their ices! In my spare time, I’m a climber, crocheter, and reader of sci-fi and fantasy books. My favourite sci-fi series is The Expanse!


Editor’s Note: Astrobites is a graduate-student-run organization that digests astrophysical literature for undergraduate students. As part of the partnership between the AAS and astrobites, we occasionally repost astrobites content here at AAS Nova. We hope you enjoy this post from astrobites; the original can be viewed at astrobites.org.


Sunday, December 14, 2025

New study sheds light on Milky Way's mysterious chemical history

This image shows the gas disc in a computer simulation of a Milky Way-like galaxy from the Auriga suite. Colours represent the ratio of magnesium (Mg) to iron (Fe), revealing that the galactic centre (pink) is poor in Mg, while the outskirts (green) are Mg-rich. These chemical patterns provide important clues about how the galaxy formed. Credit: Matthew D. A. Orkney (ICCUB-IEEC) /Auriga project.
Licence type:Attribution (CC BY 4.0)


Clues about how galaxies like our Milky Way form and evolve and why their stars show surprising chemical patterns have been revealed by a new study.

The research, published today in Monthly Notices of the Royal Astronomical Society, explores the origins of a puzzling feature in the Milky Way: the presence of two distinct groups of stars with different chemical compositions, known as the "chemical bimodality".

When scientists study stars near the Sun, they find two main types based on their chemical makeup, specifically, the amounts of iron (Fe) and magnesium (Mg) they contain. These two groups form separate "sequences" in a chemical diagram, even though they overlap in metallicity (how rich they are in heavy elements like iron). This has long puzzled astronomers.

The new study led by researchers at the Institute of Cosmos Sciences of the University of Barcelona (ICCUB) and the Centre national de la recherche scientifique (CNRS) uses advanced computer simulations (called the Auriga simulations) to recreate the formation of galaxies like the Milky Way in a virtual universe. By analysing 30 simulated galaxies, the team looked for clues about how these chemical sequences form.

Understanding the chemical history of the Milky Way helps scientists piece together how our gaaxy, and others like it, came to be. This includes our sister galaxy, Andromeda, in which no bimodality has yet been detected. It also provides clues about the conditions in the early universe and the role of cosmic gas flows and galaxy mergers.

"This study shows that the Milky Way's chemical structure is not a universal blueprint," said lead author Matthew Orkney, a researcher at ICCUB and the Institut d’Estudis Espacials de Catalunya (IEEC).

"Galaxies can follow different paths to reach similar outcomes, and that diversity is key to understanding galaxy evolution."

The study reveals that galaxies like the Milky Way can develop two distinct chemical sequences through various mechanisms. In some cases, this bimodality arises from bursts of star formation followed by periods of little activity, while in others it results from changes in the inflow of gas from the galaxy's surroundings.

Contrary to previous assumptions, the collision with a smaller galaxy known as Gaia-Sausage-Enceladus (GSE) is not a necessary condition for this chemical pattern to emerge. Instead, the simulations show that metal-poor gas from the circumgalactic medium (CGM) plays a crucial role in forming the second sequence of stars.

Moreover, the shape of these chemical sequences is closely linked to the galaxy's star formation history.

As new telescopes like the James Webb Space Telescope (JWST) and upcoming missions such as PLATO and Chronos provide more detailed data on stars and galaxies, researchers will be able to test these findings and refine our picture of the cosmos.

"This study predicts that other galaxies should exhibit a diversity of chemical sequences. This will soon be probed in the era of 30m telescopes where such studies in external galaxies will become routine," said Dr Chervin Laporte, of ICCUB-IEEC, CNRS-Observatoire de Paris and Kavli IPMU.

"Ultimately, these will also help us further refine the physical evolutionary path of our own Milky Way."


Media Contacts:

Sam Tonkin
Royal Astronomical Society
Mob: +44 (0)7802 877 700

press@ras.ac.uk

Dr Robert Massey
Royal Astronomical Society
Mob: +44 (0)7802 877 699

press@ras.ac.uk


Science Contacts:

Matthew Orkney
University of Barcelona

m.d.a.orkney@gmail.com


Images & video

Milky Way-like galaxy simulation

Caption: Computer simulation of a Milky Way-like galaxy from the Auriga suite, cycling between views of the stars, the gas coloured by iron (Fe) abundance, and the gas coloured by magnesium (Mg) abundance. The galaxy has developed a large, flat gas disc that forms a thin disc of young and blue stars. The gas disc was thicker in earlier stages, producing an older and redder population of stars in a thicker stellar disc. A scale bar in the lower-left corner indicates the size of the galaxy. For comparison, the Sun lies about 8 kiloparsecs (kpc) from the centre of our own Milky Way. Credit: Matthew D. A. Orkney (ICCUB-IEEC) /Auriga project

Auriga suite still

Caption: This image shows the gas disc in a computer simulation of a Milky Way-like galaxy from the Auriga suite. Colours represent the ratio of magnesium (Mg) to iron (Fe), revealing that the galactic centre (pink) is poor in Mg, while the outskirts (green) are Mg-rich. These chemical patterns provide important clues about how the galaxy formed. Credit: Matthew D. A. Orkney (ICCUB-IEEC) /Auriga project.


Further information

The paper ‘The Milky Way in context: The formation of galactic discs and chemical sequences from a cosmological perspective’ by M. D. A. Orkney et al. has been published in Monthly Notices of the Royal Astronomical Society. DOI: 10.1093/mnras/staf1551.

This research has been led by researchers from the Institute of Cosmos Sciences of the University of Barcelona (ICCUB), the Institute of Space Studies of Catalonia (IEEC) and the CNRS with the collaboration of scientists from Liverpool John Moores University and the Max-Planck-Institut für Astrophysik.


Notes for editors

About the Royal Astronomical Society

The Royal Astronomical Society (RAS), founded in 1820, encourages and promotes the study of astronomy, solar-system science, geophysics and closely related branches of science.

The RAS organises scientific meetings, publishes international research and review journals, recognises outstanding achievements by the award of medals and prizes, maintains an extensive library, supports education through grants and outreach activities and represents UK astronomy nationally and internationally. Its more than 4,000 members (Fellows), a third based overseas, include scientific researchers in universities, observatories and laboratories as well as historians of astronomy and others.

The RAS accepts papers for its journals based on the principle of peer review, in which fellow experts on the editorial boards accept the paper as worth considering. The Society issues press releases based on a similar principle, but the organisations and scientists concerned have overall responsibility for their content.

Keep up with the RAS on Instagram, Bluesky, LinkedIn, Facebook and YouTube.

Submitted by Sam Tonkin on

Saturday, December 13, 2025

NASA’s Webb Detects Thick Atmosphere Around Broiling Lava World

This artist’s concept shows what the hot super-Earth exoplanet TOI-561 b and its star could look like based on observations from NASA’s James Webb Space Telescope and other observatories. Webb data suggests that the planet is surrounded by a thick atmosphere above a magma ocean. Illustration: NASA, ESA, CSA, Ralf Crawford (STScI)

An artist’s concept shows what a thick atmosphere above a vast magma ocean on exoplanet TOI-561 b could look like. Measurements captured by NASA's James Webb Space Telescope suggest that in spite of the intense radiation it receives from its star, TOI-561 b is not a bare rock. Illustration: NASA, ESA, CSA, Ralf Crawford (STScI)

An emission spectrum captured by NASA's James Webb Space Telescope in May 2024 shows the brightness of different wavelengths of near-infrared light emitted by exoplanet TOI-561 b. Comparing the data to models suggests that the planet is surrounded by a volatile-rich atmosphere. Illustration: NASA, ESA, CSA, Ralf Crawford (STScI); Science: Johanna Teske (Carnegie Science Earth and Planets Laboratory), Anjali Piette (University of Birmingham), Tim Lichtenberg (Groningen), Nicole Wallack (Carnegie Science Earth and Planets Laboratory)


Researchers using NASA’s James Webb Space Telescope have detected the strongest evidence yet for an atmosphere on a rocky planet outside our solar system, as NASA leads the world in exploring the universe from the Moon to Mars and beyond. Observations of the ultra-hot super-Earth TOI-561 b suggest that the exoplanet is surrounded by a thick blanket of gases above a global magma ocean. The results help explain the planet’s unusually low density and challenge the prevailing wisdom that relatively small planets so close to their stars are not able to sustain atmospheres.

With a radius roughly 1.4 times Earth’s, and an orbital period less than 11 hours, TOI-561 b falls into a rare class of objects known as ultra-short period exoplanets. Although its host star is only slightly smaller and cooler than the Sun, TOI-561 b orbits so close to the star — less than one million miles (one-fortieth the distance between Mercury and the Sun) — that it must be tidally locked, with the temperature of its permanent dayside far exceeding the melting temperature of typical rock.

“What really sets this planet apart is its anomalously low density,” said Johanna Teske, staff scientist at Carnegie Science Earth and Planets Laboratory and lead author on a paper published Thursday in The Astrophysical Journal Letters. “It’s not a super-puff, but it is less dense than you would expect if it had an Earth-like composition.”

One explanation the team considered for the planet’s low density was that it could have a relatively small iron core and a mantle made of rock that is not as dense as rock within Earth. Teske notes that this could make sense: “TOI-561 b is distinct among ultra-short period planets in that it orbits a very old (twice as old as the Sun), iron-poor star in a region of the Milky Way known as the thick disk. It must have formed in a very different chemical environment from the planets in our own solar system.” The planet's composition could be representative of planets that formed when the universe was relatively young.

But an exotic composition can’t explain everything. The team also suspected that TOI-561 b might be surrounded by a thick atmosphere that makes it look larger than it actually is. Although small planets thathave spent billions of years baking in blazing stellar radiation are not expected to have atmospheres, some show signs that they are not just bare rock or lava.

To test the hypothesis that TOI-561 b has an atmosphere, the team used Webb’s NIRSpec (Near-Infrared Spectrograph) to measure the planet’s dayside temperature based on its near-infrared brightness. The technique, which involves measuring the decrease in brightness of the star-planet system as the planet moves behind the star, is similar to that used to search for atmospheres in the TRAPPIST-1 system and on other rocky worlds.

If TOI-561 b is a bare rock with no atmosphere to carry heat around to the nightside, its dayside temperature should be approaching 4,900 degrees Fahrenheit (2,700 degrees Celsius). But the NIRSpec observations show that the planet’s dayside appears to be closer to 3,200 degrees Fahrenheit (1,800 degrees Celsius) — still extremely hot, but far cooler than expected.

To explain the results, the team considered a few different scenarios. The magma ocean could circulate some heat, but without an atmosphere, the nightside would probably be solid, limiting flow away from the dayside. A thin layer of rock vapor on the surface of the magma ocean is also possible, but on its own would likely have a much smaller cooling effect than observed.

“We really need a thick volatile-rich atmosphere to explain all the observations,” said Anjali Piette, coauthor from the University of Birmingham, United Kingdom.

“Strong winds would cool the dayside by transporting heat over to the nightside. Gases like water vapor would absorb some wavelengths of near-infrared light emitted by the surface before they make it all the way up through the atmosphere. (The planet would look colder because the telescope detects less light.) It’s also possible that there are bright silicate clouds that cool the atmosphere by reflecting starlight.”

While the Webb observations provide compelling evidence for such an atmosphere, the question remains: How can a small planet exposed to such intense radiation can hold on to any atmosphere at all, let alone one so substantial? Some gases must be escaping to space, but perhaps not as efficiently as expected.

“We think there is an equilibrium between the magma ocean and the atmosphere. At the same time that gases are coming out of the planet to feed the atmosphere, the magma ocean is sucking them back into the interior,” said co-author Tim Lichtenberg from the University of Groningen in the Netherlands. “This planet must be much, much more volatile-rich than Earth to explain the observations. It's really like a wet lava ball.”

These are the first results from Webb’s General Observers Program 3860, which involved observing the system continuously for more than 37 hours while TOI-561 b completed nearly four full orbits of the star. The team is currently analyzing the full data set to map the temperature all the way around the planet and narrow down the composition of the atmosphere.

“What’s really exciting is that this new data set is opening up even more questions than it’s answering,” said Teske.

The James Webb Space Telescope is the world’s premier space science observatory. Webb is solving mysteries in our solar system, looking beyond to distant worlds around other stars, and probing the mysterious structures and origins of our universe and our place in it. Webb is an international program led by NASA with its partners, ESA (European Space Agency) and CSA (Canadian Space Agency).


Related Information

Read more: Can Rocky Worlds Orbiting Red Dwarf Stars Maintain Atmospheres?

Explore more: ViewSpace Exoplanet Variety: Atmosphere

Explore more: How to Study Exoplanets: Webb and Challenges

Explore more: How Do We Learn About a Planet’s Atmosphere?

Read more: NASA’s Webb Hints at Possible Atmosphere Surrounding Rocky Exoplanet

More Webb News

More Webb Images

Webb Science Themes

Webb Mission Page

Related For Kids

What is the Webb Telescope?

SpacePlace for Kids


NASA’s Webb Identifies Earliest Supernova to Date, Shows Host Galaxy

NASA’s James Webb Space Telescope identified the source of a super bright flash of light known as a gamma-ray burst: a supernova that exploded when the universe was only 730 million years old. Webb’s high-resolution near-infrared images also detected the supernova’s host galaxy. Image: NASA, ESA, CSA, STScI, Andrew Levan (Radboud University); Image Processing: Alyssa Pagan (STScI)

This two-part illustration represents supernova GRB 250314A as it was exploding and three months after that, when Webb observed it. Webb confirmed the supernova occurred when the universe was only 730 million years old. The star clusters at top-left represent its host galaxy. Artwork: NASA, ESA, CSA, STScI, Leah Hustak (STScI)


With this observation, Webb also broke its own record: The previous chart-topping supernova exploded when the universe was 1.8 billion years old.

“Only Webb could directly show that this light is from a supernova — a collapsing massive star,” said Andrew Levan, the lead author of one of two new papers in Astronomy and Astrophysics Letters and a professor at Radboud University in Nijmegen, Netherlands, and the University of Warwick in the United Kingdom. “This observation also demonstrates that we can use Webb to find individual stars when the universe was only 5% of its current age.”

While a gamma-ray burst typically lasts for seconds to minutes, a supernova rapidly brightens over several weeks before it slowly dims. In contrast, this supernova brightened over months. Since it exploded so early in the history of the universe, its light was stretched as the cosmos expanded over billions of years. As light is stretched, so is the time it takes for events to unfold. Webb’s observations were intentionally taken three and a half months after the gamma-ray burst ended, since the underlying supernova was expected to be brightest at that time.

“Webb provided the rapid and sensitive follow-up we needed,” said Benjamin Schneider, a co-author and a postdoctoral researcher at the Laboratoire d'Astrophysique de Marseille in France.

Gamma-ray bursts are incredibly rare. Those that last a few seconds may be caused by two neutron stars, or a neutron star and a black hole colliding. Longer bursts like this one, which lasted around 10 seconds, are frequently linked to the explosive deaths of massive stars.

Immediate, nimble investigation of the source

The first alert chimed March 14. The news of the gamma-ray burst from a very distant source came from the SVOM mission (Space-based multi-band astronomical Variable Objects Monitor), a Franco-Chinese telescope that launched in 2024 and was designed to detect fleeting events.

Within an hour and a half, NASA’s Neil Gehrels Swift Observatory pinpointed the X-ray source’s location on the sky. That enabled subsequent observations that would pin down the distance for Webb.

Eleven hours later, the Nordic Optical Telescope on the Canary Islands was queued up and revealed an infrared-light gamma-ray burst afterglow, an indication that the gamma ray might be associated with a very distant object.

Four hours later, the European Southern Observatory’s Very Large Telescope in Chile estimated the object existed 730 million years after the big bang.

“There are only a handful of gamma-ray bursts in the last 50 years that have been detected in the first billion years of the universe,” Levan said. “This particular event is very rare and very exciting.”

Shockingly similar to nearby supernovae

Since this is the earliest, farthest supernova to be detected to date, researchers compared it to what they know in great detail — modern, nearby supernovae. The two turned out to be very similar, which surprised them.

Why? Little is still known about the first billion years of the universe. Early stars likely contained fewer heavy elements, were more massive, and led shorter lives. They also existed during the Era of Reionization, when gas between galaxies was largely opaque to high-energy light.

“We went in with open minds,” said Nial Tanvir, a co-author and a professor at the University of Leicester in the United Kingdom. “And lo and behold, Webb showed that this supernova looks exactly like modern supernovae.” Before researchers can determine why such an early supernova is similar to nearby supernovae, more data is needed to pinpoint tiny differences.

First look at supernova’s host galaxy

“Webb’s observations indicate that this distant galaxy is similar to other galaxies that existed at the same time,” said Emeric Le Floc’h, a co-author and astronomer at the CEA Paris-Saclay (Commissariat à l'Énergie Atomique et aux Énergies Alternatives) in France. Since the galaxy’s light is blended into a few pixels, making the galaxy look like a reddened smudge, what we can learn about it is still limited. Seeing it at all is a breakthrough.

The researchers have already laid plans to reenlist Webb in the international effort to learn more about gamma-ray bursts emitted by objects in the early universe. The team has been approved to observe events with Webb and now have a new aim: to learn more about galaxies in the distant universe by capturing the afterglow of the gamma-ray bursts themselves. “That glow will help Webb see more and give us a ‘fingerprint’ of the galaxy,” Levan said.

This research team observed supernova GRB 250314A with a rapid-turnaround Director's Discretionary Time program.

The James Webb Space Telescope is the world’s premier space science observatory. Webb is solving mysteries in our solar system, looking beyond to distant worlds around other stars, and probing the mysterious structures and origins of our universe and our place in it. Webb is an international program led by NASA with its partners, ESA (European Space Agency) and CSA (Canadian Space Agency).


Related Information

Read more: NASA’s Webb Opens New Window on Supernova Science

Explore more: ViewSpace Take a Tour of Cassiopeia A

Explore more: ViewSpace Star Death: Crab Nebula

Explore more: Massive Stars: Engines of Creation

Read more: Supernova Encore: NASA’s Webb Spots a Second Lensed Supernova in a Distant Galaxy

 More Webb News

More Webb Images

Webb Science Themes

Webb Mission Page

Related For Kids

What is the Webb Telescope?

SpacePlace for Kids


Friday, December 12, 2025

Flaring black hole whips up ultra-fast winds

Artist’s impression of the flaring, windy black hole in NGC 3783 (portrait)
Credit: ESA - Acknowledgements: ATG Europe
Licence:
CC BY-SA 3.0 IGO or ESA Standard Licence
(content can be used under either licence)

An artist's impression of XMM-Newton.
Credit: ESA-C. Carreau
Licence:
CC BY-SA 3.0 IGO or ESA Standard Licence
(content can be used under either licence)

XRISM spacecraft
Credit: JAXA
ESA Standard Licence


Leading X-ray space telescopes XMM-Newton and XRISM have spotted an extraordinary blast from a supermassive black hole. In a matter of hours, the gravitational monster whipped up powerful winds, flinging material out into space at eye-watering speeds of 60 000 km per second.

The gigantic black hole lurks within NGC 3783, a beautiful spiral galaxy imaged recently by the NASA/ESA Hubble Space Telescope. Astrono.mers spotted a bright X-ray flare erupt from the black hole before swiftly fading away. As i,brt faded, fast winds emerged, raging at one-fifth of the speed of light.

“We’ve not watched a black hole create winds this speedily before,” says lead researcher Liyi Gu at Space Research Organisation Netherlands (SRON). “For the first time, we’ve seen how a rapid burst of X-ray light from a black hole immediately triggers ultra-fast winds, with these winds forming in just a single day.”

Devouring material

To study NGC 3783 and its black hole, Gu and colleagues simultaneously used the European Space Agency’s XMM-Newton and the X-Ray Imaging and Spectroscopy Mission (XRISM), a JAXA-led mission with ESA and NASA participation.

The black hole in question is as massive as 30 million Suns. As it feasts on nearby material, it powers an extremely bright and active region at the heart of the spiral galaxy. This region, known as an Active Galactic Nucleus (AGN), blazes in all kinds of light, and throws powerful jets and winds out into the cosmos.

“AGNs are really fascinating and intense regions, and key targets for both XMM-Newton and XRISM,” adds Matteo Guainazzi, ESA XRISM Project Scientist and co-author of the discovery.

“The winds around this black hole seem to have been created as the AGN’s tangled magnetic field suddenly ‘untwisted’ – similar to the flares that erupt from the Sun, but on a scale almost too big to imagine.”

A little less alien

The winds from the black hole resemble large solar eruptions of material known as coronal mass ejections, which form as the Sun hurls streams of superheated material into space. In this way, the study shows that supermassive black holes sometimes act like our own star, making these mysterious objects seem a little less alien.

In fact, a coronal mass ejection following an intense flare was spotted at the Sun as recently as 11 November, with the winds associated with this event thrown out at initial speeds of 1500 km per second.

“Windy AGNs also play a big role in how their host galaxies evolve over time, and how they form new stars,” adds Camille Diez, a team member and ESA Research Fellow.

“Because they’re so influential, knowing more about the magnetism of AGNs, and how they whip up winds such as these, is key to understanding the history of galaxies throughout the Universe.”

A joint discovery

XMM-Newton has been a pioneering explorer of the hot and extreme Universe for over 25 years, while XRISM has been working to answer key open questions about how matter and energy move through the cosmos since it launched in September 2023.

The two X-ray space telescopes worked together to uncover this unique event and understand the black hole’s flare and winds. XMM-Newton tracked the evolution of the initial flare with its Optical Monitor, and assessed the extent of the winds using its European Photon Imaging Camera (EPIC). XRISM spotted the flare and winds using its Resolve instrument, also studying the winds’ speed, structure, and figuring out how they were launched into space.

“Their discovery stems from successful collaboration, something that’s a core part of all ESA missions,” says ESA XMM-Newton Project Scientist Erik Kuulkers.

“By zeroing in on an active supermassive black hole, the two telescopes have found something we’ve not seen before: rapid, ultra-fast, flare-triggered winds reminiscent of those that form at the Sun. Excitingly, this suggests that solar and high-energy physics may work in surprisingly familiar ways throughout the Universe.”


Notes for editors


SRON news release

For more information, please contact:
ESA Media Relations

media@esa.int


Thursday, December 11, 2025

Astronomers Sharpen the Universe’s Expansion Rate, Deepening a Cosmic Mystery

Researchers using time-delay cosmography independently confirmed that the universe’s current rate of expansion, known as the Hubble constant (H₀), does not match values predicted from measurements from the universe when it was much younger. This “Hubble tension” may point to new physics governing the universe. Credit: W. M. Keck Observatory / Adam Makarenko


New results strengthen the “Hubble tension,” hinting at the need for rethinking our model of the universe

Maunakea, Hawaiʻi – A team of astronomers using a variety of ground and space-based telescopes including the W. M. Keck Observatory on Maunakea, Hawaiʻi Island, have made one of the most precise independent measurements yet of how fast the universe is expanding, further deepening the divide on one of the biggest mysteries in modern cosmology.

Using data gathered from Keck Observatory’s Cosmic Web Imager (KCWI) as well as NASA’s James Webb Space Telescope (JWST), the Hubble Space Telescope (HST) the Very Large Telescope (VLT), and European Organisation for Astronomical Research in the Southern Hemisphere (ESO) researchers have independently confirmed that the universe’s current rate of expansion, known as the Hubble constant (H₀), does not match values predicted from measurements from the universe when it was much younger.

The finding strengthens what scientists call the “Hubble tension,” a cosmic disagreement that may point to new physics governing the universe.

“What many scientists are hoping is that this may be the beginning of a new cosmological model,” said Tommaso Treu, Distinguished Professor of Physics and Astronomy at the University of California Los Angeles and one of the authors of the study published in Astronomy and Astrophysics.

“This is the dream of every physicist. Find something wrong in our understanding so we can discover something new and profound,” added Simon Birrer, Assistant Professor of Physics at the Stony Brook University and one of the corresponding authors of the study.

A Constant in Question Questioned Constantly

Coined by astronomer Edwin Hubble, who first calculated it in 1929, the Hubble Constant is the rate at which the universe expands. This number reveals not only the universe’s current speed of growth, but also its age and history. Yet nearly a century later, scientists still can’t agree on its exact value. The Hubble Constant can be measured in two ways, one probing the universe at early times and another probing the universe at times near today. The early universe probe, which uses cosmological models to indirectly provide the current expansion rate of the universe, favors an expansion rate of ~67 km/s/Mpc; and the late (nearby) universe probe, which measures the local universe as it exists today favors an expansion rate of 73 km/s/Mpc. Measurements based on the nearby universe differ from predictions drawn from the early universe, resulting in what is famously known as the Hubble Tension.

Confirming this tension would force scientists to rethink the very makeup of the cosmos; perhaps revealing new particles, or evidence for an “early dark energy” phase that briefly accelerated expansion after the Big Bang. Because the implications are so profound, astronomers stress the importance of multiple independent methods to cross-check the result.

“This is significant in that cosmology as we know it may be broken,” said John O’Meara, Chief Scientist and Deputy Director of Keck Observatory. “If it is true that the Hubble Tension isn’t a mistake in the measurements, we will have to come up with new physics.”

New Way to Measure the Universe

To make this precise measurement, the team used a method called time-delay cosmography. Much like a funhouse mirror bends and distorts reflections, massive galaxies bend the light of more distant galaxies and quasars, producing multiple images of the same object.

When the distant object’s brightness changes, astronomers can measure how long it takes those changes to appear in each image. Those “time delays” act like cosmic yardsticks — allowing scientists to calculate distances across the universe and, ultimately, determine how fast it’s expanding.

KCWI’s powerful spectroscopy was essential to the measurement. By observing the motion of stars within the lensing galaxies, the instrument revealed how massive those galaxies are and how strongly they bend light, critical information for pinning down the Hubble Constant.

The Quest Continues

The team’s measurement currently achieves 4.5% precision — an extraordinary feat, but not yet enough to confirm the discrepancy beyond doubt. The next goal is to refine that precision to better than 1.5%, a level of certainty “probably more precise than most people know how tall they are,” noted Martin Millon, postdoctoral fellow at ETH Zurich and the third corresponding author of the study.


About KCWI

The Keck Cosmic Web Imager (KCWI) is designed to provide visible band, integral field spectroscopy with moderate to high spectral resolution formats and excellent sky-subtraction. The astronomical seeing and large aperture of the telescope enables studies of the connection between galaxies and the gas in their dark matter halos, stellar relics, star clusters, and lensed galaxies. KCWI covers the blue side of the visible spectrum; the instrument also features the Keck Cosmic Reionization Mapper (KCRM), extending KCWI’s coverage to the red side of the visible spectrum. The combination of KCWI-blue and KCRM provides simultaneous high-efficiency spectral coverage across the entire visible spectrum. Support for KCWI was provided by the National Science Foundation, Heising-Simons Foundation, and Mt. Cuba Astronomical Foundation. Support for KCRM was provided by the National Science Foundation and Mt. Cuba Astronomical Foundation.

About Adaptive Optics (AO)
W. M. Keck Observatory is a distinguished leader in the field of adaptive optics (AO), a breakthrough technology that removes the distortions caused by the turbulence in the Earth’s atmosphere. Keck Observatory pioneered the astronomical use of both natural guide star (NGS) and laser guide star adaptive optics (LGS AO) and current systems now deliver images three to four times sharper than the Hubble Space Telescope at near-infrared wavelengths. AO has imaged the four massive planets orbiting the star HR8799, measured the mass of the giant black hole at the center of our Milky Way Galaxy, discovered new supernovae in distant galaxies, and identified the specific stars that were their progenitors. Support for this technology was generously provided by the Gordon and Betty Moore Foundation, Mt. Cuba Astronomical Foundation, NASA, NSF, and W. M. Keck Foundation.

About W. M. Keck Observatory
The W. M. Keck Observatory telescopes are among the most scientifically productive on Earth. The two 10-meter optical/infrared telescopes atop Maunakea on the Island of Hawaiʻi feature a suite of advanced instruments including imagers, multi-object spectrographs, high-resolution spectrographs, integral-field spectrometers, and world-leading laser guide star adaptive optics systems. Some of the data presented herein were obtained at Keck Observatory, which is a private 501(c) 3 non-profit organization operated as a scientific partnership among the California Institute of Technology, the University of California, and the National Aeronautics and Space Administration. The Observatory was made possible by the generous financial support of the W. M. Keck Foundation. The authors wish to recognize and acknowledge the very significant cultural role and reverence that the summit of Maunakea has always had within the Native Hawaiian community. We are most fortunate to have the opportunity to conduct observations from this mountain.


Wednesday, December 10, 2025

Gemini and Blanco Telescopes Unlock Clues to Origin of Longest Gamma-ray Burst Ever Observed

PR Image noirlab2531a
Artist’s illustration of GRB 250702B

PR Image noirlab2531b
GRB 250702B collage

PR Image noirlab2531c
Field around GRB 250702B

PR Image noirlab2531d
GRB 250702B host galaxy


Videos

Zooming in on GRB 250702B
PR Video GRB-zoom
Zooming in on GRB 250702B

Localizing GRB250802B
PR Video noirlab2531a
Localizing GRB250802B

GRB250802B timescale
PR Video noirlab2531b
GRB250802B timescale


Data acquired with multiple NSF NOIRLab facilities indicate gamma-ray burst lasting over seven hours resides in a massive, extremely dusty galaxy

Astronomers have observed the longest-ever gamma-ray burst — a powerful, extragalactic explosion that lasted over seven hours. Rapid follow-up observations with the U.S. Department of Energy-fabricated Dark Energy Camera and the International Gemini Observatory, funded in part by the U.S. National Science Foundation and operated by NSF NOIRLab, provided crucial information about the possible origin of this extraordinary event and the galaxy that hosts it.

Gamma-ray bursts (GRBs) are among the most powerful explosions in the Universe, second only to the Big Bang. The majority of these bursts are observed to flash and fade within a few seconds to minutes. But on 2 July 2025, astronomers were alerted to a GRB source that was exhibiting repeating bursts and would end up lasting over seven hours. This event, dubbed GRB 250702B, is the longest gamma-ray burst humans have ever witnessed.

GRB 250702B was first identified by NASA’s Fermi Gamma-ray Space Telescope (Fermi). Shortly after space-based telescopes detected the initial bursts in gamma-rays and pinpointed its on-sky location in X-rays, astronomers around the world launched campaigns to observe the event in additional wavelengths of light.

One of the first revelations about this event came when infrared observations acquired by ESO's Very Large Telescope (VLT) established that the source of GRB 250702B is located in a galaxy outside of ours, which until then had remained a question.

Following this, a team of astronomers led by Jonathan Carney, graduate student at the University of North Carolina at Chapel Hill, set out to capture the event’s evolving afterglow, or the fading light emissions that follow the initial, extremely bright flash of gamma-rays. The properties of these emissions can provide clues about the type of event that caused the GRB.

To better understand the nature of this record-breaking event, the team used three of the world’s most powerful ground-based telescopes: the NSF Víctor M. Blanco 4-meter Telescope and the twin 8.1-meter International Gemini Observatory telescopes [1]. This trio observed GRB 250702B starting roughly 15 hours after the first detection until about 18 days later. The team presents their findings in a paper published on 26 November in The Astrophysical Journal Letters.

The Blanco telescope is located in Chile at NSF Cerro Tololo Inter-American Observatory (CTIO), a Program of NSF NOIRLab. The International Gemini Observatory consists of the Gemini North telescope in Hawai‘i and the Gemini South telescope in Chile. It is partly funded by NSF and operated by NSF NOIRLab.

“The ability to rapidly point the Blanco and Gemini telescopes on short notice is crucial to capturing transient events such as gamma-ray bursts,” says Carney. “Without this ability, we would be limited in our understanding of distant events in the dynamic night sky.”

The team used a suite of instruments for their investigation: the NEWFIRM wide-field infrared imager and the 570-megapixel DOE-fabricated Dark Energy Camera (DECam), both mounted on the Blanco telescope, and the Gemini Multi-Object Spectrographs (GMOS) mounted on Gemini North and Gemini South.

Analysis of the observations revealed that GRB 250702B could not be seen in visible light, partly due to interstellar dust in our own Milky Way Galaxy, but more so due to dust in the GRB’s host galaxy. In fact, Gemini North, which provided the only close-to-visible-wavelength detection of the host galaxy, required nearly two hours of observations to capture the faint signal from beneath the swaths of dust.

Carney and his team then combined these data with new observations taken with the Keck I Telescope at W. M. Keck Observatory, the Magellan Baade Telescope, and the Fraunhofer Telescope at Wendelstein Observatory, as well as publicly available data from VLT, NASA’s Hubble Space Telescope (HST), and X-ray and radio observatories. They then compared this robust dataset with theoretical models, which are frameworks that explain the behavior of astronomical phenomena. Models can be used to make predictions that can then be tested against observational data to refine scientists' understanding.

The team’s analysis established that the initial gamma-ray signal likely came from a narrow, high-speed jet of material crashing into the surrounding material, known as a relativistic jet. The analysis also helped characterize the environment around the GRB and the host galaxy overall. They found that there is a large amount of dust surrounding the location of the burst, and that the host galaxy is extremely massive compared to most GRB hosts. The data support a picture in which the GRB source resides in a dense, dusty environment, possibly a thick lane of dust present in the host galaxy along the line-of-sight between Earth and the GRB source. These details about the environment of GRB 250702B provide important constraints on the system that produced the initial outburst of gamma-rays.

Of the roughly 15,000 GRBs observed since the phenomenon was first recognized in 1973, only a half dozen come close to the length of GRB 250702B. Their proposed origins range from the collapse of a blue supergiant star, a tidal disruption event, or a newborn magnetar. GRB 250702B, however, doesn’t fit neatly into any known category.

From the data obtained so far, scientists have a few ideas of possible origin scenarios: (1) a black hole falling into a star that’s been stripped of its hydrogen and is now almost purely helium, (2) a star (or sub-stellar object such as a planet or brown dwarf) being disrupted during a close encounter with a stellar compact object, such as a stellar black hole or a neutron star, in what is known as a micro-tidal disruption event, (3) a star being torn apart as it falls into an intermediate-mass black hole — a type of black hole with a mass ranging from one hundred to one hundred thousand times the mass of our Sun that is believed to exist in abundance, but has so far been very difficult to find. If it is the latter scenario, this would be the first time in history that humans have witnessed a relativistic jet from an intermediate mass black hole in the act of consuming a star.

While more observations are needed to conclusively determine the cause of GRB 250702B, the data acquired so far remain consistent with these novel explanations.

“This work presents a fascinating cosmic archaeology problem in which we’re reconstructing the details of an event that occurred billions of light-years away,” says Carney. “The uncovering of these cosmic mysteries demonstrates how much we are still learning about the Universe's most extreme events and reminds us to keep imagining what might be happening out there.”


Notes

[1] This study uses data obtained from several sources, including:


More information

This research was presented in a paper titled “Optical/infrared observations of the extraordinary GRB 250702B: a highly obscured afterglow in a massive galaxy consistent with multiple possible progenitors” to appear in The Astrophysical Journal Letters. DOI: 10.3847/2041-8213/ae1d67

The team is composed of J. Carney (University of North Carolina at Chapel Hill, USA), I. Andreoni (University of North Carolina at Chapel Hill, USA), B. O'Connor (Carnegie Mellon University, USA), J. Freeburn (University of North Carolina at Chapel Hill, USA), H. Skobe (Carnegie Mellon University, USA), L. Westcott (University of Manchester, UK), M. Busmann (Ludwig Maximilian University of Munich, Germany), A. Palmese (Carnegie Mellon University, USA), X. J. Hall (Carnegie Mellon University, USA), R. Gill (National Autonomous University of Mexico, Mexico/The Open University of Israel, Israel), P. Beniamini (The Open University of Israel, Israel/The George Washington University, USA), E. R. Coughlin (Syracuse University, USA), C. D. Kilpatrick (Northwestern University, USA), A. Anumarlapudi (University of North Carolina at Chapel Hill, USA), N. M. Law (University of North Carolina at Chapel Hill, USA), H. Corbett (University of North Carolina at Chapel Hill, USA), T. Ahumada (California Institute of Technology, USA), P. Chen (Zhejiang University, China), C. Conselice (University of Manchester, UK), G. Damke (NSF NOIRLab, USA), K. K. Das (California Institute of Technology, USA), A. Gal-Yam (Weizmann Institute of Science, Israel), D. Gruen (Ludwig Maximilian University of Munich, Germany/Excellence Cluster ORIGINS, Germany), S. Heathcote (NSF NOIRLab, USA), L. Hu (Carnegie Mellon University, USA), V. Karambelkar (California Institute of Technology, USA), M. Kasliwal (California Institute of Technology, USA), K. Labrie (NSF NOIRLab, USA), D. Pasham (Eureka Scientific, USA/The George Washington University, USA), A. Riffeser, M. Schmidt, K. Sharma, S. Wilke (Ludwig Maximilian University of Munich, Germany), & W. Zang (Center for Astrophysics | Harvard & Smithsonian, USA).

NSF NOIRLab, the U.S. National Science Foundation center for ground-based optical-infrared astronomy, operates the International Gemini Observatory (a facility of NSF, NRC–Canada, ANID–Chile, MCTIC–Brazil, MINCyT–Argentina, and KASI–Republic of Korea), NSF Kitt Peak National Observatory (KPNO), NSF Cerro Tololo Inter-American Observatory (CTIO), the Community Science and Data Center (CSDC), and NSF–DOE Vera C. Rubin Observatory (in cooperation with DOE’s SLAC National Accelerator Laboratory). It is managed by the Association of Universities for Research in Astronomy (AURA) under a cooperative agreement with NSF and is headquartered in Tucson, Arizona.

The scientific community is honored to have the opportunity to conduct astronomical research on I’oligam Du’ag (Kitt Peak) in Arizona, on Maunakea in Hawai‘i, and on Cerro Tololo and Cerro Pachón in Chile. We recognize and acknowledge the very significant cultural role and reverence of I’oligam Du’ag to the Tohono O’odham Nation, and Maunakea to the Kanaka Maoli (Native Hawaiians) community.

The Dark Energy Camera was designed specifically for the Dark Energy Survey (DES). It was funded by the U.S. Department of Energy (DOE) and was built and tested at DOE's Fermilab.


Links


Contacts:

Jonathan Carney
Graduate Student
University of North Carolina at Chapel Hill
Email:
jcarney@unc.edu

Josie Fenske
Public Information Officer
NSF NOIRLab
Email:
josie.fenske@noirlab.edu