Showing posts with label 3D model. Show all posts

Wednesday, August 01, 2018

A novel 3D technique to study the kinematics of lensed galaxies

This schematic view shows lensed images in the top row and the source plane in the bottom row. Lensed data are shown for three representative velocity channels of the data cube; the respective grid on the image plane is regular. For each velocity channel, the position of a pixel in the image plane corresponds to a position on the source plane (lower panel), determined by the lens equation. The points form the vertices of a triangular adaptive grid on the source plane. The source grid automatically adapts with the lensing magnification, so that there is a high pixel density in the high-magnification regions close to the caustics. © MPA


Gravitational lensing offers the possibility to study faint, far-away galaxies. MPA researchers have now developed the first three dimensional lens modelling method, which allows not only the reconstruction of the mass distribution of the foreground galaxy but also the kinematics of the background galaxy. Consequently, the matter content can now be studied also in young galaxies. 

In the standard model of cosmology, galaxies form as the baryonic gas cools at the centre of dark matter halos. They subsequently grow through accretion and mergers, leading to the hierarchical build-up of galaxy mass. While this general picture is well known, there are numerous physical mechanisms determining the relative contribution of baryons and dark matter within a galaxy and several open questions remain: What are the most important physical mechanisms that lead to the variety of galaxies we observe today? How do these mechanisms influence the matter content within galaxies? The answer to these questions is one of the significant challenges of modern astrophysics.

The study of galaxy kinematics has played a key role in this context. For example, in the local universe, the flatness of observed rotation curves is a well-established fact. The outer parts of the observed rotation curves cannot be explained by the mass predicted from the observed stellar and gas distribution and this discrepancy has been interpreted as evidence for the presence of a "dark matter" halo. Within high redshift galaxies, however, the relative content of baryons and dark matter is poorly known and also its evolution with cosmic time is not well understood. Neither current numerical simulations nor observational studies were able to produce consistent results on the fraction of dark matter within young galaxies.


The diverging results on the kinematics of high-redshift galaxies - and in consequence on their matter content - can be ascribed to the different methods used to overcome the observational limitations. The study of kinematics is mainly hampered by two factors: low spatial resolution and low signal-to-noise ratio.

These observational limitations can be successfully overcome by targeting galaxies for which the line of sight lies very close to a foreground galaxy. The gravitational field of the foreground galaxy then deflects the light from the distant background galaxy, producing distorted, magnified, and even multiple images of the background object. This effect is known as strong gravitational lensing and it offers the opportunity to study the background galaxies at high physical resolution and with good signal-to-noise. Furthermore, the magnifying power of gravitational lensing opens the possibility to study faint galaxies with low stellar masses, which are not easily accessible by surveys targeting unlensed galaxies.

The gravitational lensing group at MPA developed the first three dimensional lens modelling method (see Figure 1). This can be applied to 3D (IFU or radio) data, characterized by two spatial dimensions and one spectral dimension (velocity, frequency or wavelength), to simultaneously reconstruct both the mass distribution of the foreground galaxy and the kinematics of the background galaxy (see Figure 2).

For different mock background galaxies, these plots show the velocity fields (upper panels) and rotation curves (bottom panels). The velocity field is colour coded (see bar on the side) with red areas moving away from the observer and blue areas moving towards the observer. The original rotation curves are shown in blue and the best fit kinematic model is shown in red. The orange band shows the possible errors from uncertainties of the parameters that defined the rotation curves.  The mock data M1-M3 have input rotation curves described by functional forms, while for M4-M6 the rotation curves were taken from real galaxies. The rotation curves of M1 and M4 are typical of dwarf galaxies, the rotation curves of M2 and M5 are prototypes of spirals, while those of M3 and M6 are typical of massive spirals with a prominent bulge.© MPA


Our method represents a significant improvement over those used until now, since it does not require the use of high-resolution imaging data for the derivation of the lens parameters, as these are derived from the same 3D data used for the kinematics of the background galaxy. Moreover, the latter is not obtained by fitting on the source plane, but directly the lensed data. This is achieved in a hierarchical Bayesian fashion, where the kinematics on the source plane is essentially a hyper-parameter of the model (i.e. a parameter defining the prior). We are thus able to study the possible degeneracies between the lens and kinematic parameters and estimate the uncertainties consistently.

With our technique we are able to recover both the lens and the kinematics parameters with great accuracy under different observational conditions. Furthermore, we have successfully tested the capability of this new method in recovering a variety of rotation curves with shapes which are prototypes of different morphological galaxy types, from dwarf to massive spiral galaxies (see Figure 3).


Authors

Francesca Rizzo
PhD student
Phone: 2019
Email: frizzo@mpa-garching.mpg.de
Room: 107

Simona Vegetti
Scientific Staff
Phone: 2285
Email: svegetti@mpa-garching.mpg.de
Room: 105


Original Publication

1. Rizzo F., Vegetti S., Fraternali F., Di Teodoro E.
A novel 3D technique to study the kinematics of lensed galaxies

Monday, September 18, 2017

V745 Sco: Two Stars, Three Dimensions, and Oodles of Energy

V745 Sco
Credit: 3D Model: INAF-Osservatorio Astro. di Palermo/S.Orlando; 
Illustrated model: NASA/CXC/M.Weiss

JPEG (458.9 kb) - Large JPEG (4.4 MB) - Tiff (29.3 MB) - More Images 


of V745 Sco

animation

More Animations


For decades, astronomers have known about irregular outbursts from the double star system V745 Sco, which is located about 25,000 light years from Earth. Astronomers were caught by surprise when previous outbursts from this system were seen in 1937 and 1989. When the system erupted on February 6, 2014, however, scientists were ready to observe the event with a suite of telescopes including NASA’s Chandra X-ray Observatory.

V745 Sco is a binary star system that consists of a red giant star and a white dwarf locked together by gravity. These two stellar objects orbit so closely around one another that the outer layers of the red giant are pulled away by the intense gravitational force of the white dwarf. This material gradually falls onto the surface of the white dwarf. Over time, enough material may accumulate on the white dwarf to trigger a colossal thermonuclear explosion, causing a dramatic brightening of the binary called a nova. Astronomers saw V745 Sco fade by a factor of a thousand in optical light over the course of about 9 days.

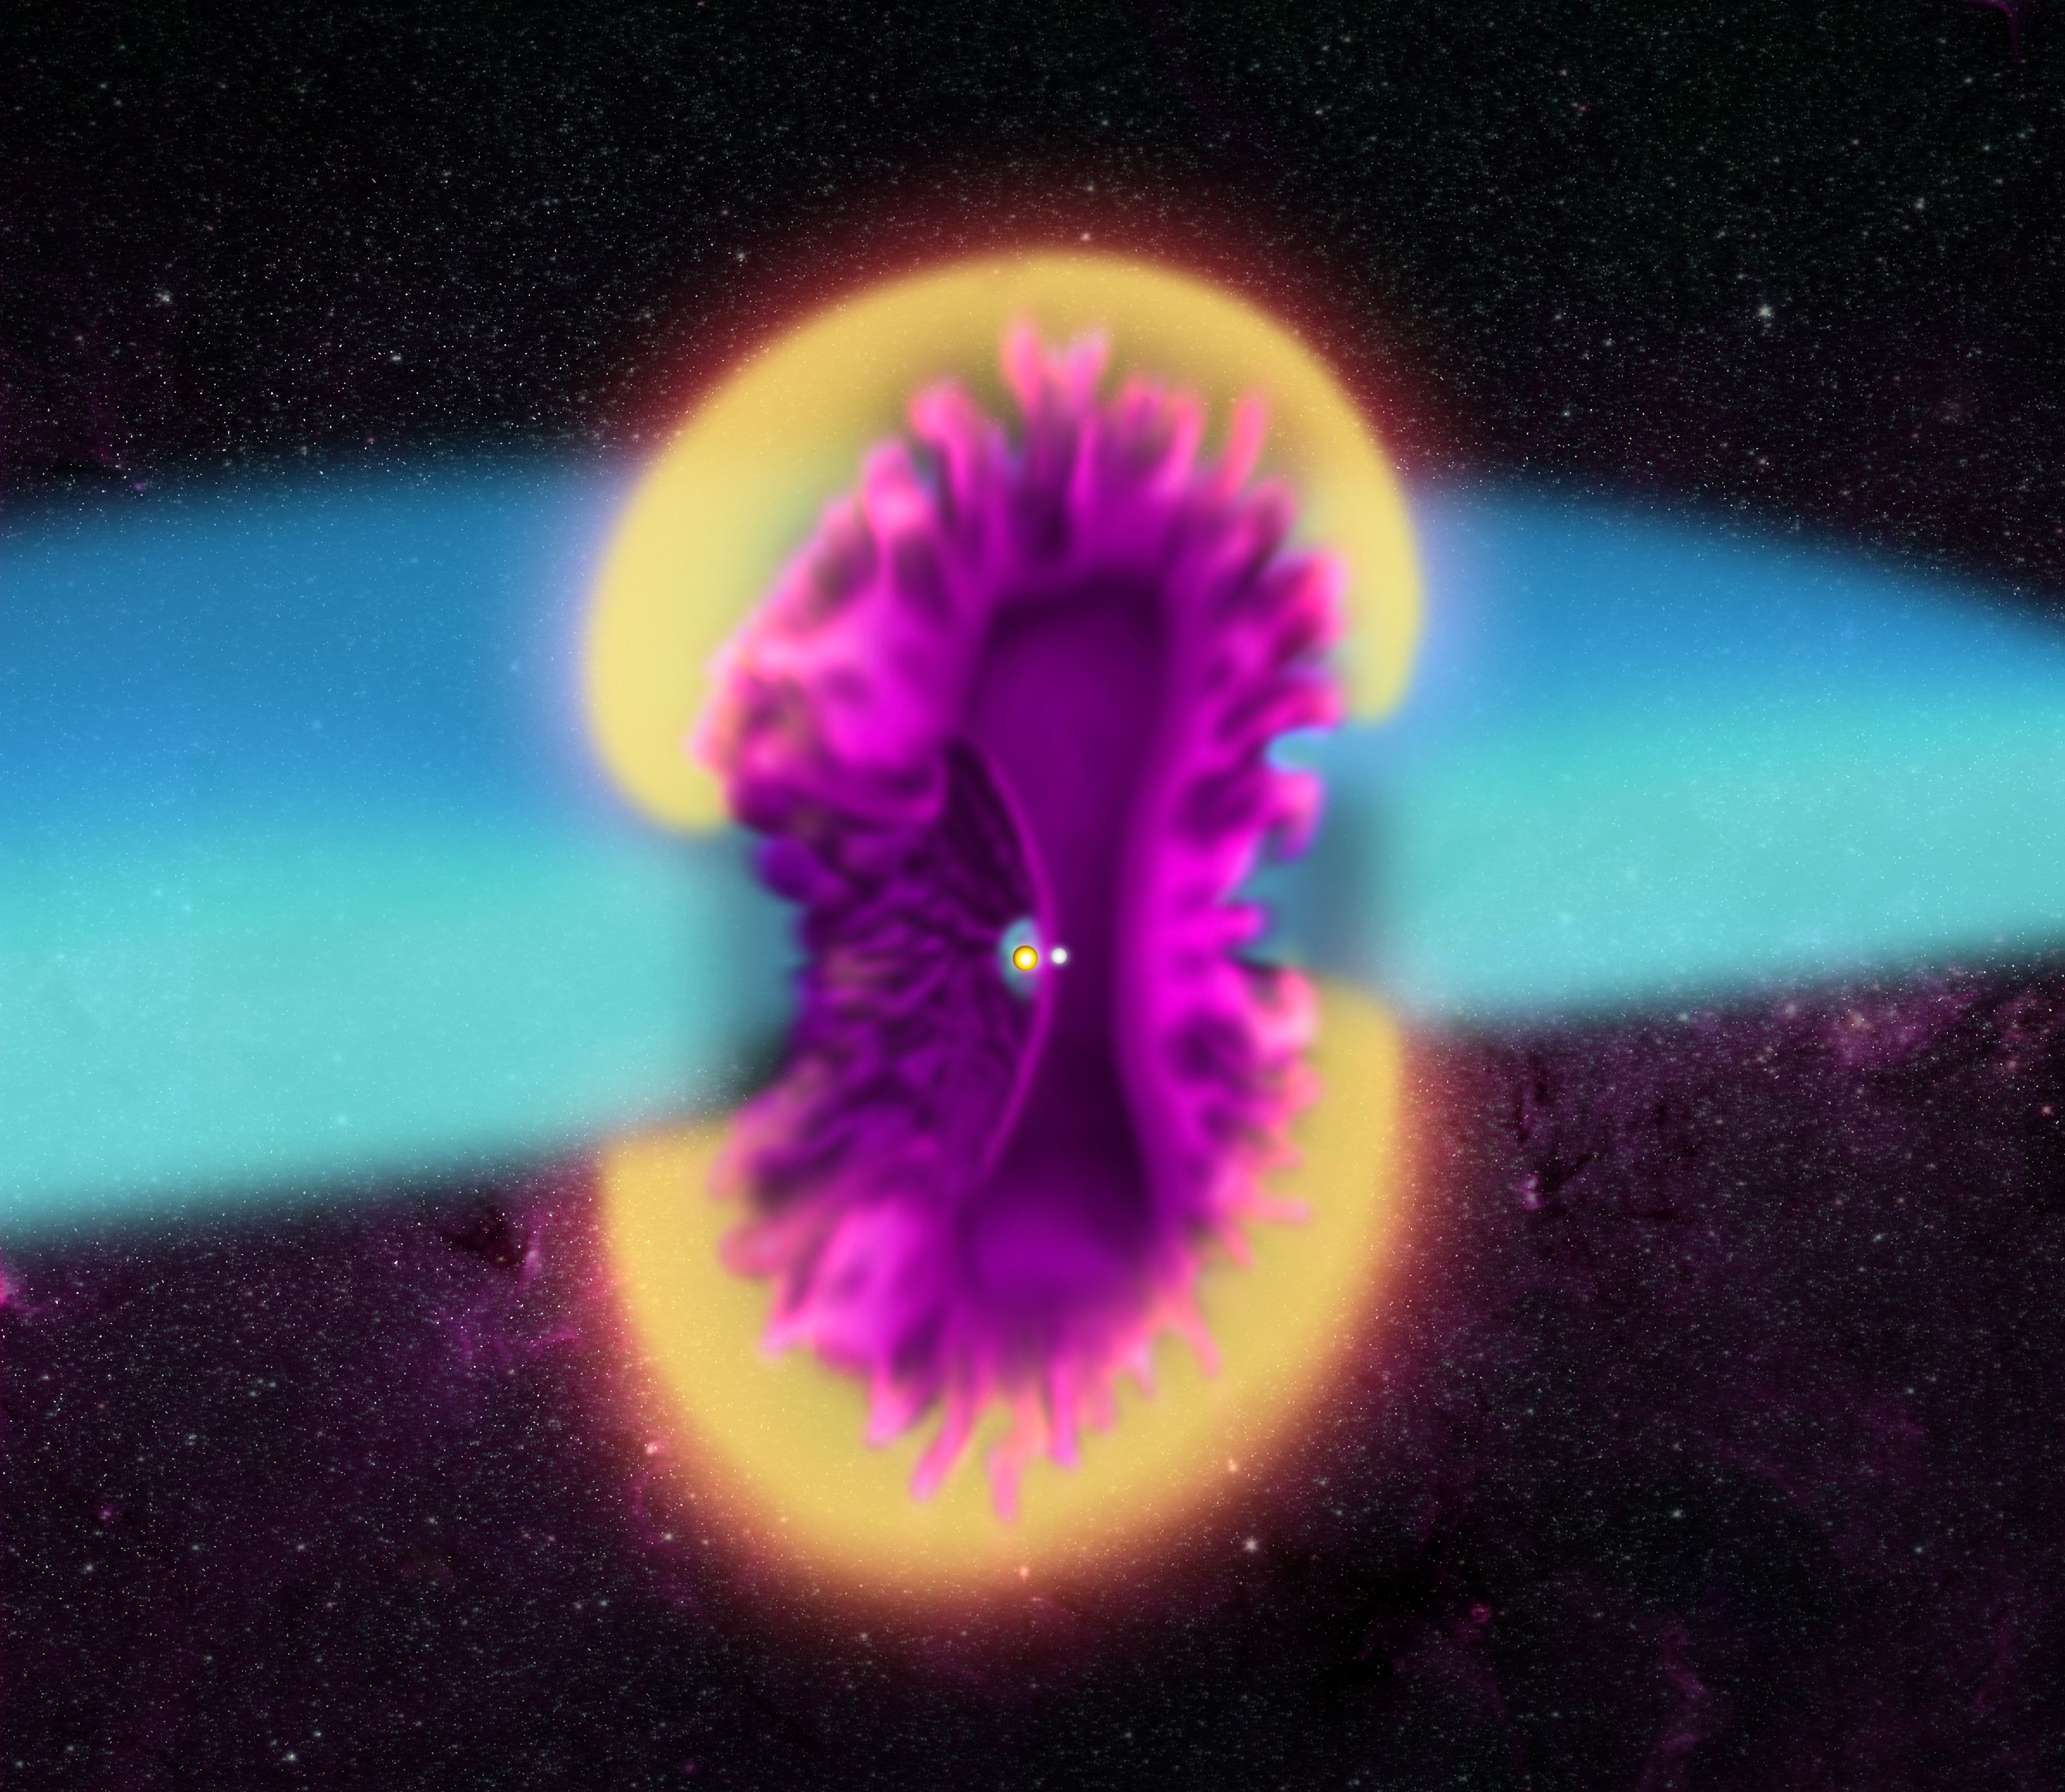
Astronomers observed V745 Sco with Chandra a little over two weeks after the 2014 outburst. Their key finding was it appeared that most of the material ejected by the explosion was moving towards us. To explain this, a team of scientists from the INAF-Osservatorio Astronomico di Palermo, the University of Palermo, and the Harvard-Smithsonian Center for Astrophysics constructed a three-dimensional (3D) computer model of the explosion, and adjusted the model until it explained the observations. In this model they included a large disk of cool gas around the equator of the binary caused by the white dwarf pulling on a wind of gas streaming away from the red giant.

The computer calculations showed that the nova explosion’s blast wave and ejected material were likely concentrated along the north and south poles of the binary system. This shape was caused by the blast wave slamming into the disk of cool gas around the binary. This interaction caused the blast wave and ejected material to slow down along the direction of this disk and produce an expanding ring of hot, X-ray emitting gas. X-rays from the material moving away from us were mostly absorbed and blocked by the material moving towards Earth, explaining why it appeared that most of the material was moving towards us.

In the figure (pictured above) showing the new 3D model of the explosion, the blast wave is yellow, the mass ejected by the explosion is purple, and the disk of cooler material, which is mostly untouched by the effects of the blast wave, is blue. The cavity visible on the left side of the ejected material (see the labeled version) is the result of the debris from the white dwarf's surface being slowed down as it strikes the red giant. Below is an optical image from Siding Springs Observatory in Australia.

Optical Image of V745 Sco 
This image of V745 Sco (also known as Nova 1937) was taken on February 6, 2014 by S. O'Conner (OCN, St. Georges, Bermuda). Scale: 16 arcmin x 16 arcmin. (Credit: S. O'Connor (OCN, St. Georges, Bermuda)

An extraordinary amount of energy was released during the explosion, equivalent to about 10 million trillion hydrogen bombs. The authors estimate that material weighing about one tenth of the Earth’s mass was ejected.

While this stellar-sized belch was impressive, the amount of mass ejected was still far smaller than the amount what scientists calculate is needed to trigger the explosion. This means that despite the recurrent explosions, a substantial amount of material is accumulating on the surface of the white dwarf. If enough material accumulates, the white dwarf could undergo a thermonuclear explosion and be completely destroyed. Astronomers use these so-called Type Ia supernovas as cosmic distance markers to measure the expansion of the Universe.

The scientists were also able to determine the chemical composition of the material expelled by the nova. Their analysis of this data implies that the white dwarf is mainly composed of carbon and oxygen.

A 3D print of the model was also created (pictured below). This 3D print was simplified and printed in two parts, the blast wave (shown here in grey) and the ejected material (shown here in yellow).


A paper describing these results was published in the February 1st, 2017 issue of the Monthly Notices of the Royal Astronomical Society and is available online. The authors are Salvatore Orlando from the INAF-Osservatorio Astronomico di Palermo in Italy, Jeremy Drake from the Harvard-Smithsonian Center for Astrophysics in Cambridge, MA and Marco Miceli from the University of Palermo.

NASA's Marshall Space Flight Center in Huntsville, Alabama, manages the Chandra program for NASA's Science Mission Directorate in Washington. The Smithsonian Astrophysical Observatory in Cambridge, Massachusetts, controls Chandra's science and flight operations.


Fast Facts for V745 Sco:

Coordinates (J2000): RA 17h 55m 22.2s | Dec -33° 14´ 58.6"
Constellation: Scorpius
Instrument: ACIS
References: Orlando, S. et al., 2017, MNRAS, 464, 5003; arXiv:1610.05692
Distance Estimate: About 25,000 light years


Source: NASA’s Chandra X-ray Observatory

Monday, July 14, 2014

Astronomers bring the third dimension to a doomed star's outburst

A new shape model of the Homunculus Nebula reveals protrusions, trenches, holes and irregularities in its molecular hydrogen emission. The protrusions appear near a dust skirt seen at the nebula's centre in visible light (inset) but not found in this study, so they constitute different structures.  Credit: NASA Goddard Space Flight Centre, inset: NASA, ESA, Hubble SM4 ERO Team. Hi-res Image
 
Astronomers have created a detailed 3D model of the expanding cloud of debris produced in the outburst of a doomed star. The model can be reproduced at home by anyone with a 3D printer. The team report their findings in a paper published today in the journal Monthly Notices of the Royal Astronomical Society.

In the middle of the 19th century, the massive binary system eta Carinae (η Car) underwent an eruption that ejected more than 10 solar masses of debris and briefly made it the second-brightest star in the sky. The researchers used extensive new observations to create a detailed 3D model of the expanding debris cloud.

"Our model indicates that this vast shell of gas and dust has a more complex origin than is generally assumed," said Thomas Madura, of NASA's Goddard Space Flight Center and a member of the team. "For the first time, we see evidence suggesting that intense interactions between the stars in the central binary played a significant role in sculpting the nebula we see today."

Eta Carinae lies about 7,500 light-years away in the southern constellation of Carina and is one of the most massive binary systems astronomers can study in detail. The smaller star is about 30 times the mass of the sun and may be as much as a million times more luminous. The primary star contains about 90 solar masses and emits 5 million times the sun's energy output. Both stars are fated to end their lives in spectacular supernova explosions.

Animation of the 3D Homunculus Nebula model
Credit: NASA Goddard Space Flight Center Conceptual Image La
 
Between 1838 and 1845, eta Carinae underwent a period of unusual variability during which it briefly outshone Canopus, normally the second-brightest star. As a part of this event, which astronomers call the Great Eruption, a gaseous shell containing at least 10 and perhaps as much as 40 times the sun's mass was shot into space. This material forms a twin-lobed dust-filled cloud known as the Homunculus Nebula, which is now about a light-year long and continues to expand at more than 1.3 million mph (2.1 million km/h).

Using the European Southern Observatory's Very Large Telescope and its X-Shooter spectrograph over two nights in March 2012, the team observed the nebula in near-infrared, visible and ultraviolet wavelengths in 92 separate areas, making the most complete map to date. The researchers have used the spatial and velocity information provided by this data to create the first high-resolution 3D model of the Homunculus Nebula.

The shape model was developed using only a single emission line of near-infrared light emitted by molecular hydrogen gas. The characteristic light at 2.12 microns shifts in wavelength slightly depending on the speed and direction of the expanding gas, allowing the team to probe even dust-obscured portions of the Homunculus Nebula that face away from Earth.

"Our next step was to process all of this using 3D modelling software I developed in collaboration with Nico Koning from the University of Calgary in Canada. The program is simply called 'Shape,' and it analyses and models the three-dimensional motions and structure of nebulae in a way that can be compared directly with observations," said Wolfgang Steffen, of the National Autonomous University of Mexico and the lead author of the paper.
 
NASA astrophysicists Ted Gull and Tom Madura discuss eta Carinae and their new model of the Homunculus Nebula, a shell of gas and dust ejected during the star's mid-19th century eruption. Credit: NASA Goddard Space Flight Center. Video Youtube
 
The new shape model confirms several features identified by previous studies, including pronounced holes located at the ends of each lobe and the absence of any extended molecular hydrogen emission from a dust skirt apparent in visible light near the centre of the nebula. New features include curious arm-like protrusions emanating from each lobe near the dust skirt; vast, deep trenches curving along each lobe; and irregular divots on the side facing away from Earth.

"One of the questions we set out to answer with this study is whether the Homunculus contains any imprint of the star's binary nature, since previous efforts to explain its shape have assumed that both lobes were more or less identical and symmetric around their long axis," explained team member Jose Groh, of the University of Geneva. "The new features strongly suggest that interactions between eta Carinae's stars helped mould the Homunculus."

Every 5.5 years, when their orbits carry them to their closest approach, the immense and brilliant stars of eta Carinae are only as far apart as the distance between Mars and the Sun. Both stars possess powerful gaseous outflows called stellar winds, which interact most dramatically during closest approach. The faster wind from the smaller star then carves a tunnel through the denser wind of its companion. The opening angle of the cavity created closely matches the extent of the trenches (130 degrees) and the angle between the arm-like protrusions (110 degrees). This indicates that the shape of the nebula likely continues to carry an impression from a binary close approach around the time of the Great Eruption.

A 3D-printed model of the Homunculus Nebula is compared to a Hubble Space Telescope image of the object.  Credit: NASA Goddard Space Flight Center/Ed Campion. Hi-Res Image

Once the researchers had developed their Homunculus model, they took things one step further. They converted it to a format that can be used by 3D printers and made the file available along with the published paper.

"Now anyone with access to a 3D printer can produce their own version of this incredible object," said Theodore Gull, who is also at Goddard and a co-author of the paper. "While 3D-printed models will make a terrific visualization tool for anyone interested in astronomy, I see them as particularly valuable for the blind, who now will be able to compare embossed astronomical images with a scientifically accurate representation of the real thing."

Media contacts

Francis Reddy
NASA Goddard Space Flight Center

francis.j.reddy@nasa.gov
+1 301 286 4453

Dr Keith Smith
Royal Astronomical Society
+44 (0)20 7734 4582

kts@ras.org.uk

Science contact

Prof. Wolfgang Steffen
National Autonomous University of Mexico
Please contact Francis Reddy (details above) in the first instance.


Images and captions


The 3D printing model is available, along with a custom stand.
Credit: Steffen, W., Teodoro, M., Madura, T., et al. (2014)
More media and captions are available from http://svs.gsfc.nasa.gov/goto?11568

Further information

This research has been published in Steffen W. el al., 2014, "The three-dimensional structure of the Eta Carinae Homunculus", Monthly Notices of the Royal Astronomical Society, vol. 442, p. 3316-3328, published by Oxford University Press.
Notes for editors

The Royal Astronomical Society (RAS), founded in 1820, encourages and promotes the study of astronomy, solar-system science, geophysics and closely related branches of science. The RAS organises scientific meetings, publishes international research and review journals, recognizes outstanding achievements by the award of medals and prizes, maintains an extensive library, supports education through grants and outreach activities and represents UK astronomy nationally and internationally. Its more than 3800 members (Fellows), a third based overseas, include scientific researchers in universities, observatories and laboratories as well as historians of astronomy and others. Follow the RAS on Twitter via @royalastrosoc