Friday, April 20, 2012

Hinode and SOHO Paint An Asymmetrical Picture Of the Sun

In 2008 in the northern hemisphere of the sun (left) Hinode observed large patches of negative polarity, shown in orange. In 2011, the same area showed much smaller patches and a more even distribution of negative and positive (blue) regions. Credit: JAXA/Hinode. View larger - View 2008 only - View 2011 only

Approximately every 11 years the magnetic field on the sun reverses completely – the north magnetic pole switches to south, and vice versa. It’s as if a bar magnet slowly lost its magnetic field and regained it in the opposite direction, so the positive side becomes the negative side. But, of course, the sun is not a simple bar magnet and the causes of the switch, not to mention the complex tracery of moving magnetic fields throughout the eleven-year cycle, are not easy to map out.

Mapping such fields, however, is a crucial part of understanding how – and, in turn, when – the sun will exercise its next flip. This flip coincides with the greatest solar activity seen on the sun in any given cycle, known as "solar maximum."

While the cycle unfolds with seeming regularity every 11 years, in two upcoming papers scientists highlight just how asymmetrical this process actually is. Currently the polarity at the north of the sun appears to have decreased close to zero – that is, it seems to be well into its polar flip from magnetic north to south -- but the polarity at the south is only just beginning to decrease.

"Right now, there's an imbalance between the north and the south poles," says Jonathan Cirtain, a space scientist at NASA's Marshall Space Flight Center in Huntsville, Ala., who is also NASA's project scientist for a Japanese solar mission called Hinode. "The north is already in transition, well ahead of the south pole, and we don't understand why."

One of the two papers relies on Hinode data that shows direct observations of this polar switch. The other paper makes use of a new technique observing microwave radiation from the sun's polar atmosphere to infer the magnetic activity on the surface. The asymmetry described in the papers belies models of the sun that assume that the sun's north and south polarities switch at the same time. In addition, both papers agree that the switch is imminent at the north pole, well in advance of general predictions that solar maximum for this cycle will occur in 2013. Lastly, the direct Hinode results also suggest a need to re-examine certain other solar models as well.

Measuring the magnetic activity near the poles isn't easy because all of our solar telescopes view the sun approximately at its equator, offering only an oblique view of the poles, when they require a top-down view for accurate magnetic measurements. Hinode can observe this activity annually with its high resolution Solar Optical Telescope that can map magnetic fields when observing them from near the equator. The microwave radiation technique described in the second paper makes use of the discovery in 2003 that as the sun moves toward solar maximum, giant eruptions on the sun, called prominence eruptions – which during solar minimum, are concentrated at lower solar latitudes -- begin to travel toward higher latitudes near the poles. In addition, the polar brightness in the microwave wavelengths declines to very low values.

"These prominence eruptions are associated with increased solar activity such as coronal mass ejections or CMEs, so CMEs originating from higher latitudes also point to an oncoming solar maximum," says Nat Gopalswamy. Gopalswamy is a solar scientist at NASA's Goddard Space Flight Center in Greenbelt, Md. who is the first author on the microwave observations paper, which was accepted by The Astrophysical Journal on April 11, 2012. "When we start to see prominence eruptions above 60 degrees latitude on the sun, then we know that we are reaching solar maximum."

These images from Hinode show magnetism in the southern hemisphere in 2009 (left) and 2011 (right). The large blue patches show regions of positive polarity, which remain present even in 2011. Credit: JAXA/Hinode. View larger - View 2009 only - View 2011 only

To look at the prominence eruptions toward the poles, Gopalswamy and his team used observations from Japan's Nobeyama Solar Radio Observatory telescopes and the joint ESA/NASA mission the Solar Heliospheric Observatory (SOHO). They watched the sun in the microwave wavelengths – which are used to observe the area of the sun's atmosphere just above the surface, known as the chromosphere. Gopalswamy created precise techniques to use such microwave radiation to measure the intensity of magnetic activity on the sun's surface at the poles. By mapping the brightness of the microwave radiation throughout the chromosphere, the scientists showed that the intensity at the north pole has already dropped to the threshold that was reached in the last solar maximum cycle, suggesting the onset of solar max there. This is backed by the fact that prominence eruptions are also occurring at high latitudes in the north. Eruption activity in the south half of the sun, however, is only just beginning to increase – the first CME occurred there in early March 2012.

The Hinode data also shows this discrepancy between the north and the south. The Hinode results are reported by a Japanese team, led by Daikou Shiota a solar scientist at RIKEN Institute of Physics and Chemical Research, and were recently submitted to The Astrophysical Journal for publication. Shiota and his team used Hinode to observe the magnetic map of the poles every month since September of 2008. Early maps showed large, strong concentrations of magnetic fields that are almost all magnetically negative in polarity. Recent maps, however, show a different picture. Not only are the patches of magnetism smaller and weaker, but now there is a great deal of positive polarity visible as well. What once pointed to a strongly negative north pole, is now a weakly magnetized, mixed pole that will become neutral – which occurs at solar maximum -- within the month according to the team's predictions.

"This is the first direct observation of this field reversal," says Cirtain. "And it is extremely important to understanding how the sun's magnetism generates the solar cycle."

Ted Tarbell is the principal investigator for Hinode's Solar Optical Telescope at Lockheed Martin in Palo Alto, Calif., and he points out that the direct measurements showed the progress of the pole reversal, and highlights the earlier portion of the cycle in 2008. Typical models of the magnetic flip, suggest that as active regions rotate around the equator, their higher, trailing edge – which is almost always the opposite polarity from the pole in their hemisphere – drift upward, eventually dominating the status quo and turning positive to negative or negative to positive. The Hinode data show that this transition at the north began before such drifting had a chance to occur.

"This is one of the most interesting things in this Hinode paper to me," says Tarbell. "How did the polar reversal start so early, even though the onset of the solar cycle, that is, increased activity at lower latitudes, hadn't begun yet?"

Tarbell thinks these observations mean that this model, too, may need to be re-examined.

Such adjustments to models are of course expected whenever new and better data is collected. Indeed, David Hathaway, who is a solar scientist at NASA's Marshall, and who is a co-author on the microwave observations paper with Gopalswamy, points out that the idea that asymmetries exist in the sun is not completely new. Other work has recently emphasized symptoms of this asymmetry, measuring, for example, more sunspots in the northern hemisphere than in the south at the moment. "But most of the well-developed models don't incorporate the asymmetry in them," Hathaway says. "More complicated models that incorporate asymmetries do exist, but they have other ways in which they fail to match observations."

Continued study on these differences, using the best observatories as well as new techniques for analysis will help expand and improve our understanding of the sun, its 11-year cycle, and the great eruptions that occur on its surface.

Scientists will also keep their eye on the current cycle – numbered Solar Cycle 24 – because a polar switch at the north that is sooner than was expected also implies this may be a fairly small cycle in terms of the number of sunspots and amount of solar activity.

Related Links:
Hinode site
SOHO site

Karen C. Fox
NASA's Goddard Space Flight Center, Greenbelt, MD

Wednesday, April 18, 2012

Watch it Rain on the Sun


Flare Now & Later Rain, April 16, 2012
Credit: NASA/JAXA Hinode

The big solar flare and coronal mass ejection earlier this week created an unusual event on the Sun: it rained. Not water drops of course, but coronal rain. After the eruption, blobs of plasma fell back to the surface of the Sun, sometimes making ‘splashes’ where they hit. Coronal rain is plasma gas that condenses in the corona and then descends back to the surface. It has long been a mystery and its motion has perplexed solar physicists. For some reason, coronal rain falls much slower than is expected for plasma falling due to the huge gravitational pull of the Sun. Many times, rather than falling straight down — as it would if gravity was the only force pulling on it — the plasma rain follows invisible magnetic field lines, which can be detected by instruments on board watchful spacecraft.

This video was produced from data from the Solar Optical Telescope on NASA/JAXA’s Hinode spacecraft of the big M1/7 class flare that erupted on April 16 from Active Region 1461. Scientists say thanks to spacecraft like Hinode and the Solar Dynamic Observatory, this phenomenon can be studied in much more detail so that they can better understand this unusual event.

by Nancy Atkinson

Nancy Atkinson is Universe Today's Senior Editor. She also is the host of the NASA Lunar Science Institute podcast and works with the Astronomy Cast and 365 Days of Astronomy podcasts. Nancy is also a NASA/JPL Solar System Ambassador.

Where Do the Highest-Energy Cosmic Rays Come From? Probably Not from Gamma-Ray Bursts

The IceCube Collaboration, in which Berkeley Lab is a crucial contributor, has taken the first steps toward clearing up a cosmic mystery – and made the mystery more intriguing

IceCube’s 5,160 digital optical modules are suspended from 86 strings reaching a mile and a half below the surface at the South Pole. Each sphere contains a photomultiplier tube and electronics to capture the faint flashes of muons speeding through the ice, their direction and energy – and thus that of the neutrinos that created them – tracked by multiple detections. At lower left is the processed signal of an energetic muon moving upward through the array, created by a neutrino that traveled all the way through the Earth.

The IceCube neutrino telescope encompasses a cubic kilometer of clear Antarctic ice under the South Pole, a volume seeded with an array of 5,160 sensitive digital optical modules (DOMs) that precisely track the direction and energy of speeding muons, massive cousins of the electron that are created when neutrinos collide with atoms in the ice. The IceCube Collaboration recently announced the results of an exhaustive search for high-energy neutrinos that would likely be produced if the violent extragalactic explosions known as gamma-ray bursts (GRBs) are the source of ultra-high-energy cosmic rays.

“According to a leading model, we would have expected to see 8.4 events corresponding to GRB production of neutrinos in the IceCube data used for this search,” says Spencer Klein of the U.S. Department of Energy’s Lawrence Berkeley National Laboratory (Berkeley Lab), who is a long-time member of the IceCube Collaboration. “We didn’t see any, which indicates that GRBs are not the source of ultra-high-energy cosmic rays.”

“This result represents a coming-of-age of neutrino astronomy,” says Nathan Whitehorn from the University of Wisconsin-Madison, who led the recent GRB research with Peter Redl of the University of Maryland. “IceCube, while still under construction, was able to rule out 15 years of predictions and has begun to challenge one of only two major possibilities for the origin of the highest-energy cosmic rays, namely gamma-ray bursts and active galactic nuclei.”

Redl says, “While not finding a neutrino signal originating from GRBs was disappointing, this is the first neutrino astronomy result that is able to strongly constrain extra-galactic astrophysics models, and therefore marks the beginning of an exciting new era of neutrino astronomy.”

The IceCube Collaboration’s report on the search appears in the April 19, 2012, issue of the journal Nature.


Blazing fireballs and nature’s accelerators

Cosmic rays are energetic particles from deep in outer space – predominately protons, the bare nuclei of hydrogen atoms, plus some heavier atomic nuclei. Most probably acquire their energy when naturally accelerated by exploding stars. A few rare cosmic rays pack an astonishing wallop, however, with energies prodigiously greater than the highest ever attained by human-made accelerators like CERN’s Large Hadron Collider. Their sources are a mystery.

“Nature is capable of accelerating elementary particles to macroscopic energies,” says Francis Halzen, IceCube’s principal investigator and a professor of physics at the University of Wisconsin-Madison. “There are basically only two ideas on how she does this: in gravitationally driven particle flows near the supermassive black holes at the centers of active galaxies, and in the collapse of stars to a black hole, seen by astronomers as gamma ray bursts.”

Klein, the deputy director of Berkeley Lab’s Nuclear Science Division (NSD, explains that in active galactic nuclei (AGNs) “the black holes suck in matter and eject enormous particle jets, perpendicular to the galactic disk, which could act as strong linear accelerators.” Of gamma-ray bursts he says, “Some GRBs are thought to be collapses of supermassive stars – hypernova – while others are thought to be collisions of black holes with other black holes or neutron stars. Both types produce brief but intense blasts of radiation.”

The massive fireballs move away from the explosion at nearly the speed of light, releasing most of their energy as gamma rays. The fireballs that give rise to this radiation might also accelerate particles to very high energies through a jet mechanism similar to that in AGNs, although compressed into a much smaller volume.

A fireball produced in a black-hole collision or by the collapse of a gigantic star can form jets in which protons and heavier nuclei are accelerated and shock waves produce a burst of gamma rays. The fireball model also predicts the creation of very high energy neutrinos, which ought to be detectable shortly after the gamma-ray burst becomes visible from Earth. (Image credit Dana Berry and NASA)

Accelerated protons in a GRB’s jets should interact with the intense gamma-ray background and strong magnetic fields to produce neutrinos with energies about five percent of the proton energy, together with much higher-energy neutrinos near the end of the acceleration process.

Neutrinos come in three different types that change and mix as they travel to Earth; the total flux can be estimated from the muon neutrinos that IceCube concentrates on. The muons these neutrinos create can travel up to 10 kilometers through the Antarctic ice. Thus many neutrino interactions occur outside the actual dimensions of the IceCube array but are nevertheless visible to IceCube’s detectors, effectively enlarging the telescope’s aperture.

“The way we search for GRB neutrinos is that we build a huge detector and then we just watch and wait,” says Klein. “When it comes to detecting neutrinos, size really does matter.”

IceCube watches with its over 5,000 DOMs, digital optical modules conceived, designed, and proven by Berkeley Lab physicists and engineers, which detect the faint light from each passing muon. Scientists can rely on their remarkable dependability to wait as long as necessary. Almost no failures occurred after the DOMs were installed; 98 percent are working perfectly and another one percent are usable. Now frozen in the ice, they will never be seen again.

IceCube records a million times more muon tracks moving downward through the ice than upward, mainly debris from direct cosmic-ray hits on the surface or secondary products of cosmic-ray collisions with Earth’s atmosphere. Muons moving upward, however, signal neutrinos that have passed all the way through Earth. When the telescope is searching for bright neutrino sources in the northern sky, the planet makes a marvelous filter.

Zeroing in on gamma-ray bursts

A network of satellites circles the globe and reports almost 700 GRBs each year, which readily stand out from the cosmic background. They’re timed, their positions are triangulated, and the data are distributed by an international group of researchers. Some blaze for less than two seconds and others for a few minutes. Neutrinos they produce should arrive at IceCube during the burst or close to it.

“IceCube’s precision timing and charge resolution, plus its large size, allow it to precisely determine where a neutrino comes from – often to within one degree,” says Lisa Gerhardt of Berkeley Lab, whose research has focused on detecting ultra-high-energy neutrino interactions. Indeed, a GRB neutrino should send a muon track through the ice with an angular resolution of about one degree with respect to the GRB’s position in the sky.

IceCube researchers sifted through data on 307 GRBs from two periods in 2008 and 2009 when IceCube was still under construction, looking for records of muon trails coincident in time and space with GRBs. (Forty strings, with 60 DOMs each, had been installed by 2008, and 59 strings by 2009. The finished IceCube has 86 strings.) The fireball model predicted that when the expected flux from all the samples had been summed, at least 8.4 related muon events would be found within 10 degrees of a GRB during the seconds or minutes when it was blazing brightly.

“Different calculations of the neutrino flux from GRBs are based on slightly different assumptions about how the neutrinos are produced and on uncertainties such as how fast the fireball is moving toward us,” says Klein. “Among the published predictions, the lowest estimate of neutrino production is about a quarter of what the fireball model predicts. That’s barely consistent with our zero observations.”

Says Halzen, “After observing gamma-ray bursts for two years, we have not detected the telltale neutrinos for cosmic ray acceleration.”

If it’s likely that GRBs aren’t up to the task of accelerating cosmic rays to ultra-high-energies, what are the options? Klein points to a salient fact about natural accelerators: a small, rapidly spinning object must accelerate particles very rapidly; this requires an extremely energy-dense environment, and there are many ways the particles could lose energy during the acceleration process.

“But remember the other popular model of ultra-high-energy cosmic rays, active galactic nuclei,” says Klein. “GRBs are small, but AGNs are big – great big accelerators that may be able to accelerate particles to very high energies without significant loss.”

Are AGNs the real source of the highest-energy cosmic rays? IceCube has looked for neutrinos from active galactic nuclei, but as yet the data sets are not sensitive enough to set significant limits. For now, IceCube has nothing to say on the subject – beyond the fact that the fireball model of GRBs can’t meet the specs.

###


“An absence of neutrinos associated with cosmic ray acceleration in gamma-ray bursts,” by R. Abbasi et al (the IceCube Collaboration), appears in the April 19, 2012, issue of Nature and is available online to subscribers at http://www.nature.com/nature/index.html. Collaboration members currently or formerly with Berkeley Lab include Keith Beattie, Kirill Filimonov, Lisa Gerhardt, Ariel Goldschmidt, Chang Hyon Ha, Spencer Klein, Howard Matis, Sandra Miarecki, David Nygren, Gerald Przybylski, Thorsten Stezelberger, and Robert Stokstad; Filimonov, Gerhardt, Ha, Klein, and Miarecki are also with the University of California at Berkeley.

The IceCube Collaboration includes over 260 researchers from 42 institutions in 11 countries and is supported by agencies and foundations in Belgium, Germany, Japan, and Sweden, with primary funding from the National Science Foundation and major support from the U.S. Department of Energy’s Office of Science. Visit the IceCube website at http://icecube.wisc.edu/, read the press release concerning this work at http://icecube.wisc.edu/news/view/52, and access a selection of images at http://icecube.wisc.edu/~norris/nature_press/.

At Berkeley Lab, DOE’s Office of Science supports participation in IceCube primarily through the National Energy Research Scientific Computing Center (NERSC). Visit http://www.nersc.gov/.

DOE’s Office of Science is the single largest supporter of basic research in the physical sciences in the United States, and is working to address some of the most pressing challenges of our time. For more information, please visit science.energy.gov.

Lawrence Berkeley National Laboratory addresses the world’s most urgent scientific challenges by advancing sustainable energy, protecting human health, creating new materials, and revealing the origin and fate of the universe. Founded in 1931, Berkeley Lab’s scientific expertise has been recognized with 13 Nobel prizes. The University of California manages Berkeley Lab for the U.S. Department of Energy’s Office of Science. For more, visit www.lbl.gov.

Scientific contact:

Spencer Klein,
510-486-5470,
Email: srklein@lbl.gov

Serious Blow to Dark Matter Theories?

Artist’s impression of the expected dark matter
distribution around the Milky Way

Artist’s impression of the expected dark matter
distribution around the Milky Way (annotated)

Video

Artist’s impression of the expected dark matter
distribution around the Milky Way


New study finds mysterious lack of dark matter in Sun’s neighbourhood

The most accurate study so far of the motions of stars in the Milky Way has found no evidence for dark matter in a large volume around the Sun. According to widely accepted theories, the solar neighbourhood was expected to be filled with dark matter, a mysterious invisible substance that can only be detected indirectly by the gravitational force it exerts. But a new study by a team of astronomers in Chile has found that these theories just do not fit the observational facts. This may mean that attempts to directly detect dark matter particles on Earth are unlikely to be successful.

A team using the MPG/ESO 2.2-metre telescope at ESO’s La Silla Observatory, along with other telescopes, has mapped the motions of more than 400 stars up to 13 000 light-years from the Sun. From this new data they have calculated the mass of material in the vicinity of the Sun, in a volume four times larger than ever considered before.

“The amount of mass that we derive matches very well with what we see — stars, dust and gas — in the region around the Sun,” says team leader Christian Moni Bidin (Departamento de Astronomía, Universidad de Concepción, Chile). “But this leaves no room for the extra material — dark matter — that we were expecting. Our calculations show that it should have shown up very clearly in our measurements. But it was just not there!”

Dark matter is a mysterious substance that cannot be seen, but shows itself by its gravitational attraction for the material around it. This extra ingredient in the cosmos was originally suggested to explain why the outer parts of galaxies, including our own Milky Way, rotated so quickly, but dark matter now also forms an essential component of theories of how galaxies formed and evolved.

Today it is widely accepted that this dark component constitutes about the 80% of the mass in the Universe [1], despite the fact that it has resisted all attempts to clarify its nature, which remains obscure. All attempts so far to detect dark matter in laboratories on Earth have failed.

By very carefully measuring the motions of many stars, particularly those away from the plane of the Milky Way, the team could work backwards to deduce how much matter is present [2]. The motions are a result of the mutual gravitational attraction of all the material, whether normal matter such as stars, or dark matter.

Astronomers’ existing models of how galaxies form and rotate suggest that the Milky Way is surrounded by a halo of dark matter. They are not able to precisely predict what shape this halo takes, but they do expect to find significant amounts in the region around the Sun. But only very unlikely shapes for the dark matter halo — such as a highly elongated form — can explain the lack of dark matter uncovered in the new study [3].

The new results also mean that attempts to detect dark matter on Earth by trying to spot the rare interactions between dark matter particles and “normal” matter are unlikely to be successful.

“Despite the new results, the Milky Way certainly rotates much faster than the visible matter alone can account for. So, if dark matter is not present where we expected it, a new solution for the missing mass problem must be found. Our results contradict the currently accepted models. The mystery of dark matter has just become even more mysterious. Future surveys, such as the ESA Gaia mission, will be crucial to move beyond this point.” concludes Christian Moni Bidin.

Notes

[1] According to current theories dark matter is estimated to constitute 83% of the matter in the Universe with the remaining 17% in the form of normal matter. A much larger amount of dark energy also seems present in the Universe, but is not expected to affect the motions of the stars within the Milky Way.

[2] The observations were made using the FEROS spectrograph on the MPG/ESO 2.2-metre telescope, the Coralie instrument on the Swiss 1.2-metre Leonhard Euler Telescope, the MIKE instrument on the Magellan II Telescope and the Echelle Spectrograph on the Irene du Pont Telescope. The first two telescopes are located at ESO’s La Silla Observatory and the latter two telescopes are located at the Las Campanas Observatory, both in Chile. A total of more than 400 red giant stars at widely differing heights above the plane of the galaxy in the direction towards the south galactic pole were included in this work.

[3] Theories predict that the average amount of dark matter in the Sun’s part of the galaxy should be in the range 0.4-1.0 kilograms of dark matter in a volume the size of the Earth. The new measurements find 0.00±0.07 kilograms of dark matter in a volume the size of the Earth.

More information

This research was presented in a paper, “Kinematical and chemical vertical structure of the Galactic thick disk II. A lack of dark matter in the solar neighborhood”, by Moni-Bidin et al. to appear in The Astrophysical Journal.

The team is composed of C. Moni Bidin (Departamento de Astronomía, Universidad de Concepción, Chile), G. Carraro (European Southern Observatory, Santiago, Chile), R. A. Méndez (Departamento de Astronomía, Universidad de Chile, Santiago, Chile) and R. Smith (Departamento de Astronomía, Universidad de Concepción, Chile).

The year 2012 marks the 50th anniversary of the founding of the European Southern Observatory (ESO). ESO is the foremost intergovernmental astronomy organisation in Europe and the world’s most productive astronomical observatory. It is supported by 15 countries: Austria, Belgium, Brazil, the Czech Republic, Denmark, France, Finland, Germany, Italy, the Netherlands, Portugal, Spain, Sweden, Switzerland and the United Kingdom. ESO carries out an ambitious programme focused on the design, construction and operation of powerful ground-based observing facilities enabling astronomers to make important scientific discoveries. ESO also plays a leading role in promoting and organising cooperation in astronomical research. ESO operates three unique world-class observing sites in Chile: La Silla, Paranal and Chajnantor. At Paranal, ESO operates the Very Large Telescope, the world’s most advanced visible-light astronomical observatory and two survey telescopes. VISTA works in the infrared and is the world’s largest survey telescope and the VLT Survey Telescope is the largest telescope designed to exclusively survey the skies in visible light. ESO is the European partner of a revolutionary astronomical telescope ALMA, the largest astronomical project in existence. ESO is currently planning a 40-metre-class European Extremely Large optical/near-infrared Telescope, the E-ELT, which will become “the world’s biggest eye on the sky”.

Links
Research paper: ApJ preprint.
Photos of the MPG/ESO 2.2-metre telescope
Photos of the Swiss 1.2-metre Leonhard Euler Telescope

Contacts

Christian Moni Bidin
Universidad de Concepción
Concepción, Chile
Tel: +56 9 9210 3235
Email: cmbidin@astro-udec.cl

Giovanni Carraro
ESO
Santiago, Chile
Tel: +56 2 463 3106
Email: gcarraro@eso.org

René A. Méndez
Department of Astronomy, University of Chile
Santiago, Chile
Email: rmendez@u.uchile.cl

Rory Smith
Universidad de Concepción
Concepción, Chile
Email: rsmith@astro-udec.cl

Richard Hook
ESO, La Silla, Paranal, E-ELT and Survey Telescopes Public Information Officer
Garching bei München, Germany
Tel: +49 89 3200 6655
Cell: +49 151 1537 3591
Email: rhook@eso.org

Tuesday, April 17, 2012

Hubble's Panoramic View of a Turbulent Star-making Region

PR Image heic1206a
Hubble's Panoramic View of a Star-Forming Region

PR Image heic1206b
Close-up images of features in the Tarantula Nebula

Labelled view of the Tarantula Nebula

Video


PR Video heic1206a
Hubblecast 54: 22 years in images

Several million stars are vying for attention in this NASA/ESA Hubble Space Telescope image of a raucous stellar breeding ground in 30 Doradus, located in the heart of the Tarantula nebula.

30 Doradus is the brightest star-forming region in our galactic neighbourhood and home to the most massive stars ever seen. The nebula resides 170 000 light-years away in the Large Magellanic Cloud, a small, satellite galaxy of our Milky Way. No known star-forming region in our galaxy is as large or as prolific as 30 Doradus.

The image comprises one of the largest mosaics ever assembled from Hubble photos and consists of observations taken by Hubble’s Wide Field Camera 3 and Advanced Camera for Surveys, combined with observations from the European Southern Observatory’s MPG/ESO 2.2-metre telescope that trace the location of glowing hydrogen and oxygen.

The image is being released to celebrate Hubble’s 22nd anniversary.

The stars in this image add up to a total mass millions of times bigger than that of our Sun. The image is roughly 650 light-years across and contains some rambunctious stars, from one of the fastest rotating stars to the speediest and most massive runaway star.

The nebula is close enough to Earth that Hubble can resolve individual stars, giving astronomers important information about the stars’ birth and evolution. Many small galaxies have more spectacular starbursts, but the Large Magellanic Cloud’s 30 Doradus is one of the only star-forming regions that astronomers can study in detail. The star-birthing frenzy in 30 Doradus may be partly fueled by its close proximity to its companion galaxy, the Small Magellanic Cloud.

The image reveals the stages of star birth, from embryonic stars a few thousand years old still wrapped in dark cocoons of dust and gas to behemoths that die young in supernova explosions. 30 Doradus is a star-forming factory, churning out stars at a furious pace over millions of years. The Hubble image shows star clusters of various ages, from about 2 million to about 25 million years old.

The region’s sparkling centerpiece is a giant, young star cluster named NGC 2070, only 2 million to 3 million years old. Its stellar inhabitants number roughly 500 000. The cluster is a hotbed for young, massive stars. Its dense core, known as RMC 136, is packed with some of the heftiest stars found in the nearby Universe, weighing more than 100 times the mass of our Sun.

The massive stars are carving deep cavities in the surrounding material by unleashing a torrent of ultraviolet light, which is etching away the enveloping hydrogen gas cloud in which the stars were born. The image reveals a fantasy landscape of pillars, ridges, and valleys. Besides sculpting the gaseous terrain, the brilliant stars also may be triggering a successive generation of offspring.

When the radiation hits dense walls of gas, it creates shocks, which may be generating a new wave of star birth.

The colours come from the glowing hot gas that dominates regions of the image. Red signifies hydrogen gas and blue, oxygen.

The image was made from 30 separate fields, 15 from each camera. Hubble made the observations in October 2011. Both cameras were making observations at the same time.
Notes

The Hubble Space Telescope is a project of international cooperation between ESA and NASA.

Image credit: NASA, ESA, D. Lennon and E. Sabbi (ESA/STScI), J. Anderson, S. E. de Mink, R. van der Marel, T. Sohn, and N. Walborn (STScI), N. Bastian (Excellence Cluster, Munich), L. Bedin (INAF, Padua), E. Bressert (ESO), P. Crowther (Sheffield), A. de Koter (Amsterdam), C. Evans (UKATC/STFC, Edinburgh), A. Herrero (IAC, Tenerife), N. Langer (AifA, Bonn), I. Platais (JHU) and H. Sana (Amsterdam)

Links
Images of Hubble
NASA release

Contacts

Oli Usher
Hubble/ESA
Garching, Germany
Tel: +49-89-3200-6855
Email: ousher@eso.org

Some Stars Capture Rogue Planets

In this artist's conception, a captured world drifts at the outer edge of a distant star system, so far from its Sun-like host that the star's disk is barely resolvable at upper right. New research shows that one in 20 stars within our galaxy might have captured a free-floating planet. Credit: Christine Pulliam (CfA). High Resolution Image (jpg) -Low Resolution Image (jpg)

Cambridge, MA - New research suggests that billions of stars in our galaxy have captured rogue planets that once roamed interstellar space. The nomad worlds, which were kicked out of the star systems in which they formed, occasionally find a new home with a different sun. This finding could explain the existence of some planets that orbit surprisingly far from their stars, and even the existence of a double-planet system.

"Stars trade planets just like baseball teams trade players," said Hagai Perets of the Harvard-Smithsonian Center for Astrophysics.

The study, co-authored by Perets and Thijs Kouwenhoven of Peking University, China, will appear in the April 20th issue of The Astrophysical Journal.

To reach their conclusion, Perets and Kouwenhoven simulated young star clusters containing free-floating planets. They found that if the number of rogue planets equaled the number of stars, then 3 to 6 percent of the stars would grab a planet over time. The more massive a star, the more likely it is to snag a planet drifting by.

They studied young star clusters because capture is more likely when stars and free-floating planets are crowded together in a small space. Over time, the clusters disperse due to close interactions between their stars, so any planet-star encounters have to happen early in the cluster's history.

Rogue planets are a natural consequence of star formation. Newborn star systems often contain multiple planets. If two planets interact, one can be ejected and become an interstellar traveler. If it later encounters a different star moving in the same direction at the same speed, it can hitch a ride.

A captured planet tends to end up hundreds or thousands of times farther from its star than Earth is from the Sun. It's also likely to have a orbit that's tilted relative to any native planets, and may even revolve around its star backward.

Astronomers haven't detected any clear-cut cases of captured planets yet. Imposters can be difficult to rule out. Gravitational interactions within a planetary system can throw a planet into a wide, tilted orbit that mimics the signature of a captured world.

Finding a planet in a distant orbit around a low-mass star would be a good sign of capture, because the star's disk wouldn't have had enough material to form the planet so far out.

The best evidence to date in support of planetary capture comes from the European Southern Observatory, which announced in 2006 the discovery of two planets (weighing 14 and 7 times Jupiter) orbiting each other without a star.

"The rogue double-planet system is the closest thing we have to a 'smoking gun' right now," said Perets. "To get more proof, we'll have to build up statistics by studying a lot of planetary systems."

Could our solar system harbor an alien world far beyond Pluto? Astronomers have looked, and haven't found anything yet.

"There's no evidence that the Sun captured a planet," said Perets. "We can rule out large planets. But there's a non-zero chance that a small world might lurk on the fringes of our solar system."

Headquartered in Cambridge, Mass., the Harvard-Smithsonian Center for Astrophysics (CfA) is a joint collaboration between the Smithsonian Astrophysical Observatory and the Harvard College Observatory. CfA scientists, organized into six research divisions, study the origin, evolution and ultimate fate of the universe.

For more information, contact:

David A. Aguilar
Director of Public Affairs
Harvard-Smithsonian Center for Astrophysics
617-495-7462
daguilar@cfa.harvard.edu

Christine Pulliam
Public Affairs Specialist
Harvard-Smithsonian Center for Astrophysics
617-495-7463
cpulliam@cfa.harvard.edu

Monday, April 16, 2012

NOAO: The Lives of Stars, or Astronomers as Paparazzi

Fig. 1: The yellow and red supergiants in the Large Magellanic Cloud are marked on an images of the LMC, taken to reveal the glowing interstellar gas around very hot stars. (LMC Image available from the NOAO Image Gallery) Image Credit: C. Smith, S. Points, the MCELS Team and NOAO/AURA/NSF

Fig 2: The yellow and red supergiants in M33
Image taken as part of the NOAO Local Group Galaxies Survey (P. Massey).

Stars live for a long time, with even the most massive stars having lifetimes measured in millions of years. But, for a mere few thousand years towards the end of their lives, some massive stars go through what astronomers call the yellow supergiant phase. This is remarkably short in astronomical terms, and, as a result, stars in this phase are incredibly rare. In a recent study, astronomers from Lowell Observatory have acted as “stellar paparazzi”, managing to identify hundreds of these rare yellow supergiants, and their more long-lived descendants, the red supergiants in two neighboring galaxies. The Lowell astronomers use these newly identified populations to provide a stringent observational test for the theoretical models which describe how these stars change from blue, to yellow and then to red. These constraints are vital because the behavior of the models in this phase can influence many theoretical predictions, including something as “basic” as what types of stars explode as supernova.

Nearby red supergiant stars include such well-known stars as Betelgeuse, Antares, and Mu Cephei, and yellow supergiant stars include names like Canopus and rho Cassiopeiae, although these stars were not included in the study.

As described in two recent papers the group from Lowell Observatory, using NOAO facilities in Chile and the Multiple Mirror Telescope in Arizona, have observed a relatively complete set of the red and yellow supergiants in the nearby galaxies of the Large Magellanic Cloud (LMC) and M33. The location of the supergiants in the LMC are shown in Figure 1; those in M33 are shown in fig. 2. The astronomers compared their observations with computer models of stars derived by a group at Geneva Observatory, Switzerland, and find excellent agreement between their observed sample and theory in predicting the stellar lifetimes and general stellar properties during a critical period near the end of the stars’ lifetimes. This is in contrast to studies from three years ago by the same teams that showed large discrepancies between yellow supergiant populations and a previous version of the Geneva evolutionary models.

These two studies were led by two young researchers at Lowell Observatory, Kathryn Neugent (lead for the LMC study) and Maria Drout (lead for the M33 study), and both involve an international collaboration with Dr. Georges Meynet (Geneva Observatory), one of the world’s experts in stellar evolution theory. Both women retain the status of researcher at Lowell, while pursuing other concerns: Ms Neugent has recently joined the staff of MITRE in Colorado Springs as a cyber security analysist, and Ms Drout is completing her first year in the PhD program at Harvard. Phil Massey, a staff astronomer at Lowell Observatory, helped with both studies, and Brian Skiff, another researcher at Lowell Observatory, helped with the LMC study.

To astronomers, the HR diagram (a plot of the intrinsic luminosity versus temperature of all stars) is key to understanding the evolution, or lifetime, of stars. For most of their lives, stars, fueled by hydrogen in their cores, are constant in brightness and temperature, and this phase, termed the main sequence, is well understood. But there have been problems with understanding how the temperature and luminosity of a star rapidly changes as the core of the star is exhausted at the end of the stellar life. Understanding the late stages of stellar evolution is important for other questions, too. Yellow supergiants may be the progenitors of core-collapse supernovae, and understanding supernovae completely has important implications for cosmology.

Interpreting the HR diagram depends on mathematical models of a star’s interior, which indicate how stars of different masses change with age. These models, based on knowledge of the physics of nuclear reaction rates, predict how a star of a given mass will change in temperature and luminosity over its lifetime, but models require careful comparison with actual observations. Suppose curious aliens visited earth and, from a quick schoolyard survey, noted that human weight and height increase with age. The aliens might propose a model for human growth in which weight and height increase smoothly with age, but this model would not allow for adolescent growth spurts or middle age. If they compared their model with further measurements of fast sprouting teenagers, they would be puzzled. This is akin to the problem astronomers have faced in understanding the red and yellow supergiants. Previous evolutional models predicted far too many yellow supergiants—in other words, theoretical yellow supergiants seem to live much longer than the real stars in nature. This may resonate with those familiar with star names: it’s easy to come up with examples of red supergiants like Betelgeuse, but more difficult to think of examples of yellow supergiants whose lifetimes are measured in only a few tens of thousand years.

The Lowell group studied the supergiants in nearby galaxies, rather than our own Milky Way, to avoid the problems of identifying and characterizing stars at different distances. First, they selected stars based on their colors and angular motion across the sky. For the LMC study, they obtained spectra of almost 2,000 stars by making use of Hydra, a spectrograph on the Blanco 4-m telescope on Cerro Tololo (in northern Chile) that allows many stars to be observed at the same time. They obtained a similar number of spectra of the M33 stars using Hectospec on the 6.5-meter MMT telescope located on Mt Hopkins (in southern Arizona). The spectra provide a star’s radial velocity: motion towards or away from us. This is key to deciding which stars are actually foreground red and yellow stars in our own Milky Way galaxy, masquerading as red supergiants in these other galaxies. The work by the Lowell astronomers was supported by the National Science Foundation.

The observational data in the paper on the LMC were taken at NOAO’s Cerro Tololo Inter-American Observatory by K. Neugent, P. Massey, and B. Skiff, all from Lowell Observatory. A second paper on M33, by M. Drout and P. Massey, makes use of data collected through time granted by NOAO at the MMT Observatory. Both papers rely on mathematical models by G. Meynet, Geneva University. The published version of the LMC paper is available at http://lanl.arxiv.org/abs/1202.4225, the preprint of the M33 paper accepted for publication is available at http://lanl.arxiv.org/abs/1203.0247 .

NOAO, which manages CTIO, is operated by the Association of Universities for Research in Astronomy Inc. (AURA) under a cooperative agreement with the National Science Foundation.

***

Science Contact

Maria R. Drout
Center for Astrophysics
Harvard University
60 Garden Street, M-S 10
Cambridge, MA 02138
Email: mdrout@cfa.harvard.edu

1000 Days of Infrared Wonders

IRAC not only probes what is known - it also has uncovered some mysterious objects like this so-called "tornado" nebula. Because the camera is sensitive to light emitted from shocked molecular hydrogen (seen here in green), astronomers think that this strange beast is the result of an outflowing jet of material from a young star that has generated shock waves in surrounding gas and dust. Credit: NASA / JPL-Caltech / J. Bally (University of Colorado)

Cambridge, MA - For the last 1000 days the Infrared Array Camera (IRAC), aboard NASA's Spitzer Space Telescope, has been operating continuously to probe the universe from its most distant regions to our local solar neighborhood. The IRAC "warm" program began once Spitzer used up its liquid helium coolant, thus completing its "cold" mission. To commemorate 1000 days of infrared wonders, the program is releasing a gallery of the 10 best IRAC images.

"IRAC continues to be an amazing camera, still producing important discoveries and spectacular new images of the infrared universe," said principal investigator Giovanni Fazio of the Harvard-Smithsonian Center for Astrophysics.

The warm-mission images particularly highlight the continuing capabilities of Spitzer. Indeed, NASA's Senior Review Panel has recommended extending the Spitzer warm mission through 2015. They specifically commended the Spitzer team for telescope improvements that have made it a powerful instrument for science, especially in exoplanet studies.

IRAC is sensitive to infrared light - light beyond the red end of the visible spectrum. It can image nebulae of cold dust, peer inside obscured dust clouds where new stars are forming, and detect faint emissions from very distant galaxies.

During its 1000-day undertaking, IRAC used its two shortest-wavelength infrared sensors. However, some of the images featured today include data collected during the cold mission, when all four of its infrared sensors could function.

The top 10 IRAC images the team selected are:

Many additional images from Spitzer can be found online at http://www.spitzer.caltech.edu/.

Headquartered in Cambridge, Mass., the Harvard-Smithsonian Center for Astrophysics (CfA) is a joint collaboration between the Smithsonian Astrophysical Observatory and the Harvard College Observatory. CfA scientists, organized into six research divisions, study the origin, evolution and ultimate fate of the universe.

For more information, contact:

David A. Aguilar
Director of Public Affairs
Harvard-Smithsonian Center for Astrophysics
617-495-7462
daguilar@cfa.harvard.edu

Christine Pulliam
Public Affairs Specialist
Harvard-Smithsonian Center for Astrophysics
617-495-7463
cpulliam@cfa.harvard.edu

Hubble Peeks inside a Stellar Cloud

NGC 2040 or LH 88
Credit: ESA/Hubble, NASA and D. A Gouliermis.
Acknowledgement: Flickr user Eedresha Sturdivant

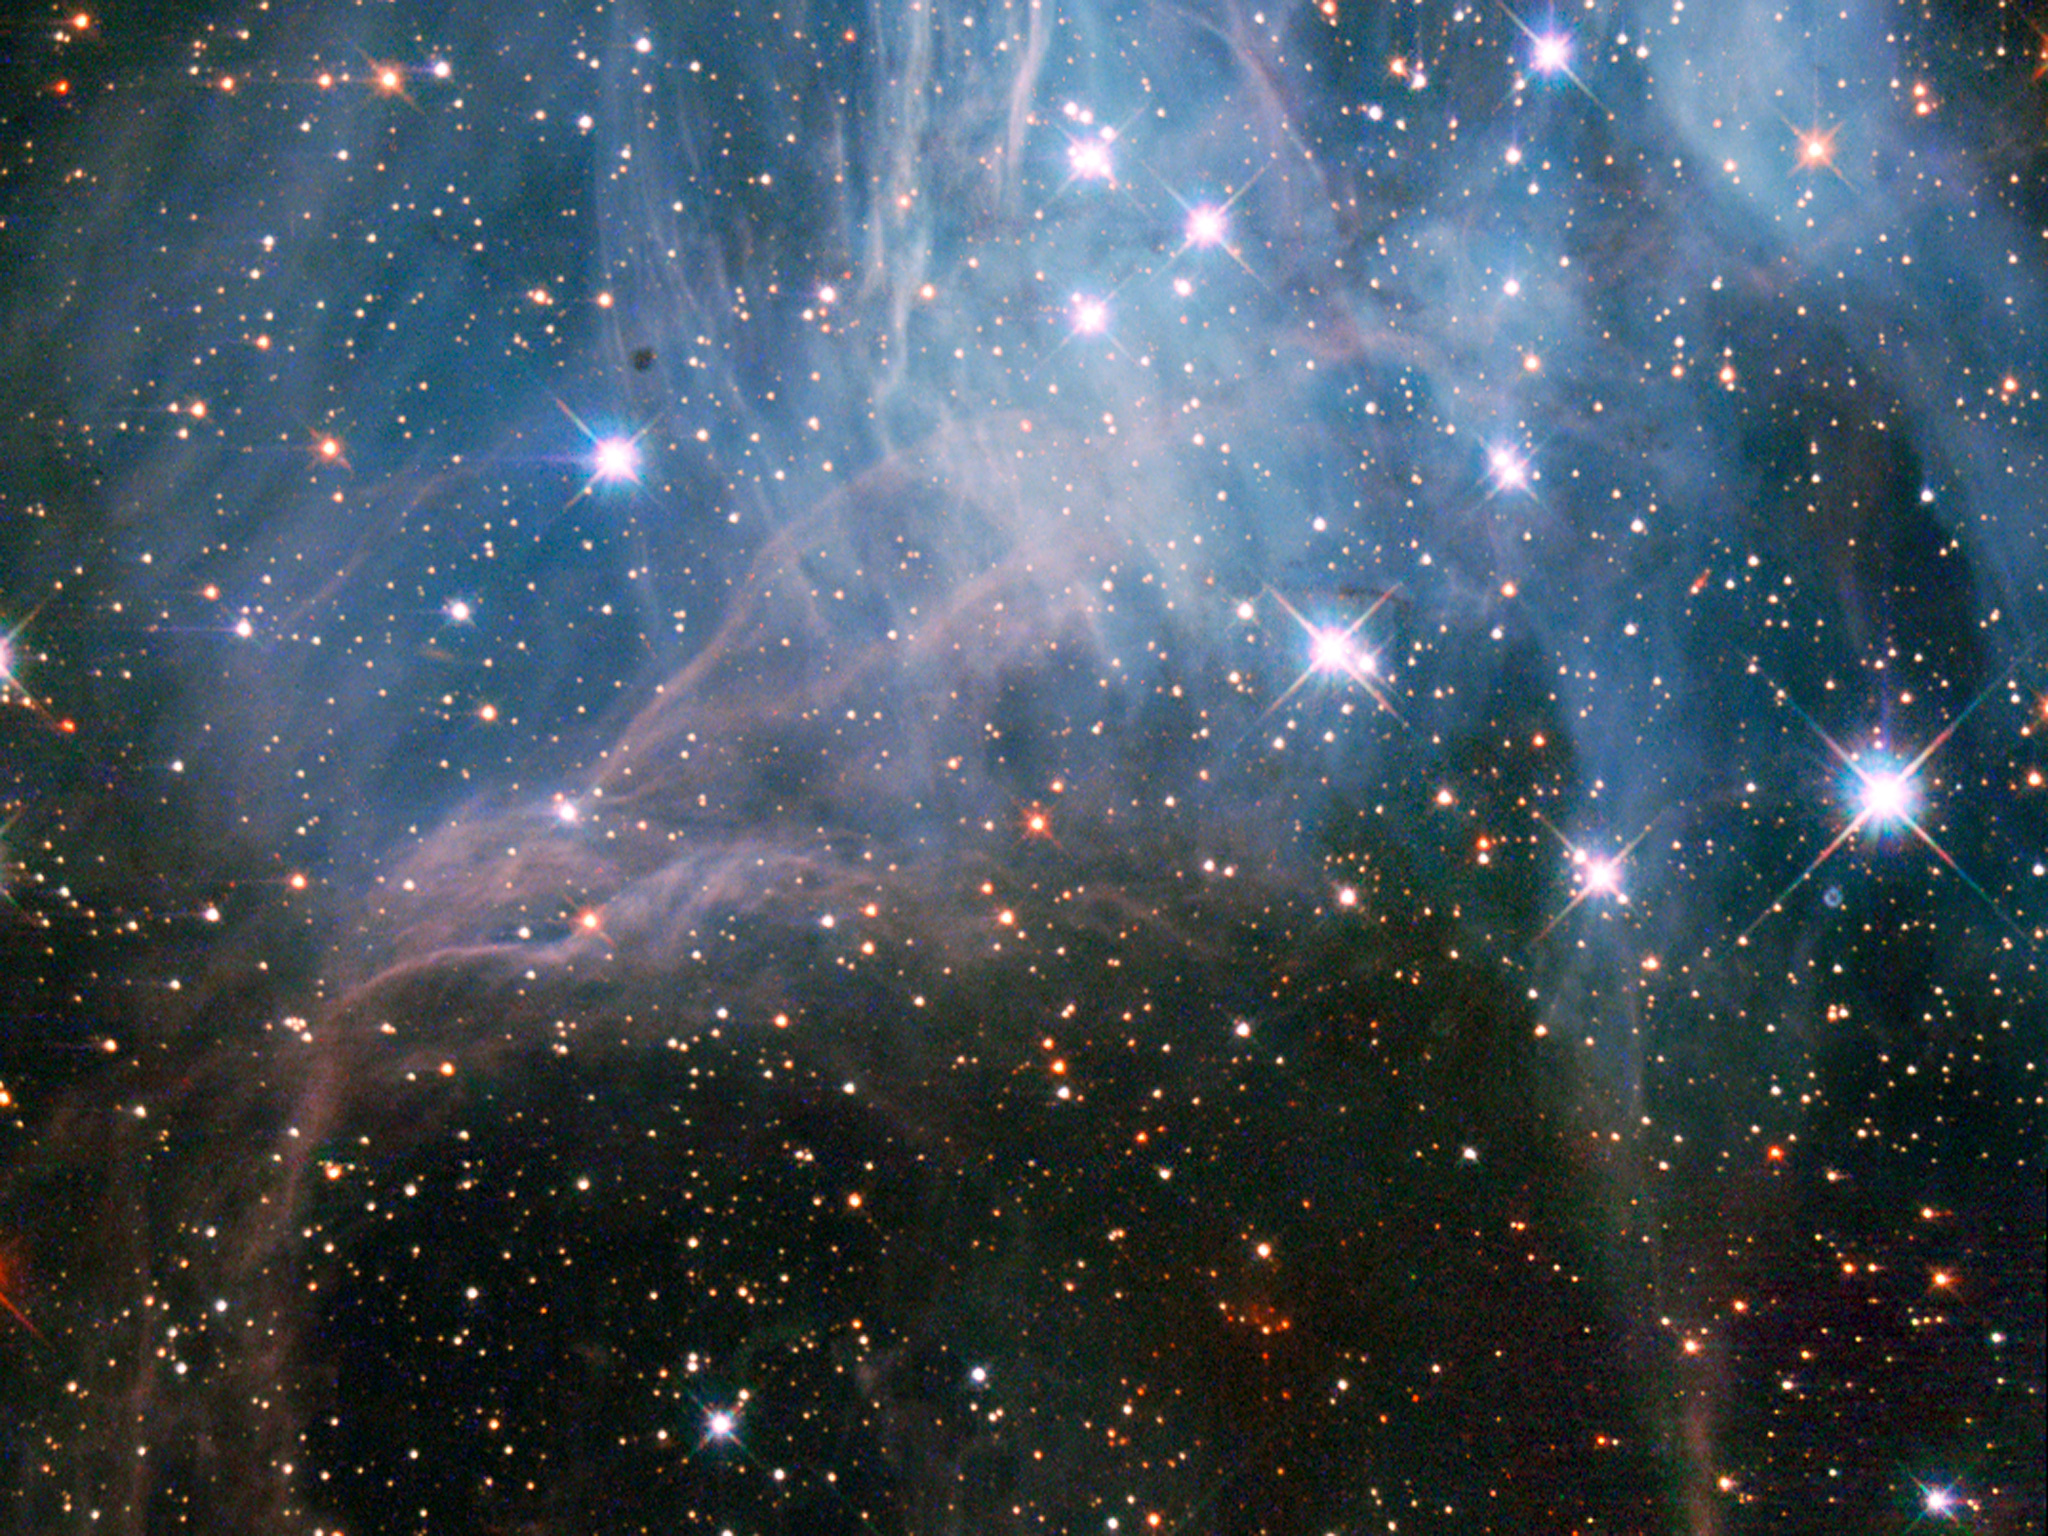
These bright stars shining through what looks like a haze in the night sky are part of a young stellar grouping in one of the largest known star formation regions of the Large Magellanic Cloud (LMC), a dwarf satellite galaxy of the Milky Way. The image was captured by the NASA/ESA Hubble Space Telescope’s Wide Field Planetary Camera 2.

The stellar grouping is known to stargazers as NGC 2040 or LH 88. It is essentially a very loose star cluster whose stars have a common origin and are drifting together through space. There are three different types of stellar associations defined by their stellar properties. NGC 2040 is an OB association, a grouping that usually contains 10–100 stars of type O and B — these are high-mass stars that have short but brilliant lives. It is thought that most of the stars in the Milky Way were born in OB associations.

There are several such groupings of stars in the LMC, including one previously featured as a Hubble Picture of the Week. Just like the others, LH 88 consists of several high-mass young stars in a large nebula of partially ionised hydrogen gas, and lies in what is known to be a supergiant shell of gas called LMC 4.

Over a period of several million years, thousands of stars may form in these supergiant shells, which are the largest interstellar structures in galaxies. The shells themselves are believed to have been created by strong stellar winds and clustered supernova explosions of massive stars that blow away surrounding dust and gas, and in turn trigger further episodes of star formation.

The LMC is the third closest galaxy to our Milky Way. It is located some 160 000 light-years away, and is about 100 times smaller than our own.

This image, which shows ultraviolet, visible and infrared light, covers a field of view of approximately 1.8 by 1.8 arcminutes.

A version of this image was entered into the Hubble’s Hidden Treasures Image Processing Competition by contestant Eedresha Sturdivant. Hidden Treasures is an initiative to invite astronomy enthusiasts to search the Hubble archive for stunning images that have never been seen by the general public.

Source: ESA/Hubble - Space Telescope


Sunday, April 15, 2012

Uranus auroras glimpsed from Earth

These composite images show Uranus auroras, which scientists caught glimpses of through the Hubble Space Telescope in 2011. CREDIT: Laurent Lamy. Hi-Res image

WASHINGTON—For the first time, scientists have captured images of auroras above the giant ice planet Uranus, finding further evidence of just how peculiar a world that distant planet is. Detected by means of carefully scheduled observations from the Hubble Space Telescope, the newly witnessed Uranian light show consisted of short-lived, faint, glowing dots – a world of difference from the colorful curtains of light that often ring Earth's poles.

In the new observations, which are the first to glimpse the Uranian aurora with an Earth-based telescope, the researchers detected the luminous spots twice on the dayside of Uranus – the side that’s visible from Hubble. Previously, the distant aurora had only been measured using instruments on a passing spacecraft. Unlike auroras on Earth, which can turn the sky greens and purples for hours, the newly detected auroras on Uranus appeared to only last a couple minutes.

In general, auroras are a feature of the magnetosphere, the area surrounding a planet that is controlled by its magnetic field and shaped by the solar wind, a steady flow of charged particles emanating from the sun. Auroras are produced in the atmosphere as charged solar wind particles accelerate in the magnetosphere and are guided by the magnetic field close to the magnetic poles – that’s why the Earthly auroras are found around high latitudes.

But contrary to the Earth – or even Jupiter and Saturn – “the magnetosphere of Uranus is very poorly known,” said Laurent Lamy, with the Observatoire de Paris in Meudon, France, who led the new research.

The results from his team, which includes researchers from France, the United Kingdom, and the United States, will be published Saturday in Geophysical Research Letters, a journal of the American Geophysical Union.

Auroras on Uranus are fainter than they are on Earth, and the planet is more than 4 billion kilometers (2.5 billion miles) away. Previous Earth-bound attempts to detect the faint auroras were inconclusive. Astronomers got their last good look at Uranian auroras 25 years ago when the Voyager 2 spacecraft whizzed past the planet and recorded spectra from of the radiant display.

“This planet was only investigated in detail once, during the Voyager flyby, dating from 1986. Since then, we’ve had no opportunities to get new observations of this very unusual magnetosphere,” Lamy noted.

Planetary scientists know that Uranus is an oddball among the solar system’s planets when it comes to the orientation of its rotation axis. Whereas the other planets resemble spinning tops, circulating around the Sun, Uranus is like a top that was knocked on its side – but still keeps spinning.

The researchers suspect that the unfamiliar appearance of the newly observed auroras is due to Uranus’ rotational weirdness and peculiar traits of its magnetic axis. The magnetic axis is both offset from the center of the planet and lists at an angle of 60 degrees from the rotational axis – an extreme tilt compared to the 11 degree difference on Earth. Scientists theorize that Uranus’s magnetic field is generated by a salty ocean within the planet, resulting in the off-center magnetic axis.

The 2011 auroras differ not only from Earth’s auroras but also from the Uranian ones previously detected by Voyager 2. When that spacecraft made its flyby decades ago, Uranus was near its solstice – its rotational axis was pointed toward the Sun. In that configuration, the magnetic axis stayed at a large angle from the solar wind flow, producing a magnetosphere similar to the Earth’s magnetosphere, although more dynamic. Under those 1986 solstice conditions, the auroras lasted longer than the recently witnessed ones and were mainly seen on the nightside of the planet, similar to what’s observed on Earth, Lamy said. Hubble can’t see the far side of the planet, however, so researchers don’t know what types of auroras, if any, were generated there.

The new set of observations, however, is from when the planet was near equinox, when neither end of the Uranian rotational axis aims at the Sun, and the axis aligns almost perpendicular to the solar wind flow. Because the planet’s magnetic axis is tilted, the daily rotation of Uranus during the period around the equinox causes each of its magnetic poles to point once a day toward the Sun, likely responsible for a very different type of aurora than the one that was seen at solstice, Lamy explained.

“This configuration is unique in the solar system,” added Lamy, who noted that the two transient, illuminated spots observed in 2011 were close to the latitude of Uranus’s northern magnetic pole.

Capturing the images of Uranus’s auroras resulted from a combination of good luck and careful planning. In 2011, Earth, Jupiter and Uranus were lined up so that the solar wind could flow from the Sun, past Earth and Jupiter, and then toward Uranus. When the Sun produced several large bursts of charged particles in mid-September 2011, the researchers used Earth-orbiting satellites to monitor the solar wind’s local arrival two to three days later. Two weeks after that, the solar wind sped past Jupiter at 500 kilometers per second (310 miles per second). Calculating that the charged particles would reach Uranus in mid-November, the team scrambled to scheduled time on the Hubble Space Telescope.

Ever since the Voyager 2 flyby demonstrated that Uranus was a “strange beast,” said Fran Bagenal, a planetary scientist with the University of Colorado in Boulder, “we’ve been really keen to get a better view. This was a very clever way of looking at that.”

A better understanding of Uranus’ magnetosphere could help scientists test their theories of how Earth’s magnetosphere functions, she added. “We have ideas of how things work on Earth and places like Jupiter and Saturn, but I don’t believe you really know how things work until you test them on a very different system.”


Notes for Journalists

Journalists and public information officers (PIOs) of educational and scientific institutions who have registered with AGU can download a PDF copy of this paper in press.

Or, you may order a copy of the final paper by emailing your request to Kate Ramsayer at kramsayer@agu.org. Please provide your name, the name of your publication, and your phone number.

Neither the paper nor this press release are under embargo.

Title

“Earth-based detection of Uranus' aurorae”


Authors

L. Lamy and R. Prange: LESIA, Obs. de Paris, CNRS, UPMC, Univ. Paris Diderot, Meudon, France;

K. C. Hansen: Department of Atmospheric, Oceanic and Space Sciences, University of Michigan, Ann Arbor, Michigan, USA;

J. T. Clarke: Center for Space Physics, Boston University, Boston, Massachusetts, USA;
P. Zarka, B. Cecconi, and J. Aboudarham: LESIA, Obs. de Paris, CNRS, UPMC, Univ. Paris Diderot, Meudon, France;

N. Andre: Institut de Recherche en Astrophysique, Toulouse, France;

G. Branduardi-Raymont: University College London, Mullard Space Science Laboratory, Dorking, UK;

R. Gladstone: Southwest Research Institute, San Antonio, USA;

M. Barthelemy: Institut de Planetologie et d’Astrophysique de Grenoble, Grenoble, France;

N. Achilleos and P. Guio: University College London, London, UK;

M. K. Dougherty: Blackett Laboratory, Imperial College London, London, UK;

H. Melin, S.W.H. Cowley, T.S. Stallard and J. D. Nichols: Department of Physics and Astronomy, University of Leicester, Leicester, UK;

G. Ballester: Lunar and Planetary Laboratory, University of Arizona, USA


Contact information for the author

Laurent Lamy
Telephone: +33 1-45-07-76-61
Email: laurent.lamy@obspm.fr


AGU Media Contacts

Peter Weiss
Public Information Manager
Phone: +1 202 777 7507
E-mail: Pweiss@agu.org

Mary Catherine Adams
Public Information Specialist
Phone: +1 202 777 7530
E-mail: MCAdams@agu.org

Kate Ramsayer
Public Information Specialist
Phone: +1 202 777 7524
E-mail: KRamsayer@agu.org

Phone (toll free in North America): +1 (800) 966 2481
Fax: +1 202 328 0566

Saturday, April 14, 2012

NASA's Swift Monitors Departing Comet Garradd

Swift's UVOT acquired this image of Comet Garradd (C/2009 P1) on April 1, 2012, when the comet was 142 million miles away, or 636 times farther than the moon. Red shows sunlight reflected from the comet's dust; violet shows ultraviolet light produced by hydroxyl (OH), a fragment of water. NGC 2895 is a barred spiral galaxy located 400 million miles away in the constellation Ursa Major. The UVOT image (outlined) is placed within a wider visible image of the region from the Digital Sky Survey. Credit: NASA/Swift/D. Bodewits (UMD) and S. Immler (GSFC) and DSS/STScI/AURA. View larger-View unlabeled version

An outbound comet that provided a nice show for skywatchers late last year is the target of an ongoing investigation by NASA's Swift satellite. Formally designated C/2009 P1 (Garradd), the unusually dust-rich comet provides a novel opportunity to characterize how cometary activity changes at ever greater distance from the sun.

A comet is a clump of frozen gases mixed with dust. These "dirty snowballs" cast off gas and dust whenever they venture near the sun. What powers this activity is frozen water transforming from solid ice to gas, a process called sublimation. Jets powered by ice sublimation release dust, which reflects sunlight and brightens the comet. Typically, a comet's water content remains frozen until it comes within about three times Earth's distance to the sun, or 3 astronomical units (AU), so astronomers regard this as the solar system's "snow line."

"Comet Garradd was producing lots of dust and gas well before it reached the snow line, which tells us that the activity was powered by something other than water ice," said Dennis Bodewits, an assistant research scientist at the University of Maryland, College Park, and the study's lead investigator. "We plan to use Swift's unique capabilities to monitor Garradd as it moves beyond the snow line, where few comets are studied."

Comets are known to contain other frozen gases, such as carbon monoxide and dioxide (CO and CO2), which sublimate at colder temperatures and much farther from the sun. These are two of the leading candidates for driving cometary activity beyond the snow line, but phase transitions between different forms of water ice also may come into play.

C/2009 P1 was discovered by Gordon J. Garradd at Siding Spring Observatory, Australia, in August 2009. Astronomers say that the comet is "dynamically new," meaning that this is likely its first trip through the inner solar system since it arrived in the Oort cloud, the cometary cold-storage zone located thousands of AU beyond the sun.

Comet Garradd was closest to the sun on Dec. 23, 2011, and passed within 118 million miles (1.27 AU) of Earth on March 5, 2012. The comet remains observable in small telescopes this month as it moves south though the constellations Ursa Major and Lynx.

Although Swift's prime task is to detect and rapidly locate gamma-ray bursts in the distant universe, novel targets of opportunity allow the mission to show off its versatility. One of Swift's instruments, the Ultraviolet/Optical Telescope (UVOT) is ideally suited for studying comets.

The UVOT grism produces images that separate incoming light from ultraviolet and visible sources by wavelength. Molecules produce separate images at discrete wavelengths: hydroxyl (OH) at 308 nm, just beyond the visual range; CN and C3 produce purple light at 387 and 406 nm, respectively. C2 emission at 500 nm is responsible for the dominant green color that characterizes many comets. Comet dust, which reflects sunlight, instead produces a broad, continuous swath. Credit: NASA/Swift/D. Bodewits (UMD) and S. Immler (GSFC). View larger - View unlabeled version

The instrument includes a prism-like device called a grism, which separates incoming light by its wavelength. While Swift's UVOT cannot detect water directly, the molecule quickly breaks up into hydrogen atoms and hydroxyl (OH) molecules when exposed to ultraviolet sunlight. The UVOT detects light emitted by hydroxyl and other important molecular fragments — such as cyanide (CN), carbon monosulfide (CS) and diatomic and triatomic carbon (C2 and C3, respectively) — as well as the sunlight reflected off of cometary dust.

"Tracking the comet's water and dust production and watching its chemistry change as it moves deeper into the solar system will help us better understand how comets work and where they formed," said Stefan Immler, a researcher and Swift team member at NASA's Goddard Space Flight Center in Greenbelt, Md.

Swift last observed the comet on April 1, when it was 1.53 AU away and just past the orbit of Mars. Although detailed results are not yet available, Bodewits estimates that Comet Garradd was shedding about 400 gallons of water each second -- enough to fill an Olympic-size swimming pool in under 30 minutes.

But the water given off by the comet was only about half of the dust mass it produced. Bodewits estimates that each second, Garradd was losing about 7,500 pounds (3.5 metric tons, or about twice the typical mass of a small car) in the form of dust and icy grains.

Thanks to Garradd's brightness and the UVOT's sensitivity and resolution, researchers can monitor the comet when it is beyond the grasp of most ground-based observatories. Plans call for observations at eight different distances from the sun out to about 5.5 AU, which the comet will reach in April 2013.

Related links:

Francis Reddy
NASA's Goddard Space Flight Center, Greenbelt, Md.

Friday, April 13, 2012

Hubble Sees Messier 70: Tight and Bright

Messier 70
Credit: ESA/Hubble & NASA

In this image, the NASA/ESA Hubble Space Telescope has captured the brilliance of the compact center of Messier 70, a globular cluster. Quarters are always tight in globular clusters, where the mutual hold of gravity binds together hundreds of thousands of stars in a small region of space. Having this many shining stars piled on top of one another from our perspective makes globular clusters a popular target for amateur skywatchers and scientists alike.

Messier 70 offers a special case because it has undergone what is known as a core collapse. In these clusters, even more stars squeeze into the object's core than on average, such that the brightness of the cluster increases steadily towards its center.

The legions of stars in a globular cluster orbit about a shared center of gravity. Some stars maintain relatively circular orbits, while others loop out into the cluster's fringes. As the stars interact with each other over time, lighter stars tend to pick up speed and migrate out toward the cluster's edges, while the heavier stars slow and congregate in orbits toward the center. This huddling effect produces the denser, brighter centers characteristic of core-collapsed clusters. About a fifth of the more than 150 globular clusters in the Milky Way have undergone a core collapse.

Although many globular clusters call the galaxy's edges home, Messier 70 orbits close to the Milky Way's center, around 30 000 light-years away from the Solar System. It is remarkable that Messier 70 has held together so well, given the strong gravitational pull of the Milky Way's hub.

Messier 70 is only about 68 light-years in diameter and can be seen, albeit very faintly, with binoculars in dark skies in the constellation of Sagittarius (The Archer). French astronomer Charles Messier documented the object in 1780 as the seventieth entry in his famous astronomical catalogue.

This picture was obtained with the Wide Field Camera of Hubble’s Advanced Camera for Surveys. The field of view is around 3.3 by 3.3 arcminutes.