Showing posts with label solar wind. Show all posts

Sunday, January 18, 2026

When Winds Collide: Predicting the Effects of Stream Interaction Regions

Illustration of the solar wind interacting with Earth's magnetic field.
Credit:
NASA's Goddard Space Flight Center

The Solar Heliospheric Observatory (SOHO) took this coronagraphic image of a coronal mass ejection on 20 April 1998.
Credit:
SOHO (ESA & NASA)

What happens when pileups of solar wind plasma collide with Earth’s protective magnetosphere? New work uses machine learning to examine how strongly these events affect our planet’s magnetic field.

Plasma Pileups

Geomagnetic storms driven by solar activity paint night skies with glowing aurorae, but they also threaten spacecraft electronics with showers of high-energy particles. While immense eruptions of solar plasma and magnetic fields called coronal mass ejections are the most infamous example of solar activity, a team led by Yudong Ye (Sun Yat-Sen University) recently focused on another, less destructive form of activity: stream interaction regions.

Stream interaction regions arise when slow-moving solar wind is struck from behind by faster-moving solar wind emitted later. The collision of the two solar wind streams creates a tangle of compressed plasma and strong magnetic fields capable of peeling back Earth’s protective magnetosphere and dumping in high-energy charged particles, with beautiful yet harmful results.

Illustration of the authors’ support vector machine framework. The optimal hyperplane is the boundary that best divides the data by maximizing the distance between the boundary and the data points nearest to it; these points are called support vectors. Square and triangle symbols represent two classes of data. Click to enlarge. Credit: Ye et al. 2025

Machine Learning Method

Though stream interaction regions are less disruptive than coronal mass ejections, they’re far more common; they frequently needle Earth’s magnetosphere, especially during the calmer years of the Sun’s activity cycle. Predicting how strongly a stream interaction region will influence Earth’s magnetosphere — in other words, how geoeffective it is — is challenging, however. When two streams of solar wind collide, their properties combine in complex and nonlinear ways that traditional statistical investigations have struggled to pin down.

Now, Ye and collaborators have used machine learning to study the properties and impact of stream interaction regions in a physically meaningful way. They performed their study on a sample of 879 stream interaction events for which there is abundant information, such as temperature, magnetic field strength and direction, and solar wind conditions before and after the event.

Ye’s team based their framework on a support vector machine classifier: a classical machine learning algorithm that draws a mathematical boundary between groups of data while maximizing the distance between the boundary and the data points nearest to the dividing line. The support vector machine algorithm is well-suited to the task of modeling the geoeffectiveness of stream interaction regions because it doesn’t require a particularly vast dataset, can tolerate misclassified events, and allows for a physical interpretation of the results.


Illustration of how the interplanetary magnetic field (IMF) interacts with Earth’s magnetosphere. When the IMF points southward, as it does in this diagram, the impact on Earth’s magnetosphere is increased, with magnetic reconnection occurring in the red areas. Credit: NASA

A Physical Interpretation

The team first reined in the model’s complexity by identifying the most important features in the dataset. They then determined which features or combination of features had the largest contribution to the output — in other words, which physical parameters most strongly determined the geoeffectiveness of the event.

Ye and collaborators found that the strongest determinants of an event’s geoeffectiveness were how long the solar wind was directed southward, the strength of the solar wind electric field, and the average and minimum strengths of the southward-pointing solar wind magnetic field. These results align with the current understanding of how energy is transferred from the solar wind to Earth’s magnetosphere through magnetic reconnection, a release of magnetic energy driven by rearrangement of magnetic fields. This shows how classical machine learning methods can enhance our ability to predict the outcome of oncoming space weather while simultaneously examining the physical drivers of the event.

Citation

“Assessing the Geoeffectiveness of Stream Interaction Regions Through Physically Interpretable Machine Learning,” Yudong Ye et al 2025 ApJ 993 10. doi:10.3847/1538-4357/ae0454


Wednesday, December 17, 2025

Astronomers Create First Map of the Sun's Outer Boundary

This artist's conception shows the boundary in the Sun's atmosphere where the speed of the outward solar wind becomes faster than the speed of magnetic waves. The area appears to shift between spiky and frothy, and is the point of no return for material that escapes the Sun's magnetic grasp. Deep dives into the Alfvén surface using NASA's Parker Solar Probe combined with far-away measurements, have allowed scientists to track the evolution of this structure throughout the solar cycle and produce a map of this previously uncharted territory. Credit: CfA/ Melissa Weiss.
Low Resolution Image


Using NASA’s Parker Solar Probe and other near-Earth spacecraft, scientists from the Center for Astrophysics | Harvard & Smithsonian have made and validated the first 2D maps of the Sun’s outer surface, leading to unprecedented insight into how and where the Sun “loses its grip” on its outer atmosphere.

Cambridge, MA (December 11, 2025)— Astronomers have produced the first continuous, two-dimensional maps of the outer edge of the Sun’s atmosphere, a shifting, frothy boundary that marks where solar winds escape the Sun’s magnetic grasp. By combining the maps and close-up measurements, scientists from the Center for Astrophysics | Harvard & Smithsonian (CfA) showed that the boundary grows larger, rougher and spikier as the Sun becomes more active. The findings could help scientists improve models showing how the Sun affects Earth, and better predict atmospheric complexity for other stars.

“Parker Solar Probe data from deep below the Alfvén surface could help answer big questions about the Sun’s corona, like why it’s so hot. But to answer those questions, we first need to know exactly where the boundary is,” said Sam Badman, an astrophysicist at the CfA, and the lead author of the paper.

The scientists have directly validated these maps using deep dives into the Sun’s atmosphere made by NASA’s Parker Solar Probe. The findings are published today in the Astrophysical Journal Letters (ApJL).

The boundary in the Sun’s atmosphere where the solar wind’s outward speed becomes faster than the speed of magnetic waves, known as the Alfvén surface, is the “point of no return” for material that escapes the Sun and enters interplanetary space; once material travels beyond this point, it cannot travel back to the Sun. This surface is the effective “edge” of the Sun’s atmosphere, and provides scientists with an active laboratory for studying and understanding how solar activity impacts the rest of the solar system, including life and technology on and around Earth.

Using Parker’s Solar Wind Electrons Alphas and Protons (SWEAP) instrument, developed by the CfA in conjunction with the University of California, Berkeley, the scientists collected data from deep into the Sun’s sub-Alfvénic surface.

“There are still a number of fascinating physics questions about the Sun’s corona that we don’t fully understand,” said Michael Stevens, an astronomer at the CfA and the principal investigator of Parker’s SWEAP instrument. “This work shows without a doubt that Parker Solar Probe is diving deep with every orbit into the region where the solar wind is born. We are now headed for an exciting period where it will witness firsthand how those processes change as the Sun goes into the next phase of its activity cycle.”

“Before, we could only estimate the Sun’s boundary from far away without a way to test if we got the right answer, but now we have an accurate map that we can use to navigate it as we study it,” added Badman “And, importantly, we also are able to watch it as it changes and match those changes with close-up data. That gives us a much clearer idea of what’s really happening around the Sun.”

Scientists previously knew this boundary changes dynamically with solar cycles, moving away from the Sun and becoming larger, more structured, and more complex during solar maximum, and the opposite during solar minimum, but until now didn’t have confirmation of what exactly those changes looked like.

Badman added, “As the Sun goes through activity cycles, what we’re seeing is that the shape and height of the Alfvén surface around the Sun is getting larger and also spikier. That’s actually what we predicted in the past, but now we can confirm it directly.”

The new maps and corresponding data can help scientists answer important questions about the physics happening deep in the Sun’s atmosphere; that knowledge can in turn be used to develop better solar wind and space-weather models, sharpening forecasts of how solar activity moves through and shapes the environment around Earth and other planets in the solar system.

It can also help them to answer longheld questions about the lives of stars elsewhere in the galaxy and the universe, from how they’re born to how they behave throughout their lives, including how that behavior influences the habitability of their orbiting planets.

The team’s findings offer a new window into the workings of our closest star and lay the foundation for ever deeper discoveries. According to Badman, the coordinated multi-spacecraft approach, which combined the observational powers of close-up probes and distant observing stations including the Solar Orbiter, a project of NASA and the European Space Agency (ESA), and NASA’s Wind spacecraft, will continue to serve as a model for future breakthrough studies in heliophysics. During the next solar minimum, the team will again dive into the Sun’s corona, with an aim to study how it evolves over a complete solar cycle.


Resource

Badman, S. T. et al, “Multi-spacecraft measurements of the evolving geometry of the Solar Alfvén surface over half a solar cycle,” Astrophysical Journal Letters, 2025 Dec 11, doi: 10.3847/2041-8213/ae0e5c


About the Center for Astrophysics | Harvard & Smithsonian

The Center for Astrophysics | Harvard & Smithsonian is a collaboration between Harvard and the Smithsonian designed to ask—and ultimately answer—humanity's greatest unresolved questions about the nature of the universe. The Center for Astrophysics is headquartered in Cambridge, MA, with research facilities across the U.S. and around the world.


Media Contacts:

Amy C. Oliver, FRAS
Public Affairs Officer
Center for Astrophysics | Harvard & Smithsonian
+1 520 879 4406

amy.oliver@cfa.harvard.edu


Saturday, June 11, 2022

Taking the Temperature of the Solar Wind with Simulations


The sparse plasma of the solar wind fills the solar system, constantly buffets the planets, and provides the particles that generate auroras on Earth and other planets. Credit:
NASA

Researchers have applied a powerful simulation tool to a fundamental question about the solar wind: how do sparse plasmas exchange energy?


This artist’s impression of the solar wind shows a constant torrent of particles filling the heliosphere and streaming past Earth.  Credit: NASA Goddard’s Conceptual Image Lab/Greg Shirah


A Tenuous Topic

Particles bounce around equally in all directions in a substance in thermal equilibrium, but in a tenuous, magnetized plasma like the solar wind, the particles can move at very different speeds parallel and perpendicular to the magnetic field. Since temperature is a measure of the average kinetic energy of a collection of particles, this means the temperature of a plasma can be different in the direction parallel to the magnetic field lines than it is perpendicular to them!

Early plasma theory predicted that the solar wind plasma would be tens of times hotter parallel to the magnetic field than perpendicular to it. In reality, at Earth’s location, the temperature parallel to the magnetic field is, on average, just 20% hotter than the temperature perpendicular to the field lines. With few to no collisions to help the plasma come to thermal equilibrium, how is this possible?


The Kelvin–Helmholtz instability, which plays an important role in the atmospheres of stars and planets alike, is revealed by rare, wave-like patterns in clouds. Credit:
UCAR

An Unstable Solution

In a new publication, a team led by Rodrigo López (University of Santiago, Chile) used simulations to explore the impact of a plasma instability on the temperature of solar wind plasma. Plasma instabilities kick in when certain physical conditions are present, and they can have a big impact on a plasma’s large-scale characteristics, like temperature and density. While instabilities might seem abstract, they actually play a role in many common situations; weather systems, volcanic clouds, and lava lamps are all examples of instabilities at work. In each of these cases, what we observe is the result of the system spiraling away from equilibrium when it is disturbed.

Similar to these examples, instabilities can arise in a plasma in which the temperature parallel to the magnetic field is much higher than the temperature perpendicular to the magnetic field. In today’s article, López and collaborators investigated what happens to this setup when the fire hose instability comes into play. Previous work has explored the impact of the fire hose instability in plasmas where the electrons or the protons have a much higher temperature parallel than perpendicular, but relatively little work has explored what happens when both types of particles have this feature.


The change in the perpendicular to parallel temperature ratio over time for the simulated electrons (top) and protons (bottom). In Case 1, the electrons start out with a temperature ratio of 1. In Cases 2 and 3, the electron temperature ratios are 0.4 and 0.3, respectively. Credit: Adapted from López et al. 2022

Approaching Equilibrium

Using plasma physics equations and two-dimensional particle-in-cell simulations, López and coauthors found that when solar wind protons and electrons have much higher temperatures in the parallel direction, the fire hose instability takes hold of the protons much faster than it would if only the protons had this feature, while the electrons behave similarly regardless of what the protons are up to. In addition, the protons’ parallel and perpendicular temperatures draw closer when the electrons undergo the fire hose instability as well, suggesting that the electrons’ behavior is an important factor in explaining the observed temperatures in the solar wind.

Overall, the authors’ findings confirm that the fire hose instability plays an important role in moderating the temperature of the solar wind plasma, and future work should consider the influence that electrons have on the behavior of protons in the solar wind and other sparse plasmas.

Citation

“Mixing the Solar Wind Proton and Electron Scales. Theory and 2D-PIC Simulations of Firehose Instability,” R. A. López et al 2022 ApJ 930 158. doi:10.3847/1538-4357/ac66e4


Friday, July 01, 2016

Hubble captures vivid auroras in Jupiter’s atmosphere

Auroras on Jupiter


Videos
 
Timelapse of Jupiter’s auroras

Timelapse of Jupiter’s auroras (2)


Astronomers are using the NASA/ESA Hubble Space Telescope to study auroras — stunning light shows in a planet’s atmosphere — on the poles of the largest planet in the Solar System, Jupiter. This observation programme is supported by measurements made by NASA’s Juno spacecraft, currently on its way to Jupiter.

Jupiter, the largest planet in the Solar System, is best known for its colourful storms, the most famous being the Great Red Spot. Now astronomers have focused on another beautiful feature of the planet, using the ultraviolet capabilities of the NASA/ESA Hubble Space Telescope.

The extraordinary vivid glows shown in the new observations are known as auroras [1]. They are created when high energy particles enter a planet’s atmosphere near its magnetic poles and collide with atoms of gas. As well as producing beautiful images, this programme aims to determine how various components of Jupiter’s auroras respond to different conditions in the solar wind, a stream of charged particles ejected from the Sun.

This observation programme is perfectly timed as NASA’s Juno spacecraft is currently in the solar wind near Jupiter and will enter the orbit of the planet in early July 2016. While Hubble is observing and measuring the auroras on Jupiter, Juno is measuring the properties of the solar wind itself; a perfect collaboration between a telescope and a space probe [2].

“These auroras are very dramatic and among the most active I have ever seen”, says Jonathan Nichols from the University of Leicester, UK, and principal investigator of the study. “It almost seems as if Jupiter is throwing a firework party for the imminent arrival of Juno.”

To highlight changes in the auroras Hubble is observing Jupiter daily for around one month. Using this series of images it is possible for scientists to create videos that demonstrate the movement of the vivid auroras, which cover areas bigger than the Earth.

Not only are the auroras huge, they are also hundreds of times more energetic than auroras on Earth. And, unlike those on Earth, they never cease. Whilst on Earth the most intense auroras are caused by solar storms — when charged particles rain down on the upper atmosphere, excite gases, and cause them to glow red, green and purple — Jupiter has an additional source for its auroras.

The strong magnetic field of the gas giant grabs charged particles from its surroundings. This includes not only the charged particles within the solar wind but also the particles thrown into space by its orbiting moon Io, known for its numerous and large volcanos.

The new observations and measurements made with Hubble and Juno will help to better understand how the Sun and other sources influence auroras. While the observations with Hubble are still ongoing and the analysis of the data will take several more months, the first images and videos are already available and show the auroras on Jupiter’s north pole in their full beauty.


Notes

[1] Jupiter’s auroras were first discovered by the Voyager 1 spacecraft in 1979. A thin ring of light on Jupiter's nightside looked like a stretched-out version of our own auroras on Earth. Only later on was it discovered that the auroras were best visible in the ultraviolet.

[2] This is not the first time astronomers have used Hubble to observe the auroras on Jupiter, nor is it the first time that Hubble has cooperated with space probes to do so. In 2000 the NASA/ESA/ASI Cassini spacecraft made its closest approach to Jupiter and scientists used this opportunity to gather data and images about the auroras simultaneously from Cassini and Hubble (heic0009). In 2007 Hubble obtained images in support of its sister NASA Mission New Horizons which used Jupiter's gravity for a manoeuvre on its way to Pluto (opo0714a).


More Information 

The Hubble Space Telescope is a project of international cooperation between ESA and NASA.

Image credit: NASA, ESA


Links


Contacts

Jonathan Nichols
University of Leicester
United Kingdom
Tel: +44 116 252 5049
Email: jdn4@leicester.ac.uk

Mathias Jäger
ESA/Hubble, Public Information Officer
Garching bei München, Germany
Cell: +49 176 62397500
Email: mjaeger@partner.eso.org


Wednesday, March 23, 2016

Jupiter: Solar Storms Ignite 'Northern Lights' on Jupiter

 Jupiter
Credit: X-ray: NASA/CXC/UCL/W.Dunn et al, Optical: NASA/STScI


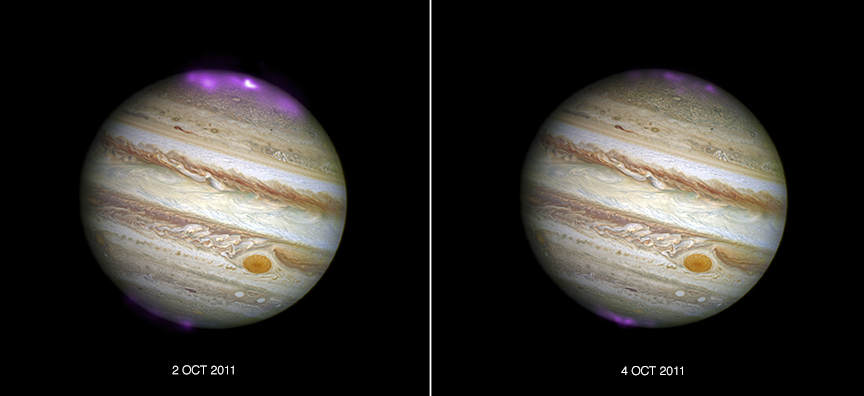
Solar storms are triggering X-ray auroras on Jupiter that are about eight times brighter than normal over a large area of the planet and hundreds of times more energetic than Earth's 'northern lights,' according to a new study using data from NASA's Chandra X-ray Observatory. This result is the first time that Jupiter's auroras have been studied in X-ray light when a giant solar storm arrived at the planet.

The Sun constantly ejects streams of particles into space in the solar wind. Sometimes, giant storms, known as coronal mass ejections (CMEs), erupt and the winds become much stronger. These events compress Jupiter's magnetosphere, the region of space controlled by Jupiter's magnetic field, shifting its boundary with the solar wind inward by more than a million miles. This new study found that the interaction at the boundary triggers the X-rays in Jupiter's auroras, which cover an area bigger than the surface of the Earth.

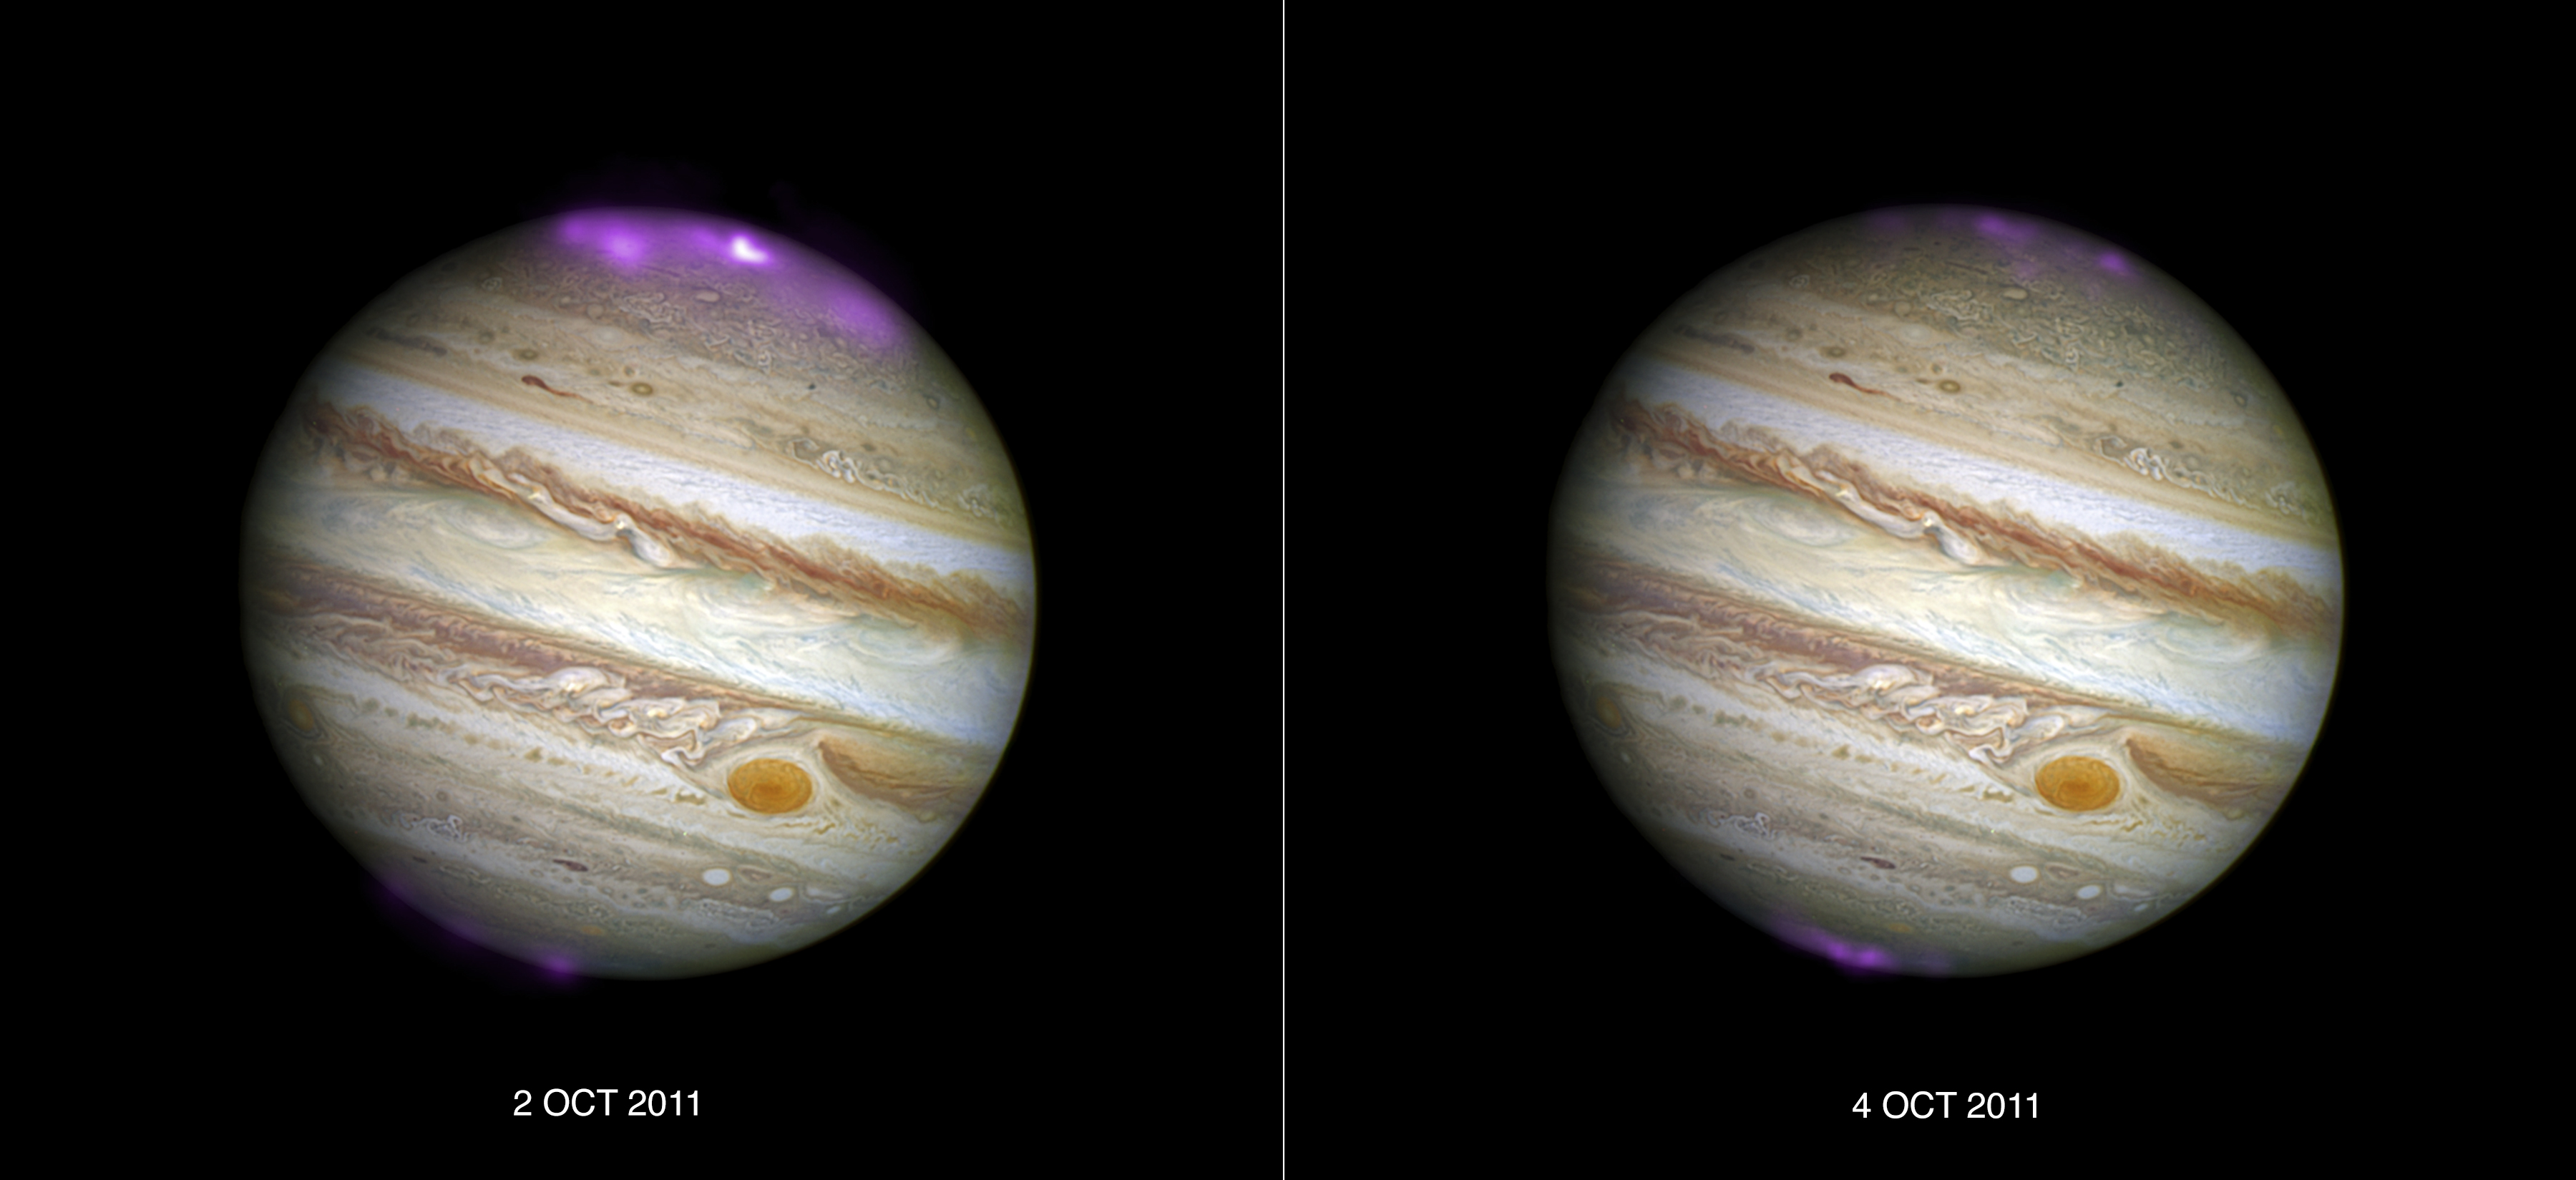
These composite images show Jupiter and its aurora during and after a CME's arrival at Jupiter in October 2011. In these images, X-ray data from Chandra (purple) have been overlaid on an optical image from the Hubble Space Telescope. The left-hand panel reveals the X-ray activity when the CME reached Jupiter, and the right-hand side is the view two days later after the CME subsided. The impact of the CME on Jupiter's aurora was tracked by monitoring the X-rays emitted during two 11-hour observations. The scientists used that data to pinpoint the source of the X-ray activity and identify areas to investigate further at different time points. They plan to find out how the X-rays form by collecting data on Jupiter's magnetic field, magnetosphere and aurora using Chandra and ESA's XMM-Newton.

A paper describing these results appeared in the March 22, 2016 issue of the Journal of Geophysical Research. The authors on the paper are William Dunn (UCL), Graziella Branduardi-Raymont (UCL), Ronald Elsner (NASA's Marshall Space Flight Center), Marissa Vogt (Boston University), Laurent Lamy (University of Paris Diderot), Peter Ford (Massachusetts Institute of Technology), Andrew Coates (UCL), Randall Gladstone (Southwest Research Institute), Caitriona Jackman (University of Southampton), Jonathan Nichols (University of Leicester), Jonathan Rae (UCL), Ali Varsani (UCL), Tomoki Kimura (JAXA), Kenneth Hansen (University of Michigan), and Jamie Jasinski (UCL).

NASA's Marshall Space Flight Center in Huntsville, Alabama, manages the Chandra program for NASA's Science Mission Directorate in Washington. The Smithsonian Astrophysical Observatory in Cambridge, Massachusetts, controls Chandra's science and flight operations.


Fast Facts for Jupiter:

Scale: Each image is 60 arcsec across.
Category: Solar System
Observation Date: 02 Oct 2011 and 04 Oct 2011
Observation Time: 10 hours 50 minutes each pointing.
Obs. ID: 12315, 12316
Instrument: ACIS
References: Dunn, W. et al, 2016, JGR (accepted)
Color Code: X-ray (Purple); Optical (Red, Green, Blue)
Distance Estimate: About 650 million kilometers


Monday, February 29, 2016

NASA’s IBEX Observations Pin Down Interstellar Magnetic Field

(Artist concept) Far beyond the orbit of Neptune, the solar wind and the interstellar medium interact to create a region known as the , bounded on the inside by the termination shock, and on the outside by the heliopause. Credits: NASA/IBEX/Adler Planetarium

This simulation shows the origin of ribbon particles of different energies or speeds outside the heliopause (labeled HP). The IBEX ribbon particles interact with the interstellar magnetic field (labeled ISMF) and travel inwards toward Earth, collectively giving the impression of a ribbon spanning across the sky.Credits: SwRI/Zirnstein

The new paper is based on one particular theory of the origin of the IBEX ribbon, in which the particles streaming in from the ribbon are actually solar material reflected back at us after a long journey to the edges of the sun’s magnetic boundaries. A giant bubble, known as the heliosphere, exists around the sun and is filled with what’s called solar wind, the sun’s constant outflow of ionized gas, known as plasma. When these particles reach the edges of the heliosphere, their motion becomes more complicated.

“The theory says that some solar wind protons are sent flying back towards the sun as neutral atoms after a complex series of charge exchanges, creating the IBEX ribbon,” said Eric Zirnstein, a space scientist at the Southwest Research Institute in San Antonio, Texas, and lead author on the study. “Simulations and IBEX observations pinpoint this process – which takes anywhere from three to six years on average – as the most likely origin of the IBEX ribbon.”

Outside the heliosphere lies the interstellar medium, with plasma that has different speed, density, and temperature than solar wind plasma, as well as neutral gases. These materials interact at the heliosphere’s edge to create a region known as the inner heliosheath, bounded on the inside by the termination shock – which is more than twice as far from us as the orbit of Pluto – and on the outside by the heliopause, the boundary between the solar wind and the comparatively dense interstellar medium.

Some solar wind protons that flow out from the sun to this boundary region will gain an electron, making them neutral and allowing them to cross the heliopause. Once in the interstellar medium, they can lose that electron again, making them gyrate around the interstellar magnetic field. If those particles pick up another electron at the right place and time, they can be fired back into the heliosphere, travel all the way back toward Earth, and collide with IBEX’s detector. The particles carry information about all that interaction with the interstellar magnetic field, and as they  hit the detector they can give us unprecedented insight into the characteristics of that region of space.

“Only Voyager 1 has ever made direct observations of the interstellar magnetic field, and those are close to the heliopause, where it’s distorted,” said Zirnstein. “But this analysis provides a nice determination of its strength and direction farther out.”

The directions of different ribbon particles shooting back toward Earth are determined by the characteristics of the interstellar magnetic field. For instance, simulations show that the most energetic particles come from a different region of space than the least energetic particles, which gives clues as to how the interstellar magnetic field interacts with the heliosphere.

For the recent study, such observations were used to seed simulations of the ribbon’s origin. Not only do these simulations correctly predict the locations of neutral ribbon particles at different energies, but the deduced interstellar magnetic field agrees with Voyager 1 measurements, the deflection of interstellar neutral gases, and observations of distant polarized starlight.

However, some early simulations of the interstellar magnetic field don’t quite line up. Those pre-IBEX estimates were based largely on two data points – the distances at which Voyagers 1 and 2 crossed the termination shock.

“Voyager 1 crossed the termination shock at 94 astronomical units, or AU, from the sun, and Voyager 2 at 84 AU,” said Zirnstein. One AU is equal to about 93 million miles, the average distance between Earth and the sun. “That difference of almost 930 million miles was mostly explained by a strong, very tilted interstellar magnetic field pushing on the heliosphere.”

But that difference may be accounted for by considering a stronger influence from the solar cycle, which can lead to changes in the strength of the solar wind and thus change the distance to the termination shock in the directions of Voyager 1 and 2. The two Voyager spacecraft made their measurements almost three years apart, giving plenty of time for the variable solar wind to change the distance of the termination shock.

“Scientists in the field are developing more sophisticated models of the time-dependent solar wind,” said Zirnstein.

The simulations generally jibe well with the Voyager data.

The IBEX ribbon is a relatively narrow strip of particles flying in towards the sun from outside the heliosphere. A new study corroborates the idea that particles from outside the heliosphere that form the IBEX ribbon actually originate at the sun – and reveals information about the distant interstellar magnetic field. Credits: SwRI

“The new findings can be used to better understand how our space environment interacts with the interstellar environment beyond the heliopause,” said Eric Christian, IBEX program scientist at NASA’s Goddard Space Flight Center in Greenbelt, Maryland, who was not involved in this study. “In turn, understanding that interaction could help explain the mystery of what causes the IBEX ribbon once and for all.”

The Southwest Research Institute leads IBEX with teams of national and international partners. NASA Goddard manages the Explorers Program for the agency’s Heliophysics Division within the Science Mission Directorate in Washington.


Related Link


 Source: NASA/Ibex

Wednesday, October 14, 2015

Comet Encke: A Solar Windsock Observed by NASA’s STEREO

A visualization of the constant outflow of material from the sun, known as the solar wind. There is no consensus on what powers the solar wind’s acceleration, its extreme variability, or its remarkably high temperatures. Credits: ESA/NASA/SOHO


Much like the flapping of a windsock displays the quick changes in wind’s speed and direction, called turbulence, comet tails can be used as probes of the solar wind – the constant flowing stream of material that leaves the sun in all directions. According to new studies of a comet tail observed by NASA’s Solar and Terrestrial Relations Observatory, or STEREO, the vacuum of interplanetary space is filled with turbulence and swirling vortices similar to gusts of wind on Earth. Such turbulence can help explain two of the wind's most curious features: its variable nature and unexpectedly high temperatures. A paper on this work was published in “The Astrophysical Journal” on Oct. 13, 2015.

“The solar wind at Earth is about 70 times hotter than one might expect from the temperature of the solar corona and how much it expands as it crosses the void,” said Craig DeForest, a solar physicist at the Southwest Research Institute in Boulder, Colorado, and lead author on the study. “The source of this extra heat has been a mystery of solar wind physics for several decades.”

There is much that is conclusively known about the solar wind: It is made of a sea of electrically-charged electrons and ions and also carries the interplanetary magnetic field along for the ride, forging a magnetic connection between the sun and Earth and the other planets in the solar system. There is no consensus, however, on what powers the wind's acceleration, especially when it is traveling at its fastest speeds.

Complicating the search for such understanding are two of its most distinctive characteristics: The solar wind can be highly variable, meaning that measurements just short times or distances apart can yield quite different results. It is also very, very hot—remarkably so.

The new study helped explain these characteristics using the heliospheric imager onboard STEREO. The scientists studied the movements of hundreds of dense chunks of glowing ionized gas within the ribbon of Comet Encke’s tail, which passed within STEREO’s field of view in 2007. Fluctuations in the solar wind are mirrored in what is seen in the tail, so by tracking these clumps, scientists were able to reconstruct the motion of the solar wind, catching an unprecedented look at the turbulence.

Identifying this turbulence in the solar wind has the potential to solve the mystery of how the solar wind gets so hot. Based on the intensity of the turbulence researchers saw, they calculated that the energy available from turbulence is more than ten times what would be required to heat the solar wind to observed temperatures.

What's more, it also helps to solve the variability problem, which other theories have not yet done successfully.

“This turbulent motion mixes up the solar wind, leading to the rapid variation that we see at Earth,” said DeForest.

For years, scientists have taken direct measurements of the solar wind—known as in situ measurements, which are captured as the solar wind passes over one of the dozens of satellites carrying the appropriate instruments. Most of these satellites observe the sun from a vantage point similar to that of Earth.

STEREO-A, however, orbits the sun in a slightly smaller and faster orbit than Earth, meaning it moves around the sun farther and farther from Earth over time. So, in addition to the images of Comet Encke as it streamed past in April 2007, STEREO-A also provides us with in situ solar wind measurements from a unique perspective.

On the other hand, the solar wind is notoriously hard to study remotely—that is, with measurements from afar. Its particles flow at 250 miles per second, and they are so dispersed that interplanetary space at Earth’s orbit has about a thousand times fewer particles in one cubic inch of space than the best laboratory vacuum on Earth.

This solar wind dominates the space environment within our solar system and travels well past Pluto, creating a huge bubble known as the heliosphere. Closer to home, the solar wind also interacts with Earth’s magnetic field, sometimes initiating changes in near-Earth space that can disrupt our space technology or cause auroras. So scientists needed to come up with a way to look at something that’s invisible—and that’s where Comet Encke came in. 

Comet Encke’s ion tail can be seen stretching away from the sun towards the top of the image, captured by NASA’s MESSENGER spacecraft on Nov. 17, 2013, when the comet was about 33 million miles from the sun. The tail is created when the solar wind sweeps over the comet, capturing vaporized material and causing it to trail out behind the comet. The tail follows the lines of the magnetic field ingrained in the solar wind and reveals its motion. Credits: NASA/Johns Hopkins University Applied Physics Laboratory/Carnegie Institution of Washington/Southwest Research Institute


All comets, if they get close enough to the sun, will form what’s called an ion tail. One of the most recognizable features of these hunks of ice and rock, the ion tail is created when the solar wind—made of hot, charged gas, called plasma—sweeps over the comet, capturing the material that has been vaporized into plasma by sunlight, causing it to trail out behind the comet. This tail follows the lines of the magnetic field embedded in the solar wind and reveals its motion.

Comet Encke has some unusual characteristics that scientists were able to leverage to study the solar wind. Unlike most comets, Comet Encke has what is called a compact tail. Rather than feathering out loosely, creating a wide spray of ions, Comet Encke’s ion tail streams out in a tight, bright ribbon of glowing gas with compact features.

This video, captured by NASA’s STEREO mission, shows the motion of Comet Encke and its tail as it approached the sun in April 2007. Scientists studied the movements of hundreds of dense chunks of glowing ionized gas within the comet's tail, finding evidence of turbulence that may explain both the solar wind’s variability and its unexpectedly high temperatures. Credits: NASA/STEREO


"In situ measurements are limited because they don't follow the turbulence along its path,” said William Matthaeus, a professor of physics and astronomy at the University of Delaware and co-author on the study. “Now, for the first time, we observed the turbulent motions along their complex paths and quantified the mixing. We actually see the turbulence.”

Using the images from STEREO-A, scientists tracked 230 different features as they weaved through Comet Encke’s tail over the course of about 9.3 million miles of its journey around the sun. They then compared these motions to how they would expect solid objects to orbit around the sun, finding evidence that these gas clumps were being picked up by drag against the solar wind. They found that, though the gas clumps moved more or less randomly on smaller scales, they exhibited clear patterns on the scale of about 300,000 miles, indicating large-scale swirling eddies are mixing the solar wind—and possibly heating it as well.

“Turbulent motion cascades down into motion on smaller and smaller scales until it hits the level of the fundamental gyrations of the particles about the magnetic field, where it becomes heat,” said Aaron Roberts, a heliophysicist at NASA’s Goddard Space Flight Center in Greenbelt, Maryland. “This study estimates that there is enough energy contained in these swirling eddies to explain the extra heat several times over.”

These observations of the solar wind provide a preview of what NASA plans to observe more directly with the Solar Probe Plus, or SPP, mission in 2018. SPP will travel to within nine solar radii of the sun, which is nine times the radius of the Sun, or about 3.9 million miles. Since it’s possible to remotely observe comets closer to the sun than any spacecraft can travel, studying them does provide unique information about the solar wind and our sun’s atmosphere.

STEREO is the third mission in the NASA Heliophysics Division’s Solar Terrestrial Probes program, which is managed by NASA Goddard for NASA’s Science Mission Directorate, in Washington.


Related:


Editor: Ashley Morrow

Source: NASA/Sun

Saturday, March 09, 2013

Solar Wind Energy Source Discovered

 Solar wind flows away from the sun at speeds up to and exceeding 500 km/s (a million mph).  

An artist's concept of the Wind spacecraft sampling the solar wind. Justin Kasper's science result is inset. [larger image]

Solar Wind Energy (spp, 200px)
 An artist's concept of Solar Probe Plus approaching the sun where it can test the ion cyclotron theory. More

Using data from an aging NASA spacecraft, researchers have found signs of an energy source in the solar wind that has caught the attention of fusion researchers. NASA will be able to test the theory later this decade when it sends a new probe into the sun for a closer look.

The discovery was made by a group of astronomers trying to solve a decades-old mystery: What heats and accelerates the solar wind?

The solar wind is a hot and fast flow of magnetized gas that streams away from the sun's upper atmosphere.  It is made of hydrogen and helium ions with a sprinkling of heavier elements.  Researchers liken it to the steam from a pot of water boiling on a stove; the sun is literally boiling itself away. 

“But,” says Adam Szabo of the NASA Goddard Space Flight Center, “solar wind does something that steam in your kitchen never does.  As steam rises from a pot, it slows and cools.  As solar wind leaves the sun, it accelerates, tripling in speed as it passes through the corona. Furthermore, something inside the solar wind continues to add heat even as it blows into the cold of space."

Finding that "something" has been a goal of researchers for decades.  In the 1970s and 80s, observations by two German/US Helios spacecraft set the stage for early theories, which usually included some mixture of plasma instabilities, magnetohydrodynamic waves, and turbulent heating.  Narrowing down the possibilities was a challenge. The answer, it turns out, has been hiding in a dataset from one of NASA's oldest active spacecraft, a solar probe named Wind.

Launched in 1994, Wind is so old that it uses magnetic tapes similar to old-fashioned 8-track tapes to record and play back its data.  Equipped with heavy shielding and double-redundant systems to safeguard against failure, the spacecraft was built to last; at least one researcher at NASA calls it the "Battlestar Gallactica" of the heliophysics fleet. Wind has survived almost two complete solar cycles and innumerable solar flares.

"After all these years, Wind is still sending us excellent data," says Szabo, the mission’s project scientist, “and it still has 60 years' worth of fuel left in its tanks.”

Using Wind to unravel the mystery was, to Justin Kasper of the Harvard-Smithsonian Center for Astrophysics, a "no brainer." He and his team processed the spacecraft's entire 19-year record of solar wind temperatures, magnetic field and energy readings and ...

"I think we found it," he says.  "The source of the heating in the solar wind is ion cyclotron waves."

Ion cyclotron waves are made of protons that circle in wavelike-rhythms around the sun's magnetic field.  According to a theory developed by Phil Isenberg (University of New Hampshire) and expanded by Vitaly Galinsky and Valentin Shevchenko (UC San Diego), ion cyclotron waves emanate from the sun; coursing through the solar wind, they heat the gas to millions of degrees and accelerate its flow to millions of miles per hour. Kasper's findings confirm that ion cyclotron waves are indeed active, at least in the vicinity of Earth where the Wind probe operates. 

Ion cyclotron waves can do much more than heat and accelerate the solar wind, notes Kasper.  "They also account for some of the wind's very strange properties."

The solar wind is not like wind on Earth.  Here on Earth, atmospheric winds carry nitrogen, oxygen, water vapor along together; all species move with the same speed and they have the same temperature.  The solar wind, however, is much stranger.  Chemical elements of the solar wind such as hydrogen, helium, and heavier ions, blow at different speeds; they have different temperatures; and, strangest of all, the temperatures change with direction.

"We have long wondered why heavier elements in the solar wind move faster and have higher temperatures than the lighter elements," says Kasper.  "This is completely counterintuitive."

The ion cyclotron theory explains it: Heavy ions resonate well with ion cyclotron waves. Compared to their lighter counterparts, they gain more energy and heat as they surf. 

The behavior of heavy ions in the solar wind is what intrigues fusion researchers. Kasper explains: "When you look at fusion reactors on Earth, one of the big challenges is contamination.  Heavy ions that sputter off the metal walls of the fusion chamber get into the plasma where the fusion takes place.  Heavy ions radiate heat. This can cool the plasma so much that it shuts down the fusion reaction." 

Ion cyclotron waves of the type Kasper has found in the solar wind might provide a way to reverse this process. Theoretically, they could be used to heat and/or remove the heavy ions, restoring thermal balance to the fusing plasma. 

"I have been invited to several fusion conferences to talk about our work with the solar wind," he says.

The next step, agree Kasper and Szabo, is to find out if ion cyclotron waves work the same way deep inside the sun's atmosphere where the solar wind begins its journey.  To find out, NASA is planning to send a spacecraft into the sun itself.

Solar Probe Plus, scheduled for launch in 2018, will plunge so far into the sun's atmosphere that the sun will appear as much as 23 times wider than it does in the skies of Earth. At closest approach, about 7 million km from the sun's surface, Solar Probe Plus must withstand temperatures greater than 1400 deg. C and survive blasts of radiation at levels not experienced by any previous spacecraft.  The mission's goal is to sample the sun's plasma and magnetic field at the very source of the solar wind.

"With Solar Probe Plus we'll be able to conduct specific tests of the ion cyclotron theory using sensors far more advanced than the ones on the Wind spacecraft," says Kasper.  "This should give us a much deeper understanding of the solar wind's energy source."

The research described in this story was published in the Physical Review Letters on February 28, 2013: "Sensitive Test for Ion-Cyclotron Resonant Heating in the Solar Wind" by Justin Kasper et al. 

Author: Dr. Tony Phillips | Production editor: Dr. Tony Phillips 
Credit: Science@NASA


Friday, January 11, 2013

Cluster Mission Indicates Turbulent Eddies May Warm the Solar Wind

A 2-dimensional vision of the solar wind turbulence at the smallest scale seen yet, thanks to observations by Cluster satellites. The approximate location of the measurements is indicated on a graphic illustrating features of Earth’s magnetic environment. The inset shows conditions as would be seen facing the solar wind, with current sheets forming at the border of turbulent eddies. The trajectory of the Cluster spacecraft is marked on the inset by the black line and the color gradients represent the magnetic field strength intensity. Background graphic: ESA/ATG Medialab.  Inset: NASA/J. Dorelli .  › View larger

 The sun ejects a continuous flow of electrically charged particles and magnetic fields in the form of the solar wind -- and this wind is hotter than it should be. A new study of data obtained by European Space Agency's Cluster spacecraft may help explain the mystery.

The solar wind is made of an electrically-charged gas called plasma. One theory about the wind's puzzling high temperatures is that irregularities in the flow of charged particles and magnetic fields in the plasma create turbulence, which, in turn, dissipates and adds heat to its surroundings. Using two separate sets of data sent back by Cluster, an international team of scientists has probed the spatial characteristics of this turbulence in more detail and at smaller scales than ever before. They saw evidence that the turbulence evolved to form very small “current sheets” -- thin sheets of electrical current that separate regions of rotated magnetic field.

“For the first time, we were able to obtain direct evidence for the existence of current sheets at these very small scales, where dissipation of magnetic energy into heat is thought to occur,” said Melvyn Goldstein, project scientist for Cluster at NASA’s Goddard Space Flight Center in Greenbelt, Md. Goldstein is a co-author of a paper on these results that appeared in the Nov. 9, 2012, issue of Physical Review Letters.

This solar wind is a non-stop gale of plasma, mainly protons and electrons, which originates in the sun’s searingly hot lower atmosphere. It blasts outward in all directions at an average speed of about 250 miles per second. The outflow is so energetic that it pulls along the sun’s magnetic field. The solar wind travels across the entire solar system, until it reaches the boundary with interstellar space. The plasma cools as it expands during its outward journey. However, the amount of cooling is much less than would be expected in a constant, smooth flow of solar particles since the density is so low that the particles cannot be receiving extra heat from the most common method on Earth: collisions.

By providing the first observations of these small current sheets, the Cluster data help confirm that such sheets may play an important role in the dissipation of the turbulence – meaning that as the turbulence cascades from larger disturbances to smaller ones, energy is taken out of the magnetic field and added to its surroundings as heat. The current sheets are more or less two-dimensional. They may are also be sites where the magnetic field lines reconnect and break, resulting in a transfer of energy to both particle heating and particle flows. Such magnetic reconnection occurs in many regions in the universe including in the solar wind, inside the sun and other stars, and in Earth’s magnetic environment, the magnetosphere. Finding direct evidence for magnetic reconnection at these scales is difficult with the present instrumentation, however, and resolution of that question may have to await the launch of NASA’s Magnetospheric Multiscale (MMS) mission in 2014, a mission that will focus on reconnection in the magnetosphere.

The team’s study made use of the high time resolution of the Spatio Temporal Analysis Field Fluctuation (STAFF) magnetometer, which is carried on each of the four Cluster spacecraft. STAFF is capable of detecting rapid variations in magnetic fields, which means that very small spatial structures can be recognized within the plasma.

The scientists examined two sets of STAFF observations. The first data were obtained on Jan. 10, 2004, when two Cluster spacecraft (C2 and C4) were separated along the solar wind flow direction by only 12 miles apart, while the two other spacecraft were much further away. At that time, STAFF was operating in rapid burst mode, during which it recorded 450 measurements of the magnetic field per second. Additional data were obtained by a single spacecraft (Cluster 2) on March 19, 2006.

"During the 2004 observation, both spacecraft were so close that they observed almost simultaneously the same structure in the solar wind as it passed them by. The magnetic field data showed the typical signature of a current sheet crossing," says Silvia Perri of the Università della Calabria, Italy, who is the lead author of the paper. At that time, the solar wind was flowing at about 350 miles per second. The current sheet event lasted only 0.07 seconds for both satellites and this corresponds to a spatial size of about 25 miles.

“This shows for the first time that the solar wind plasma is extremely structured at these very small scales,” says Perri. “It is clear that we are seeing a release of energy approaching smaller and smaller scales, which may contribute to the overall heating of the solar wind.”

For more information about NASA's MMS Mission, visit:  http://mms.gsfc.nasa.gov/


ESA and Karen C. Fox
NASA Goddard Space Flight Center, Greenbelt, MD