Showing posts with label 3D map. Show all posts

Saturday, March 15, 2025

Astronomy’s dirty window to space

Visualization of the wavelength-dependence of extinction (the “extinction curve”) caused by dust, for the plane of our galaxy’s disk, out to a distance of 8,000 light-years from the Sun. Red indicates regions where extinction falls off more rapidly at long wavelengths (the red end of the spectrum), while blue indicates that extinction is less dependent on wavelength. Regions with insufficient data are shown in white. The gray contours enclose regions of high dust density. © X. Zhang/G. Green, MPIA


Astronomers from the Max Planck Institute for Astronomy have constructed the first detailed 3D map of the properties of cosmic dust in our home galaxy. For their map, the astronomers used 130 million spectra from ESA’s Gaia mission, results from the LAMOST spectral survey, and machine learning. Dust makes distant astronomical objects appear more reddish and dimmer than they really are, so the new map will be an important tool for astronomers to make sense of their observations. The study has also revealed unusual properties of cosmic dust that will lead to further research.

When we observe distant celestial objects, there is a possible catch: Is that star I am observing really as reddish as it appears? Or does the star merely look reddish, since its light has had to travel through a cloud of cosmic dust to reach our telescope? For accurate observations, astronomers need to know the amount of dust between them and their distant targets. Not only does dust make objects appear reddish (“reddening”), it also makes them appear fainter than they really are (“extinction”). It’s like we are looking out into space through a dirty window. Now, two astronomers have published a 3D map that documents the properties of dust all around us in unprecedented detail, helping us make sense of what we observe.

Behind this is the fact that, fortunately, when looking at stars, there is a way of reconstructing the effect of dust. Cosmic dust particles do not absorb and scatter light evenly across all wavelengths. Instead, they absorb light more strongly at shorter wavelengths (towards the blue end of the spectrum), and less strongly at longer wavelengths (towards the red end). The wavelength-dependence can be plotted as an “extinction curve,” and its shape provides information not only about the composition of the dust, but also about its local environment, such as the amount and properties of radiation in the various regions of interstellar space.

Retrieving dust information from 130 million spectra

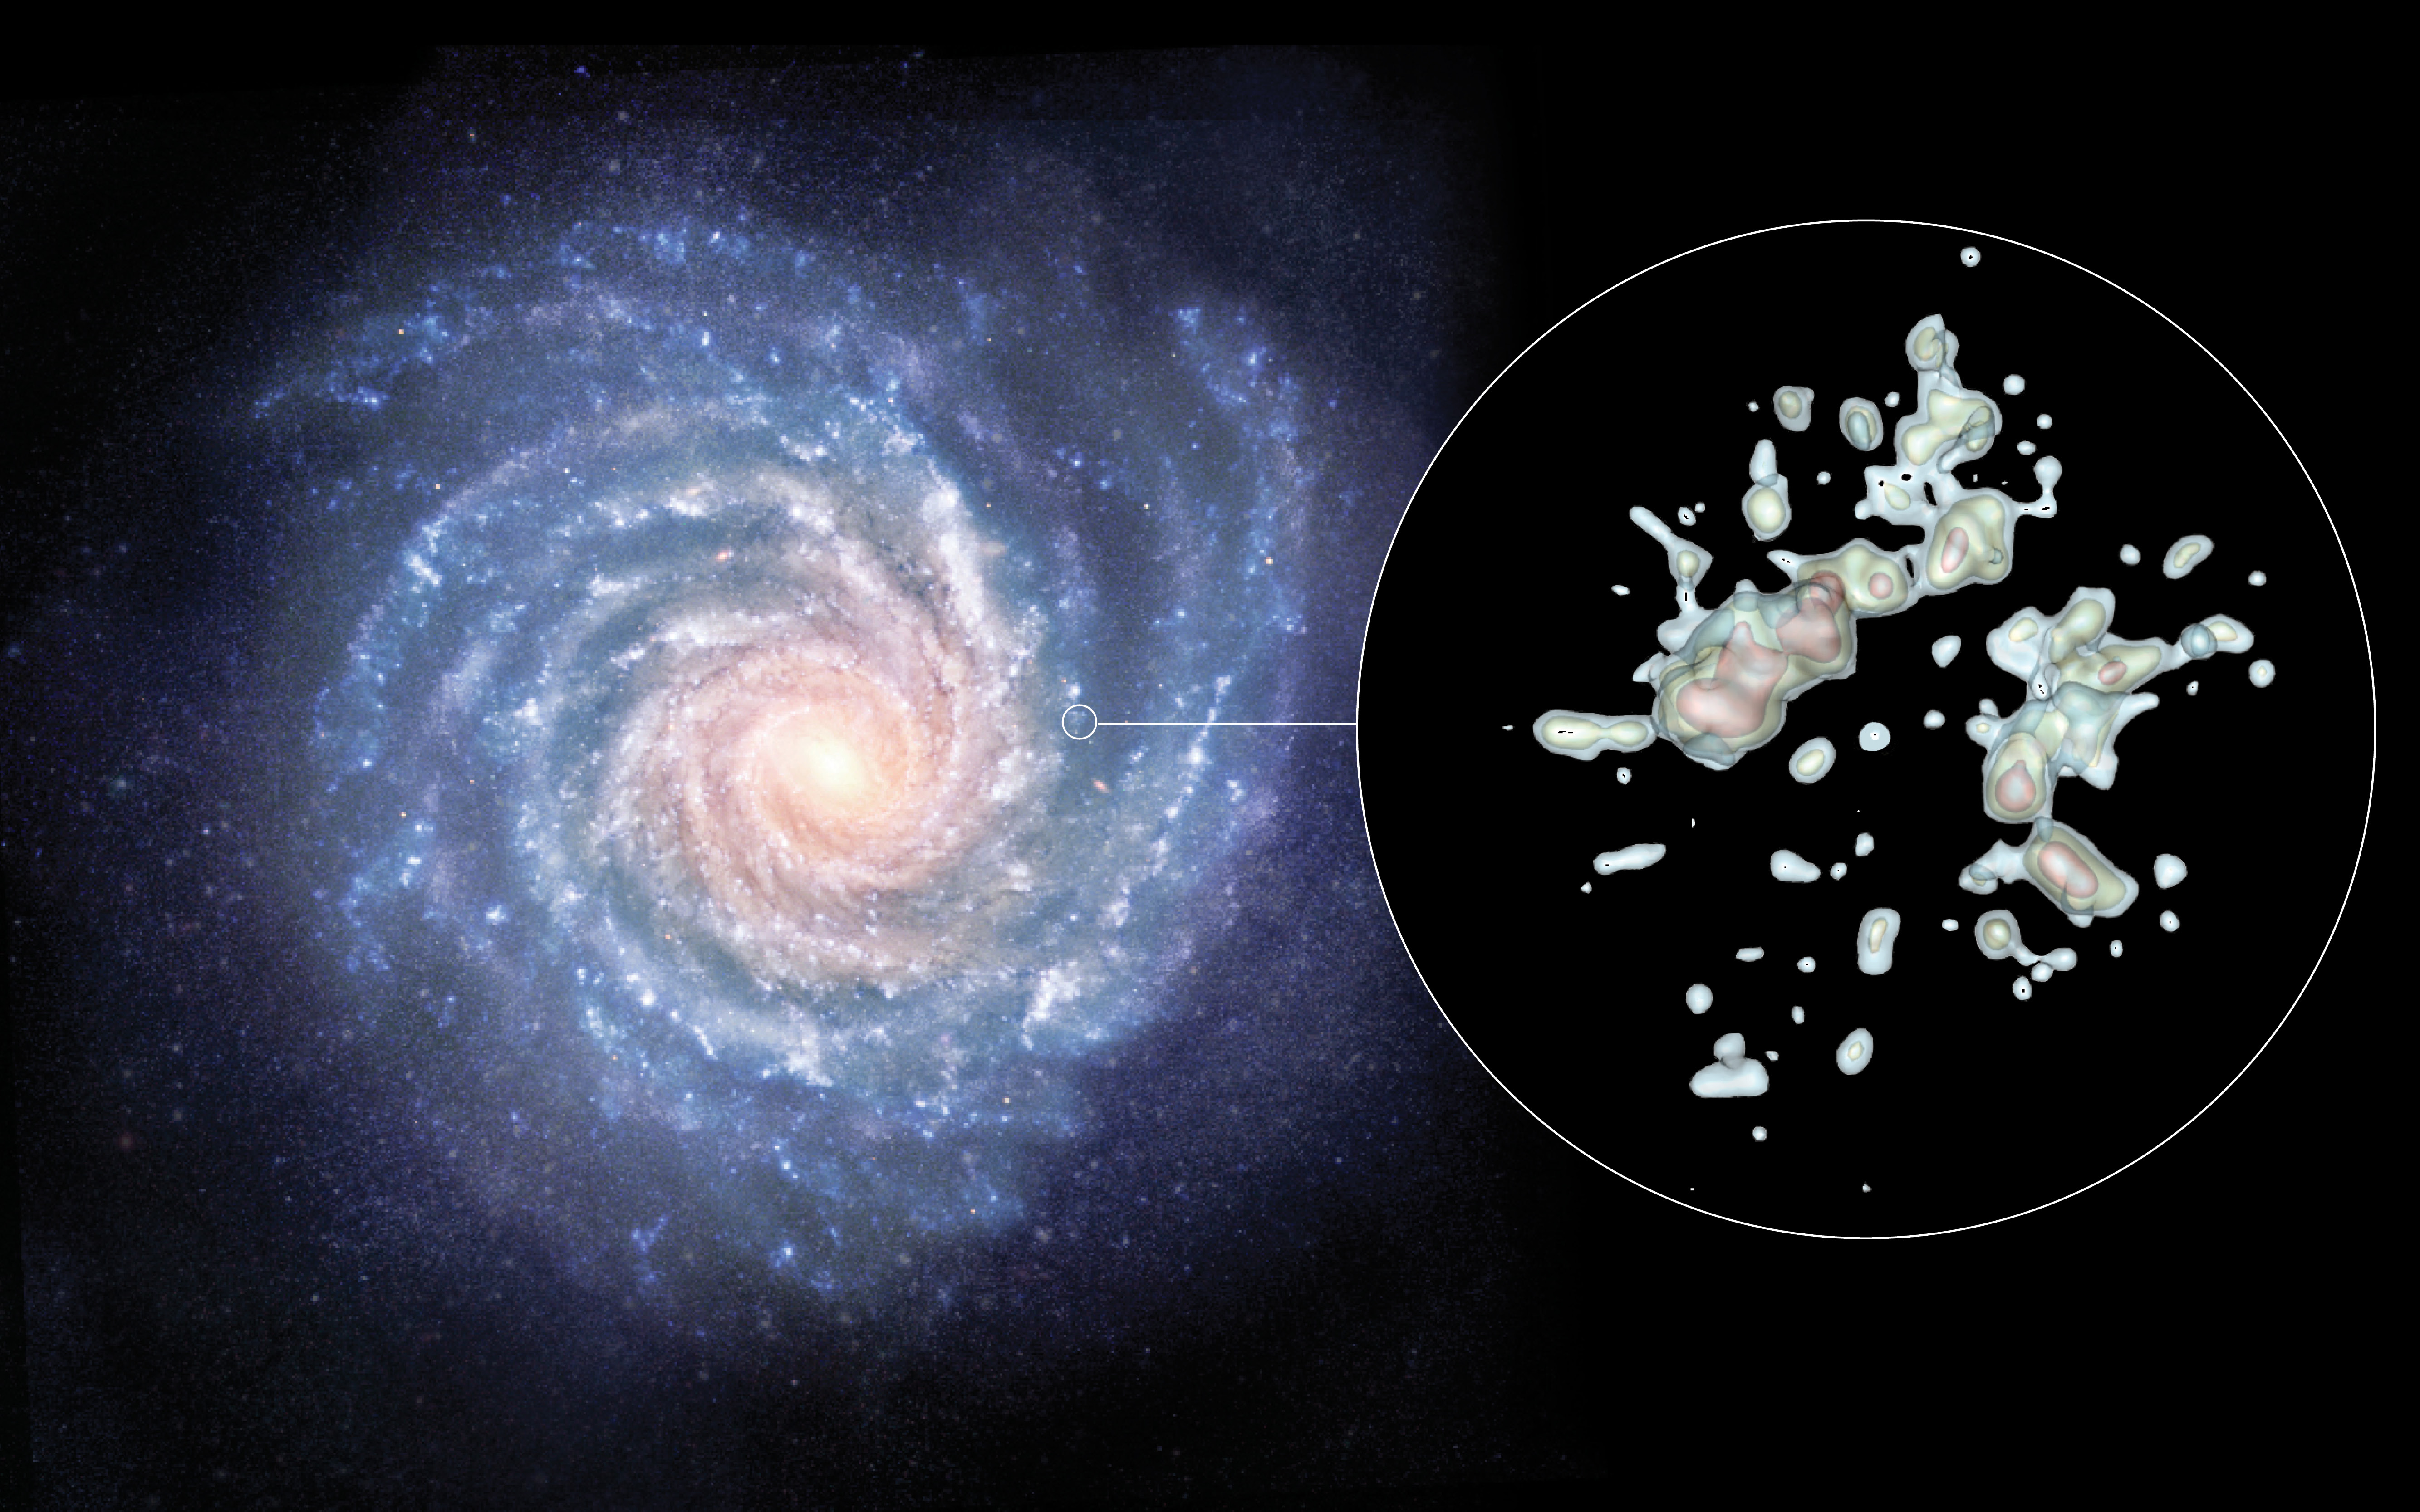
This is the kind of information used by Xiangyu Zhang, a PhD student at the Max Planck Institute for Astronomy (MPIA), and Gregory Green, an independent research group leader (Sofia Kovalevskaja Group) at MPIA and Zhang’s PhD advisor, to construct the most detailed 3D map yet of the properties of dust in the Milky Way galaxy. Zhang and Green turned to data from ESA’s Gaia mission, which was a 10.5-year-effort to obtain extremely accurate measurements of positions, motions and additional properties for more than a billion stars in our Milky Way and in our nearest galactic neighbours, the Magellanic Clouds. The third data release (DR3) of the Gaia mission, published in June 2022, provides 220 million spectra, and a quality check told Zhang and Green that about 130 million of those would be suitable for their search for dust.

The Gaia spectra are low-resolution, that is, the way that they separate light into different wavelength regions is comparatively coarse. The two astronomers found a way around that limitation: For 1% of their chosen stars, there is high-resolution spectroscopy from the LAMOST survey operated by the National Astronomical Observatories of China. This provides reliable information about the basic properties of the stars in question, such as their surface temperatures, which determines what astronomers call a star’s “spectral type.” Reconstructing a 3D map

Zhang and Green trained a neural network to generate model spectra based on a star’s properties and the properties of the intervening dust. They compared the results to 130 million suitable spectra from Gaia, and used statistical (“Bayesian”) techniques to deduce the properties of the dust between us and those 130 million stars.

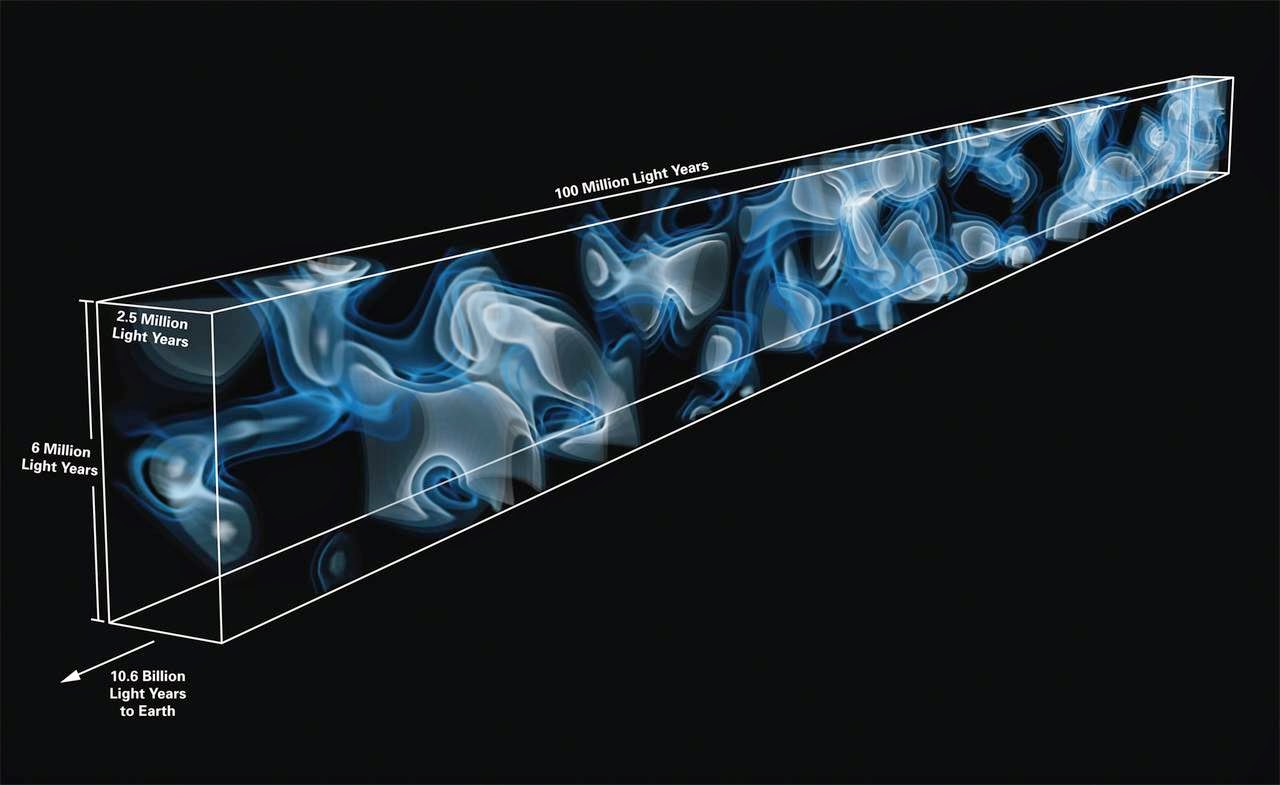
The results allowed the astronomers to reconstruct the first detailed, three-dimensional map of the extinction curve of dust in the Milky Way. This map was made possible by Zhang and Green’s measurement of the extinction curve towards an unprecedented number of stars – 130 million, compared to previous works, which contained approximately 1 million measurements.

But dust is not just a nuisance for astronomers. It is important for star formation, which occurs in giant gas clouds shielded by their dust from the surrounding radiation. When stars form, they are surrounded by disks of gas and dust, which are the birthplaces of planets. The dust grains themselves are the building blocks for what will eventually become the solid bodies of planets like our Earth. In fact, within the interstellar medium of our galaxy, most of the elements heavier than hydrogen and helium are locked up in interstellar dust grains.

Unexpected properties of cosmic dust

The new results not only produce an accurate 3D map. They have also turned up a surprising property of interstellar dust clouds. Previously, it had been expected that the extinction curve should become flatter (less dependent on wavelength) for regions with a higher dust density. “Higher density,” of course, is in this case still very little: approximately ten billionth billionth grams of dust per cubic meter, equivalent to just 10 kg of dust in a sphere with Earth’s radius. In such regions, dust grains tend to grow in size, which changes the overall absorption properties.

Instead, the astronomers found that in areas of intermediate density, the extinction curve actually becomes steeper, with smaller wavelengths absorbed much more effectively than longer ones. Zhang and Green surmise that the steepening might be caused by the growth not of dust, but of a class of molecules called polycyclic aromatic hydrocarbons (PAHs), the most abundant hydrocarbons in the interstellar medium, which may even have played a role in the origin of life. They have already set out to test their hypothesis with future observations.

Background information

The results reported here have been published as Xiangyu Zhang and Gregory M. Green, “Three-dimensional maps of the interstellar dust extinction curve within the Milky Way galaxy,” in the journal Science. Both authors work at the Max Planck Institute for Astronomy.


Contacts: 

Dr. Markus Pössel

tel: +49 6221 528-261
pr@mpia.de
MPIA press department
Max Planck Institute for Astronomy, Heidelberg

Dr. Gregory Green
Sofia Kovalevskaja Group Leader

tel: +49 6221 528-460
green@mpia.de
Gregory Green / MPIA
Max-Planck-Institut für Astronomie, Heidelberg, Deutschland


Original publication

Xiangyu Zhang, Gregory M. Green
Three-dimensional maps of the interstellar dust extinction curve within the Milky Way galaxy
Science (2025). DOI: 10.1126/science.ado9787
Preprint available at:
https://www.eurekalert.org/press/scipak/

Download


Tuesday, December 12, 2023

Our Neighborhood in the Milky Way in 3D


Bird's-eye view of the distribution of dust within 4,077 light-years around the Sun. The Sun is at the center and the galactic center is to the right. © MPA

High-resolution three-dimensional maps of the Milky Way have previously been limited to the immediate vicinity of the Sun. In a collaboration led by the Max Planck Institute for Astrophysics with researchers from Harvard, the Space Telescope Science Institute, and the University of Toronto, we were now able to build a high-resolution map of the Milky Way in 3D out to more than 4,000 light-years. The produced 3D map will be highly useful for a wide range of applications from star formation to cosmological foreground correction.

When we think about the Milky Way, we often think about 2D images of the night sky or artist's impressions of how the Milky Way might look from outside our Galaxy. With the advent of Gaia, we are entering a new era of Milky Way science, in which we begin to unfold our previous 2D view of the Milky Way into a rich 3D picture. In recent years, we started to build 3D maps of the distribution of matter in the immediate vicinity of the Sun out to approximately 1,000 light-years. Thanks to these maps, we were able to study the star formation around the Sun in 3D, made numerous discoveries about the shape, mass, and density of nearby molecular clouds, and learned how supernova feedback shaped the space around the Sun.

At the core of maps of the 3D distribution of matter in the Milky Way lies interstellar dust. Interstellar dust closely traces the distribution of matter, cools gas such that stars can form, agglomerates to form planets, and obscures astrophysical observations. Incidentally, this obscuration allows us to quantify the amount of dust between us, on Earth, and the astrophysical object we want to observe in the background, often stars. We can infer the 3D distribution of dust and thus indirectly trace the distribution of matter in the Galaxy using this information. To do so, we combine millions of measurements of the amount of dust to background objects with distance estimates to said objects from Gaia.

Inferring the distribution of dust in the Milky Way from distances and dust measurements is a computationally intensive, statistical inverse problem. The problem is ill posed: from our limited data and prior knowledge about dust, it is not possible to retrieve a definite answer about the true distribution of dust. Still, the language of statistics allows us to translate our noisy data with a physics-informed model of dust into a 3D dust map with rigorously quantified uncertainties. Until now, however, the computational costs of 3D dust models have limited the size of the probed volume.

Recent progress in our physics-informed model of dust enabled us to probe much larger distances. We put forward a new statistical method to model spatially smooth structures in large volumes – a required component of dust maps. At the heart of the new method is an algorithm to iteratively add ever-finer details to a coarse representation of 3D dust. By adding details iteratively instead of modelling everything at once, the modelling problem drastically simplifies and becomes faster by orders of magnitude.

We combined the new methodological developments with the latest processed Gaia data to create the largest high-resolution map of interstellar dust to date. The new 3D dust map extends 4,077 light-years in all directions from the Sun with a resolution of a few light-years. The produced 3D map will be highly useful for studying the medium between stars in the Milky Way. Understanding the structure of the interstellar medium will help us constrain key relations for star formation. In addition, the 3D dust map will be important for correcting astrophysical observations. For many observations, the interstellar medium in front of the object of interest is a nuisance. The new 3D dust map will allow correcting these measurements for the foreground material in a much larger volume than previous maps.


The distribution of dust out to 4,077 light-years around the Sun rotating around the galactic z-axis. The red line indicates the galactic x-axis toward the galactic center, the green line the galactic y-axis, and the blue line the galactic z-axis.


Author:

Gordian Edenhofer
PhD student
edh@mpa-garching.mpg.de

Original publications

1. Gordian Edenhofer, Catherine Zucker, Philipp Frank, Andrew K. Saydjari, Joshua S. Speagle, Douglas Finkbeiner, Torsten Enßlin

A Parsec-Scale Galactic 3D Dust Map out to 1.25 kpc from the Sun
submitted to xxx


Source 2. Gordian Edenhofer, Reimar H. Leike, Philipp Frank, Torsten A. Enßlin

Sparse Kernel Gaussian Processes through Iterative Charted Refinement (ICR)
submitted to xxx


Source


Thursday, September 15, 2016

Gaia's billion-star map hints at treasures to come

Copyright: ESA/Gaia/DPAC

Copyright: ESA/ATG medialab; background: ESO/S. Brunier


The first catalogue of more than a billion stars from ESA’s Gaia satellite was published today – the largest all-sky survey of celestial objects to date.

On its way to assembling the most detailed 3D map ever made of our Milky Way galaxy, Gaia has pinned down the precise position on the sky and the brightness of 1142 million stars.

As a taster of the richer catalogue to come in the near future, today’s release also features the distances and the motions across the sky for more than two million stars.

“Gaia is at the forefront of astrometry, charting the sky at precisions that have never been achieved before,” says Alvaro Giménez, ESA’s Director of Science.

“Today’s release gives us a first impression of the extraordinary data that await us and that will revolutionise our understanding of how stars are distributed and move across our Galaxy.”

Launched 1000 days ago, Gaia started its scientific work in July 2014. This first release is based on data collected during its first 14 months of scanning the sky, up to September 2015.

“The beautiful map we are publishing today shows the density of stars measured by Gaia across the entire sky, and confirms that it collected superb data during its first year of operations,” says Timo Prusti, Gaia project scientist at ESA.

 Copyright ESA/Gaia/DPAC

The stripes and other artefacts in the image reflect how Gaia scans the sky, and will gradually fade as more scans are made during the five-year mission.

“The satellite is working well and we have demonstrated that it is possible to handle the analysis of a billion stars. Although the current data are preliminary, we wanted to make them available for the astronomical community to use as soon as possible,” adds Dr Prusti.

Transforming the raw information into useful and reliable stellar positions to a level of accuracy never possible before is an extremely complex procedure, entrusted to a pan-European collaboration of about 450 scientists and software engineers: the Gaia Data Processing and Analysis Consortium, or DPAC.
“Today’s release is the result of a painstaking collaborative work over the past decade,” says Anthony Brown from Leiden University in the Netherlands, and consortium chair.

“Together with experts from a variety of disciplines, we had to prepare ourselves even before the start of observations, then treated the data, packaged them into meaningful astronomical products, and validated their scientific content.”

In addition to processing the full billion-star catalogue, the scientists looked in detail at the roughly two million stars in common between Gaia’s first year and the earlier Hipparcos and Tycho-2 Catalogues, both derived from ESA’s Hipparcos mission, which charted the sky more than two decades ago.

By combining Gaia data with information from these less precise catalogues, it was possible to start disentangling the effects of ‘parallax’ and ‘proper motion’ even from the first year of observations only. Parallax is a small motion in the apparent position of a star caused by Earth’s yearly revolution around the Sun and depends on a star’s distance from us, while proper motion is due to the physical movement of stars through the Galaxy.

In this way, the scientists were able to estimate distances and motions for the two million stars spread across the sky in the combined Tycho–Gaia Astrometric Solution, or TGAS.

This new catalogue is twice as precise and contains almost 20 times as many stars as the previous definitive reference for astrometry, the Hipparcos Catalogue.

As part of their work in validating the catalogue, DPAC scientists have conducted a study of open stellar clusters – groups of relatively young stars that were born together – that clearly demonstrates the improvement enabled by the new data.

Copyright: ESA/Gaia/DPAC


“With Hipparcos, we could only analyse the 3D structure and dynamics of stars in the Hyades, the nearest open cluster to the Sun, and measure distances for about 80 clusters up to 1600 light-years from us,” says Antonella Vallenari from the Istituto Nazionale di Astrofisica (INAF) and the Astronomical Observatory of Padua, Italy.

“But with Gaia’s first data, it is now possible to measure the distances and motions of stars in about 400 clusters up to 4800 light-years away.

For the closest 14 open clusters, the new data reveal many stars surprisingly far from the centre of the parent cluster, likely escaping to populate other regions of the Galaxy.”

Many more stellar clusters will be discovered and analysed in even greater detail with the extraordinary data that Gaia continues to collect and that will be released in the coming years.
Copyright: ESA/Gaia/DPAC; 
acknowledgement: S. Jordan & T. Sagristà Sellés (Zentrum für Astronomie der Universität Heidelberg) 


The new stellar census also contains 3194 variable stars, stars that rhythmically swell and shrink in size, leading to periodic brightness changes.

Many of the variables seen by Gaia are in the Large Magellanic Cloud, one of our galactic neighbours, a region that was scanned repeatedly during the first month of observations, allowing accurate measurement of their changing brightness.

Details about the brightness variations of these stars, 386 of which are new discoveries, are published as part of today’s release, along with a first study to test the potential of the data.

“Variable stars like Cepheids and RR Lyraes are valuable indicators of cosmic distances,” explains Gisella Clementini from INAF and the Astronomical Observatory of Bologna, Italy.

“While parallax is used to measure distances to large samples of stars in the Milky Way directly, variable stars provide an indirect, but crucial step on our ‘cosmic distance ladder’, allowing us to extend it to faraway galaxies.”

This is possible because some kinds of variable stars are special. For example, in the case of Cepheid stars, the brighter they are intrinsically, the slower their brightness variations. The same is true for RR Lyraes when observed in infrared light. The variability pattern is easy to measure and can be combined with the apparent brightness of a star to infer its true brightness.

This is where Gaia steps in: in the future, scientists will be able to determine very accurate distances to a large sample of variable stars via Gaia's measurements of parallaxes. With those, they will calibrate and improve the relation between the period and brightness of these stars, and apply it to measure distances beyond our Galaxy. A preliminary application of data from the TGAS looks very promising.

“This is only the beginning: we measured the distance to the Large Magellanic Cloud to test the quality of the data, and we got a sneak preview of the dramatic improvements that Gaia will soon bring to our understanding of cosmic distances,” adds Dr Clementini.

Copyright: B. Sicardy (LESIA, Observatoire de Paris, France), P. Tanga (Observatoire de la Côte d'Azur, Nice, France), A. Carbognani (Osservatorio Astronomico Valle d'Aosta, Italy), Rodrigo Leiva (LESIA, Observatoire de Paris)


Knowing the positions and motions of stars in the sky to astonishing precision is a fundamental part of studying the properties and past history of the Milky Way and to measure distances to stars and galaxies, but also has a variety of applications closer to home – for example, in the Solar System.

In July, Pluto passed in front of a distant, faint star, offering a rare chance to study the atmosphere of the dwarf planet as the star gradually disappeared and then reappeared behind Pluto.

This stellar occultation was visible only from a narrow strip stretching across Europe, similar to the totality path that a solar eclipse lays down on our planet’s surface. Precise knowledge of the star’s position was crucial to point telescopes on Earth, so the exceptional early release of the Gaia position for this star, which was 10 times more precise than previously available, was instrumental to the successful monitoring of this rare event.

Early results hint at a pause in the puzzling pressure rise of Pluto’s tenuous atmosphere, something that has been recorded since 1988 in spite of the dwarf planet moving away from the Sun, which would suggest a drop in pressure due to cooling of the atmosphere.

“These three examples demonstrate how Gaia’s present and future data will revolutionise all areas of astronomy, allowing us to investigate our place in the Universe, from our local neighbourhood, the Solar System, to Galactic and even grander, cosmological scales,” explains Dr Brown.

This first data release shows that the mission is on track to achieve its ultimate goal: charting the positions, distances, and motions of one billion stars – about 1% of the Milky Way’s stellar content – in three dimensions to unprecedented accuracy.

“The road to today has not been without obstacles: Gaia encountered a number of technical challenges and it has taken an extensive collaborative effort to learn how to deal with them,” says Fred Jansen, Gaia mission manager at ESA.

“But now, 1000 days after launch and thanks to the great work of everyone involved, we are thrilled to present this first dataset and are looking forward to the next release, which will unleash Gaia’s potential to explore our Galaxy as we've never seen it before.”


Notes for Editors

The data from Gaia’s first release can be accessed at http://archives.esac.esa.int/gaia
 
The content of this first release was presented today during a media briefing at ESA’s European Space Astronomy Centre (ESAC) in Villanueva de la Cañada, Madrid, Spain.

Fifteen scientific papers describing the data contained in the release and their validation process will appear in a special issue of Astronomy & Astrophysics.

Gaia is an ESA mission to survey one billion stars in our Galaxy and local galactic neighbourhood in order to build the most precise 3D map of the Milky Way and answer questions about its structure, origin and evolution.

A large pan-European team of expert scientists and software developers, the Data Processing and Analysis Consortium, located in and funded by many ESA member states, is responsible for the processing and validation of Gaia’s data, with the final objective of producing the Gaia Catalogue.

Scientific exploitation of the data will only take place once they are openly released to the community.

Members of the consortium come from 20 European countries (Austria, Belgium, Czech Republic, Denmark, Estonia, Finland, France, Germany, Greece, Hungary, Ireland, Italy, Netherlands, Poland, Portugal, Slovenia, Spain, Switzerland, Sweden and the UK) as well as from further afield (Algeria, Brazil, Israel and the US).

In addition, ESA makes a significant contribution to the consortium in the form of the Data Processing Centre at ESAC, which, among other tasks and responsibilities, acts as the central hub for all Gaia data processing.


For further information, please contact:

Markus Bauer
ESA Science and Robotic Exploration Communication Officer

Tel: +31 71 565 6799

Mob: +31 61 594 3 954

Email: markus.bauer@esa.int

Timo Prusti
Gaia Project Scientist
European Space Agency
Email: timo.prusti@esa.int

Anthony Brown
Leiden Observatory, Leiden University
Leiden, The Netherlands
Email: brown@strw.leidenuniv.nl

Antonella Vallenari
INAF and Astronomical Observatory of Padua, Italy
Email: antonella.vallenari@oapd.inaf.it

Gisella Clementini
INAF and Astronomical Observatory of Bologna, Italy
Email: gisella.clementini@oabo.inaf.it

Fred Jansen
Gaia mission manager
European Space Agency
Email: fjansen@cosmos.esa.int


Source: ESA/GAIA

Wednesday, November 18, 2015

Another Dimension: 3D visualisation redefines Milky Way's local architecture

Astronomers have used modern techniques to visualise data from ESA's Hipparcos space astrometry mission in three dimensions. The treatment of the data has offered insights into the distribution of nearby stars and uncovered new groupings of stars in the solar neighbourhood, shedding light on the origins of the stars in Orion and calling into question the existence of the Gould Belt – an iconic ring-shaped structure of stars in the Milky Way. The results show the potential of 3D visualisation of the solar neighbourhood, an approach which is of particular relevance to ESA's Gaia mission which will map the Milky Way and Local Group in 3D with unprecedented sensitivity and accuracy.  

Visualising the local solar neighbourhood in 3D. 
Credit: ESA. Acknowledgement: H. Bouy (CSIC-INTA) & J. Alves (U. Vienna)


In a new study published in Astronomy & Astrophysics researchers have created a 3D map [1] of massive O and B type stars (sometimes referred to as OB stars) using data from ESA's Hipparcos satellite, launched in 1989 and operated until 1993. These stars, which live for a maximum of only a few tens of millions of years, are important markers of recent star formation and much can be learnt from studying their distribution in the solar neighbourhood.

Previous studies have looked for groupings of these stellar giants by seeking out concentrations of them in 2D projections. Astronomers use these 2D projections to look at the position and velocity of the stars in a given region and pick out stars that are moving together, and are thus most likely members of the same stellar group.

"Mapping data from missions like Hipparcos in two dimensions has allowed us to identify and classify numerous stellar groups and has profoundly changed our knowledge and understanding of the solar vicinity," explains Hervé Bouy from the Center for Astrobiology (CSIC-INTA), Spain, lead author of the study. "But it comes with significant drawbacks. 2D projections are just not capable of describing all the features of 3D space and using them to model distributions can cause artificial structures to appear and important structures to be hidden in the projection and lost."

Among other drawbacks, all 2D projection methods, including those not described here [2], can be affected by the presence of companion stars. Binary stars – two stars which orbit one another – can interfere with measurements of the motion of the stars in a group causing smaller or less tightly bound groups to be missed when searching for them solely on the basis of their common motion. In this study, rather than project the data onto a series of 2D planes, the astronomers used the measured distances to O and B type stars in the data to map the density and position of the stars in three dimensions. The 3D data analysis and interactive visualisation techniques used in this study, combined with a lack of reliance on velocities as a discovery criterion for the stellar groups, led to several discoveries that had been missed in 25 years of 2D analysis of the data.

"Our study has shown just how different the architecture of the solar neighbourhood looks when mapped in three dimensions," explains João Alves from the University of Vienna, Austria, co-author of the paper. "We have produced a 3D visualisation of all of the Hipparcos O and B type stars within around 1500 light years of the Sun and in doing so have found evidence for new structures in the distribution of nearby hot stars, and new and surprising theories of how those stars formed."

The team found that the solar neighbourhood is dominated by three huge stream-like galactic structures made up of dense clusters and loose associations of young, blue, O and B type stars. These contain several tens of O and B type stars, most of the local well-known clusters, and some previously unreported stellar groups. The first structure runs from the constellation Scorpius to the constellation Canis Majoris covering more than 1100 light years and at least 65 million years of star formation history. The second, located in the constellation Vela, covers at least 500 light years and 30 million years of history. Although all three of the newly discovered streams have a story to tell, it is the third structure, located in the constellation Orion, that is perhaps the most significant due to its mystery-solving qualities.

The origin of the blue supergiants that define the body and belt of the Orion constellation has long been a mystery. The five giant O and B type stars are located between around 250 and 800 light years from Earth and as a result it was assumed that their origin was not, despite their name, in the prolific Orion Nebula star-forming region, which lies around 1300 light years from Earth. However, the discovery of the Orion stream offers a simple solution. It implies that these relatively distant populations are in fact linked as part of a large galactic structure, which spans more than 1000 light years and at least 25 million years of star formation history.

The origin of the body and belt are not the only answers this study might hold for the birth of the Hunter.

"One exciting find from this study relates to Betelgeuse, the red giant in the arm of Orion," remarks Bouy. "The origin of this star has always been shrouded in mystery but through this study we have uncovered a new loosely organised group – or OB association – named Taurion which we believe to be Betelgeuse's birthplace and to contain its sibling stars."

By using modern full-3D data analysis, Bouy and Alves have not only uncovered the previously unknown, they may also have identified a significant visual illusion produced by previous 2D methods. In the 19th century, British astronomer John Herschel and then American astronomer Benjamin Gould identified a 3000 light-year-long partial ring of O and B type stars in the Milky Way. This belt, projected on the sky, was thought to be a grouping of stars and has come to be known as the Gould Belt – a famous and prominent structure in the Milky Way. Now, Bouy and Alves have shown that when mapped in three dimensions this model does not in fact provide a good fit for the distribution of O and B type stars, potentially disproving the existence of this galactic icon and calling for a new interpretation of stellar groups in the solar neighbourhood.

"The Gould Belt is the perfect example of how 2D projections can deceive astronomers," argues Alves. "Our results imply that it is just a projection effect produced by the Sun's position between two of the streams of stars, rather than representing the architecture of the solar neighbourhood itself."

The results published in this study include caveats and possible sources of error in part due to the extinction in the Hipparcos data, in other words the amount of light that was absorbed and scattered by dust on its way to the telescope, compromising the quality of the data. The study is also biased towards young stars, due to its focus on O and B type stars, and dense stellar groups. Despite this, the results show that our current models of the solar neighbourhood are not sufficient to uncover the true structure of how its stellar inhabitants are distributed or trace the history of their formation and evolution, there is significantly more to learn about our local environment.

"These results show just what 3D visualisation can deliver, and how much further it can take us," explains Jos de Bruijne, ESA's Gaia system scientist, also acting as ESA liaison scientist for the Hipparcos mission. "It provides an even stronger case for focussing on the local neighbourhood and, in particular, for doing so in three dimensions. This study really raises the expectations for what the Gaia mission will produce."

Gaia was launched in 2013 with the aim of unveiling the origin and evolution of our Galaxy. It will provide measurements of the positions and velocities with respect to Earth of up to one billion stars in our Galaxy and Local Group with unprecedented accuracy and sensitivity. The three-dimensional map produced by Gaia will far outdo any current or foreseen maps of the stars in the Milky Way. It will include non-O and-B type stars and be able to identify clusters and groups not dense enough to register in the Hipparcos map.

The success of the Hipparcos study in highlighting the benefits of visualising 25-year-old data using modern visualisation methods emphasises the potential of stellar mapping in 3D and Gaia will provide the data needed to peer further into the origin, evolution and structure of our Galaxy.

An interactive tool showing the Hipparcos data represented in three dimensions is available online.


Notes

[1] Hervé Bouy and João Alves have created an interactive tool to show the distribution of O and B stars in the solar neighbourhood. A low-resolution version (quicker loading time) is available here; a high-resolution version is available here.  

[2] Astronomers also use what is called the convergent point method, a method which is responsible for identifying most of the O and B type star associations and clusters discovered so far. Whilst unrelated stars will move in random directions, those in a group will move towards a convergence point where the paths of all its members will intersect.


More Information

"Cosmography of OB stars in the solar neighbourhood" by H. Bouy and J. Alves is published in Astronomy & Astrophysics, November 2015.

ESA's Hipparcos space astrometry mission was a pioneering European project which pinpointed the three-dimensional positions of more than one hundred thousand stars with high precision, and more than one million stars with lesser precision. Launched in August 1989, Hipparcos successfully observed the celestial sphere for 3.5 years before operations ceased in March 1993. Calculations from observations by the main instrument generated the Hipparcos Catalogue of 118 218 stars charted with the highest precision. An auxiliary star mapper pinpointed many more stars with lesser but still unprecedented accuracy, in the Tycho Catalogue of 1 058 332 stars. The Tycho 2 Catalogue, completed in 2000, brings the total to 2 539 913 stars, and includes 99 per cent of all stars down to magnitude 11, almost 100 000 times fainter than the brightest star, Sirius.

Gaia is an ESA mission to survey one billion stars in our Galaxy and local galactic neighbourhood in order to build the most precise 3D map of the Milky Way and answer questions about its origin and evolution. Launched in December 2013, Gaia's routine science operations began in July 2014. The mission's primary scientific product will be a catalogue with the positions, motions, brightnesses, and colours of the surveyed stars. An intermediate version of the catalogue will be released in 2016.


Contacts

Herve Bouy
Center for Astrobiology (CSIC-INTA), Spain
Email: hbouy@cab.inta-csic.es
Phone: +34 622 27 1401

João Alves
University of Vienna, Austria
Email: joao.alves@univie.ac.at
Phone: +43 1 4277 53810

Jos de Bruijne
ESA liaison scientist for Hipparcos
Scientific Support Office
Directorate of Science and Robotic Exploration
ESA, The Netherlands
Email: jdbruijne@cosmos.esa.int
Phone: + 31 71 565 5989

Source: ESA/HIPPARCOS

Tuesday, February 03, 2015

CAT Scan of Nearby Supernova Remnant Reveals Frothy Interior

This composite image shows two perspectives of a three-dimensional reconstruction of the Cassiopeia A supernova remnant. This new 3-D map provides the first detailed look at the distribution of stellar debris following a supernova explosion. Such 3-D reconstructions encode important information for astronomers about how massive stars actually explode. The blue-to-red colors correspond to the varying speed of the emitting gas along our line of sight. The background is a Hubble Space Telescope composite image of the supernova remnant. Credit: D. Milisavljevic (CfA) & R. Fesen (Dartmouth). Background image: NASA, ESA, and the Hubble Heritage Team. High Resolution (jpg) - Low Resolution (jpg)

A photograph of Cas A from NASA's Chandra X-ray Observatory reveals the supernova remnant's complex structure. In this representative-color image low-energy X-rays are red, medium-energy ones are green, and the highest-energy X-rays detected by Chandra are colored blue. Credit: NASA/CXC/SAO. High Resolution (jpg) - Low Resolution (jpg)


Cambridge, MA -  Cassiopeia A, or Cas A for short, is one of the most well studied supernova remnants in our galaxy. But it still holds major surprises. Harvard-Smithsonian and Dartmouth College astronomers have generated a new 3-D map of its interior using the astronomical equivalent of a CAT scan. They found that the Cas A supernova remnant is composed of a collection of about a half dozen massive cavities - or "bubbles."
"Our three-dimensional map is a rare look at the insides of an exploded star," says Dan Milisavljevic of the Harvard-Smithsonian Center for Astrophysics (CfA). This research is being published in the Jan. 30 issue of the journal Science.

About 340 years ago a massive star exploded in the constellation Cassiopeia. As the star blew itself apart, extremely hot and radioactive matter rapidly streamed outward from the star's core, mixing and churning outer debris. The complex physics behind these explosions is difficult to model, even with state-of-the-art simulations run on some of the world’s most powerful supercomputers. However, by carefully studying relatively young supernova remnants like Cas A, astronomers can investigate various key processes that drive these titanic stellar explosions.

"We're sort of like bomb squad investigators. We examine the debris to learn what blew up and how it blew up,” explains Milisavljevic. "Our study represents a major step forward in our understanding of how stars actually explode."

To make the 3-D map, Milisavljevic and co-author Rob Fesen of Dartmouth College examined Cas A in near-infrared wavelengths of light using the Mayall 4-meter telescope at Kitt Peak National Observatory, southwest of Tucson, AZ. Spectroscopy allowed them to measure expansion velocities of extremely faint material in Cas A's interior, which provided the crucial third dimension.

They found that the large interior cavities appear to be connected to - and nicely explain - the previously observed large rings of debris that make up the bright and easily seen outer shell of Cas A. The two most well-defined cavities are 3 and 6 light-years in diameter, and the entire arrangement has a Swiss cheese-like structure.
The bubble-like cavities were likely created by plumes of radioactive nickel generated during the stellar explosion. Since this nickel will decay to form iron, Milisavljevic and Fesen predict that Cas A's interior bubbles should be enriched with as much as a tenth of a solar mass of iron. This enriched interior debris hasn’t been detected in previous observations, however, so next-generation telescopes may be needed to find the "missing" iron and confirm the origin of the bubbles.

The researchers have posted an interactive version of their 3-D map online at https://www.cfa.harvard.edu/~dmilisav/casa-webapp/.

Headquartered in Cambridge, Mass., the Harvard-Smithsonian Center for Astrophysics (CfA) is a joint collaboration between the Smithsonian Astrophysical Observatory and the Harvard College Observatory. CfA scientists, organized into six research divisions, study the origin, evolution and ultimate fate of the universe.

For more information, contact:

Christine Pulliam
Public Affairs Specialist
Harvard-Smithsonian Center for Astrophysics
617-495-7463
cpulliam@cfa.harvard.edu

Monday, October 20, 2014

'CT Scan' of Distant Universe Reveals Cosmic Web in 3D

Figure 1: 3D map of the cosmic web at a distance of 10.8 billion light years from Earth. The map was generated from imprints of hydrogen gas observed in the spectrum of 24 background galaxies, which are located behind the volume being mapped. This is the first time that large-scale structures in such a distant part of the Universe have been mapped directly. The coloring represents the density of hydrogen gas tracing the cosmic web, with brighter colors representing higher density. Credit: Casey Stark (UC Berkeley) and Khee-Gan Lee (MPIA).  Larger version for download

Figure 2: Close-up of 3D map of the distant Universe created by MPIA and UC astronomers. The filamentary structures seen in this map span distances of millions of light years, and represent the cosmic web at an earlier stage of cosmic evolution when the Universe was less than a quarter of its current age. The region of space seen here is at a distance of 10.8 billion years from Earth. The coloring represents the density of hydrogen gas tracing the cosmic web, with brighter colors representing higher density. The coloring represents the density of hydrogen gas tracing the cosmic web, with brighter colors representing higher density. Credit: Casey Stark (UC Berkeley) and Khee-Gan Lee (MPIA).  Larger version for download

Figure 3: Artist's impression illustrating the technique of Lyman-alpha tomography: as light from distant background galaxies (yellow arrows) travels through the Universe towards Earth, hydrogen gas in the foreground leaves a characteristic imprint ("absorption signature"). From this imprint, astronomers can reconstruct which clouds the light has encountered as it traverses the "cosmic web" of dark matter and gas that accounts for the biggest structures in our universe. By observing a number of background galaxies in a small patch of the sky, astronomers were able to create a 3D map of the cosmic web using a technique similar to medical computer tomography (CT) scans. The coloring represents the density of hydrogen gas tracing the cosmic web, with brighter colors representing higher density. The rendition of the cosmic web in this image is based on a supercomputer simulation of cosmic structure formation.  Credit: Khee-Gan Lee (MPIA) and Casey Stark (UC Berkeley).  Larger version for download

Figure 4: 3D map of the cosmic web at a distance of 10.8 billion years from Earth. The map was generated from imprints of hydrogen gas observed in the spectrum of 24 background galaxies, which are located behind the volume being mapped. This is the first time that large-scale structures in such a distant part of the Universe have been mapped directly. The coloring represents the density of hydrogen gas tracing the cosmic web, with brighter colors representing higher density.   Credit: Casey Stark (UC Berkeley) and Khee-Gan Lee (MPIA)

On the largest scales, matter in the Universe is arranged in a vast network of filamentary structures known as the 'cosmic web', its tangled strands spanning hundreds of millions of light years. Dark matter, which emits no light, forms the backbone of this web, which is also suffused with primordial hydrogen gas left over from the Big Bang. Galaxies like our own Milky Way are embedded inside this web, but fill only a tiny fraction of its volume.

Now a team of astronomers led by Khee-Gan Lee, a post-doc at the Max Planck Institute for Astronomy, has managed to create a three-dimensional map of a large region of the far-flung cosmic web nearly 11 billion light years away, when the Universe was just a quarter of its current age. Similar to a medical CT scan, which reconstructs a three-dimensional image of the human body from the X-rays passing through a patient, Lee and his colleagues reconstructed their map from the light of distant background galaxies passing through the cosmic web's hydrogen gas.

The use of the combined starlight of background galaxies for this purpose had been thought to be impossible with current telescopes – until Lee carried out calculations that suggested otherwise. Lee says: "I was surprised to find that existing large telescopes should already be able to collect sufficient light from these faint galaxies to map the foreground absorption, albeit at a lower resolution than would be feasible with future telescopes. Still, this would provide an unprecedented view of the cosmic web which has never been mapped at such vast distances."

Lee and his colleagues obtained observing time on one of the largest telescopes in the world: the 10m-diameter Keck I telescope at the W. M. Keck Observatory on Mauna Kea, Hawaii – but were plagued by a problem more terrestrial than cosmic. "We were pretty disappointed as the weather was terrible and we only managed to collect a few hours of good data. But judging by the data quality as it came off the telescope, it was already clear to me that the experiment was going to work," says Joseph Hennawi (MPIA), who was part of the observing team.

Although the astronomers only observed for 4 hours, the data they collected was completely unprecedented. Their absorption measurements using 24 faint background galaxies provided sufficient coverage of a small patch of the sky to be combined into a 3D map of the foreground cosmic web. A crucial element was the computer algorithm used to create the 3D map: due to the large amount of data, a naïve implementation of the map-making procedure would have required an inordinate amount of computing time. Fortunately, team members Casey Stark and Martin White (UC Berkeley and Lawrence Berkeley National Lab) devised a new fast algorithm that could create the map within minutes. "We realized we could simplify the computations by tailoring them to this particular problem, and thus use much less memory. A calculation that previously required a supercomputer now runs on a laptop", says Stark.

The resulting map of hydrogen absorption reveals a three-dimensional section of the universe 11 billions light years away – the first time the cosmic web has been mapped at such a vast distance. Since observing to such immense distances is also looking back in time, the map reveals the early stages of cosmic structure formation when the Universe was only a quarter of its current age, during an era when the galaxies were undergoing a major 'growth spurt'. The map provides a tantalizing glimpse of giant filamentary structures extending across millions of light years, and paves the way for more extensive studies that should reveal not only the structure of the cosmic web, but also details of its function – the ways that pristine gas is funneled along the web into galaxies, providing the raw material for the growth of galaxies through the formation of stars and planets.


Background information

The work described here will be published as K.G. Lee et al., "Lyα Forest Tomography from Background Galaxies: The first Megaparsec-Resolution Large-Scale Structure Map at z > 2" in the Astrophysical Journal Letters.

ADS entry of the article

The team members are Khee-Gan Lee, Joseph F. Hennawi, and Anna-Christina Eilers (Max Planck Institute for Astronomy), Casey Stark and Martin White, (UC Berkeley and Lawrence Berkeley National Laboratory), J. Xavier Prochaska (University of California at Santa Cruz, Lick Observatory), David Schlegel (Lawrence Berkeley National Laboratory), and Andreu Arinyo-i-Prats (Universitat de Barcelona).

This research received financial support from the National Geographic Society/Waitt Grants Program.


Contact

Khee-Gan Lee (first author)
Max Planck Institute for Astronomy
Heidelberg, Germany
Phone: (+49|0) 6221 –528 467
email:
lee@mpia.de

Joe Hennawi (co-author)
Max Planck Institute for Astronomy
Heidelberg, Germany
Phone: (+49|0) 6221 –528 263
email:
joe@mpia.de

Dr. Markus Pössel (public information officer)
Max Planck Institute for Astronomy
Heidelberg, Germany
Phone: (+49|0) 6221 –528 261
email:
pr@mpia.de


Tuesday, June 24, 2014

3D map shows dusty structure of the Milky Way

Detail from map at 9000 light years (3 kiloparsec). The map is coloured according to how much dust lies in each direction in the northern Milky Way. The red/brown areas are dustiest directions. Credit: Sale et al/IPHAS

A team of international astronomers has created a detailed three-dimensional map of the dusty structure of the Milky Way – the star-studded bright disc of our own galaxy – as seen from Earth’s northern hemisphere. The map will be presented by Prof Janet Drew of the University of Hertfordshire at the National Astronomy Meeting (NAM) 2014 in Portsmouth on Monday 23 June.

Dust and gas, which make up the interstellar medium (ISM), fill the space between stars in galaxies. The dust in the ISM is shaped by turbulent flows that form intricate fractal structures on scales ranging from thousands of light years down to hundreds of kilometres. Rather than measuring the dust itself to create the map, the team has used observations of more than 38 million stars to estimate how much starlight has been obscured by the ISM and thus how much dust lies in our line of sight to each star. This ‘extinction’ map derives from the newly released catalogue of the Isaac Newton Telescope Photometric H-alpha Survey of the Northern Galactic Plane (IPHAS), the first digital survey to cover the entire northern Milky Way.

"Because the Solar System is embedded in the disc of the Milky Way, our view of it is choked with dust, with the result we know less about its internal structure than we do about some external galaxies, such as M31 in Andromeda." said Drew, the Principal Investigator for the IPHAS survey. "In this Northern survey, we are mainly looking at the parts of the Galactic disc that lie outside the Sun's orbit around the Galactic Centre. This 3-D map demonstrates with greater force than existing 2-D maps that dust in the outer disc does not trace the Perseus spiral arm and other expected structures in a simple way."

The map shows how extinction builds with distance away from the Sun (typically out to 12,000 light years or more) in any part of the surveyed northern Milky Way. Detail on an angular scales 7 times finer than the angular size of the moon is captured. The fractal nature of the ISM is visible in the map, as are large-scale features, such as star-forming molecular clouds and bubbles of ionized gas around clusters of hot stars.

"We can see a number of specific features, including the Rosette Nebula and the star-forming belt in the Perseus Arm of the Milky Way," said Dr Stuart Sale, who led the team that created the map. "Our location within the Milky Way means that we can study the ISM in far greater detail than for any other galaxy. The knowledge that we gain from studying our own galaxy can subsequently be applied to others."

"IPHAS has been a major part of the Isaac Newton Telescope's programme of observation over the last decade. It is one of several ground-based surveys beginning to provide important new and very large collections of data, complementing ESA's Gaia mission as it starts its work, that are being discussed at NAM 2014. The common goal is to properly unravel the full 3-D spatial organisation of our own Galaxy" said Drew.

MEDIA CONTACTS

NAM 2014 press office landlines: +44 (0) 02392 845176, +44 (0)2392 845177, +44 (0)2392 845178

Robert Massey

Royal Astronomical Society

Mob: +44 (0)794 124 8035

Anita Heward

Royal Astronomical Society

Mob: +44 (0)7756 034 243

Keith Smith

Royal Astronomical Society

SCIENCE CONTACTS


Prof Janet Drew

IPHAS Survey PI

Centre for Astrophysics Research

University of Hertfordshire

Dr Geert Barentsen

Centre for Astrophysics Research

University of Hertfordshire

Dr Stuart Sale

Rudolf Peierls Centre for Theoretical Physics

University of Oxford

IMAGES

1. Each panel is a map coloured according to how much dust lies in each direction in the northern Milky Way, out to a fixed distance.  Maps for 3 distances (1, 2 and 3 kiloparsecs or ~3000, ~6000 and ~9000 light years) are shown, using a colour scale that trends to red/brown for the dustiest directions. Credit: Sale et al/IPHAS

2. Detail from map at 9000 light years (3 kiloparsec).  The map is coloured according to how much dust lies in each direction in the northern Milky Way. The red/brown areas are dustiest directions. Credit: Sale et al/IPHAS
https://www.ras.org.uk/images/stories/NAM/2014/Drew_3kpc_small.jpg

FURTHER INFORMATION

A 3D extinction map of the Northern Galactic Plane based on IPHAS photometry. Sale et al, MNRAS, 2014, http://arxiv.org/abs/1406.0009

Barentsen et al, MNRAS, 2014, see www.iphas.org/data.shtml
The map can be explored interactively on the IPHAS website (http://www.iphas.org/extinction/)

About IPHAS

The INT Photometric Hα Survey of the Northern Galactic Plane (IPHAS, www.iphas.org) was carried out at the Isaac Newton Telescope (INT).  IPHAS is a digital survey of the northern Milky Way in two optical/red colours and narrow-band H-alpha - a filter that picks out the most prominent line of hydrogen, the most abundant element in the Universe.  The work on this survey began in 2003 in La Palma, and only now is close enough to completion that most of the ~45000 exposures making up the survey have been uniformly calibrated.  These data are now being made available to the astronomical community as source catalogues that measure the brightness of over 200 million objects (nearly all stars) brighter than ~20th magnitude

The INT is operated on the island of La Palma by the Isaac Newton Group in the Spanish Observatorio del Roque de los Muchachos of the Instituto de Astrofisica de Canarias. All IPHAS data are processed by the Cambridge Astronomical Survey Unit, at the Institute of Astronomy in Cambridge. The bandmerged DR2 catalogue was assembled at the Centre for Astrophysics Research, University of Hertfordshire, supported by STFC grant ST/J001333/1.

NOTES FOR EDITORS

The RAS National Astronomy Meeting (NAM 2014) will bring together more than 600 astronomers, space scientists and solar physicists for a conference running from 23 to 26 June in Portsmouth. NAM 2014, the largest regular professional astronomy event in the UK, will be held in conjunction with the UK Solar Physics (UKSP), Magnetosphere Ionosphere Solar-Terrestrial physics (MIST) and UK Cosmology (UKCosmo) meetings. The conference is principally sponsored by the Royal Astronomical Society (RAS), the Science and Technology Facilities Council (STFC) and the University of Portsmouth. Meeting arrangements and a full and up to date schedule of the scientific programme can be found on the official website at http://www.nam2014.org and via Twitter @RASNAM2014

The University of Portsmouth (http://www.port.ac.uk, Twitter: @portsmouthuni ) is a top-ranking university in a student-friendly waterfront city. It’s in the top 50 universities in the UK, in The Guardian University Guide League Table 2014 and is ranked in the top 400 universities in the world, in the most recent Times Higher Education World University Rankings 2013. Research at the University of Portsmouth is varied and wide ranging, from pure science – such as the evolution of galaxies and the study of stem cells – to the most technologically applied subjects – such as computer games design. Our researchers collaborate with colleagues worldwide, and with the public, to develop new insights and make a difference to people’s lives.

The Royal Astronomical Society (RAS: http://www.ras.org.uk, Twitter: @royalastrosoc), founded in 1820, encourages and promotes the study of astronomy, solar-system science, geophysics and closely related branches of science. The RAS organises scientific meetings, publishes international research and review journals, recognizes outstanding achievements by the award of medals and prizes, maintains an extensive library, supports education through grants and outreach activities and represents UK astronomy nationally and internationally. Its more than 3800 members (Fellows), a third based overseas, include scientific researchers in universities, observatories and laboratories as well as historians of astronomy and others.

The Science and Technology Facilities Council (STFC: http://www.stfc.ac.uk, Twitter: @stfc_matters) is keeping the UK at the forefront of international science and tackling some of the most significant challenges facing society such as meeting our future energy needs, monitoring and understanding climate change, and global security. The Council has a broad science portfolio and works with the academic and industrial communities to share its expertise in materials science, space and ground-based astronomy technologies, laser science, microelectronics, wafer scale manufacturing, particle and nuclear physics, alternative energy production, radio communications and radar. It enables UK researchers to access leading international science facilities for example in the area of astronomy, the European Southern Observatory.

The University of Hertfordshire (http://www.herts.ac.uk) is the UK’s leading business-facing university and an exemplar in the sector.  It is innovative and enterprising and challenges individuals and organisations to excel. The University of Hertfordshire is one of the region’s largest employers with over 2,425 staff and a turnover of over £234 million. With a student community of over 25,100 including more than 2,900 overseas students from 120 different countries, the University has a global network of over 175,000 alumni. It is also one of the top 100 universities in the world under 50 years old, according to the new Times Higher Education 100 under 50 rankings 2014.