

NGC 5813 - Cavities

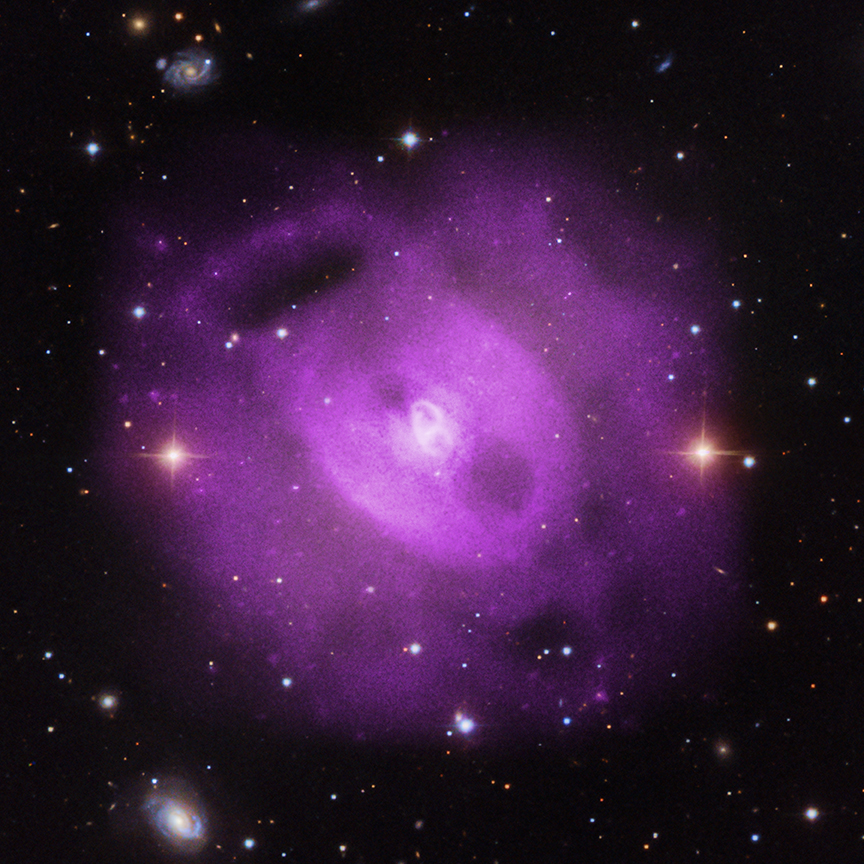
Astronomers have used NASA's Chandra X-ray Observatory to show that multiple eruptions from a supermassive black hole over 50 million years have rearranged the cosmic landscape at the center of a group of galaxies.
Scientists discovered this history of black hole eruptions by studying NGC 5813, a group of galaxies about 105 million light years
from Earth. These Chandra observations are the longest ever obtained of
a galaxy group, lasting for just over a week. The Chandra data are
shown in this new composite image where the X-rays from Chandra (purple) have been combined with visible light data (red, green and blue).
Galaxy groups are like their larger cousins, galaxy clusters,
but instead of containing hundreds or even thousands of galaxies like
clusters do, galaxy groups are typically comprised of 50 or fewer
galaxies. Like galaxy clusters, groups of galaxies are enveloped by
giant amounts of hot gas that emit X-rays.
The erupting supermassive black hole is located in the central galaxy
of NGC 5813. The black hole's spin, coupled with gas spiraling toward
the black hole, can produce a rotating, tightly wound vertical tower of
magnetic field that flings a large fraction of the inflowing gas away
from the vicinity of the black hole in an energetic, high-speed jet.
The researchers were able to determine the length of the black hole's eruptions by studying cavities,
or giant bubbles, in the multi-million degree gas in NGC 5813. These
cavities are carved out when jets from the supermassive black hole
generate shock waves that push the gas outward and create huge holes.
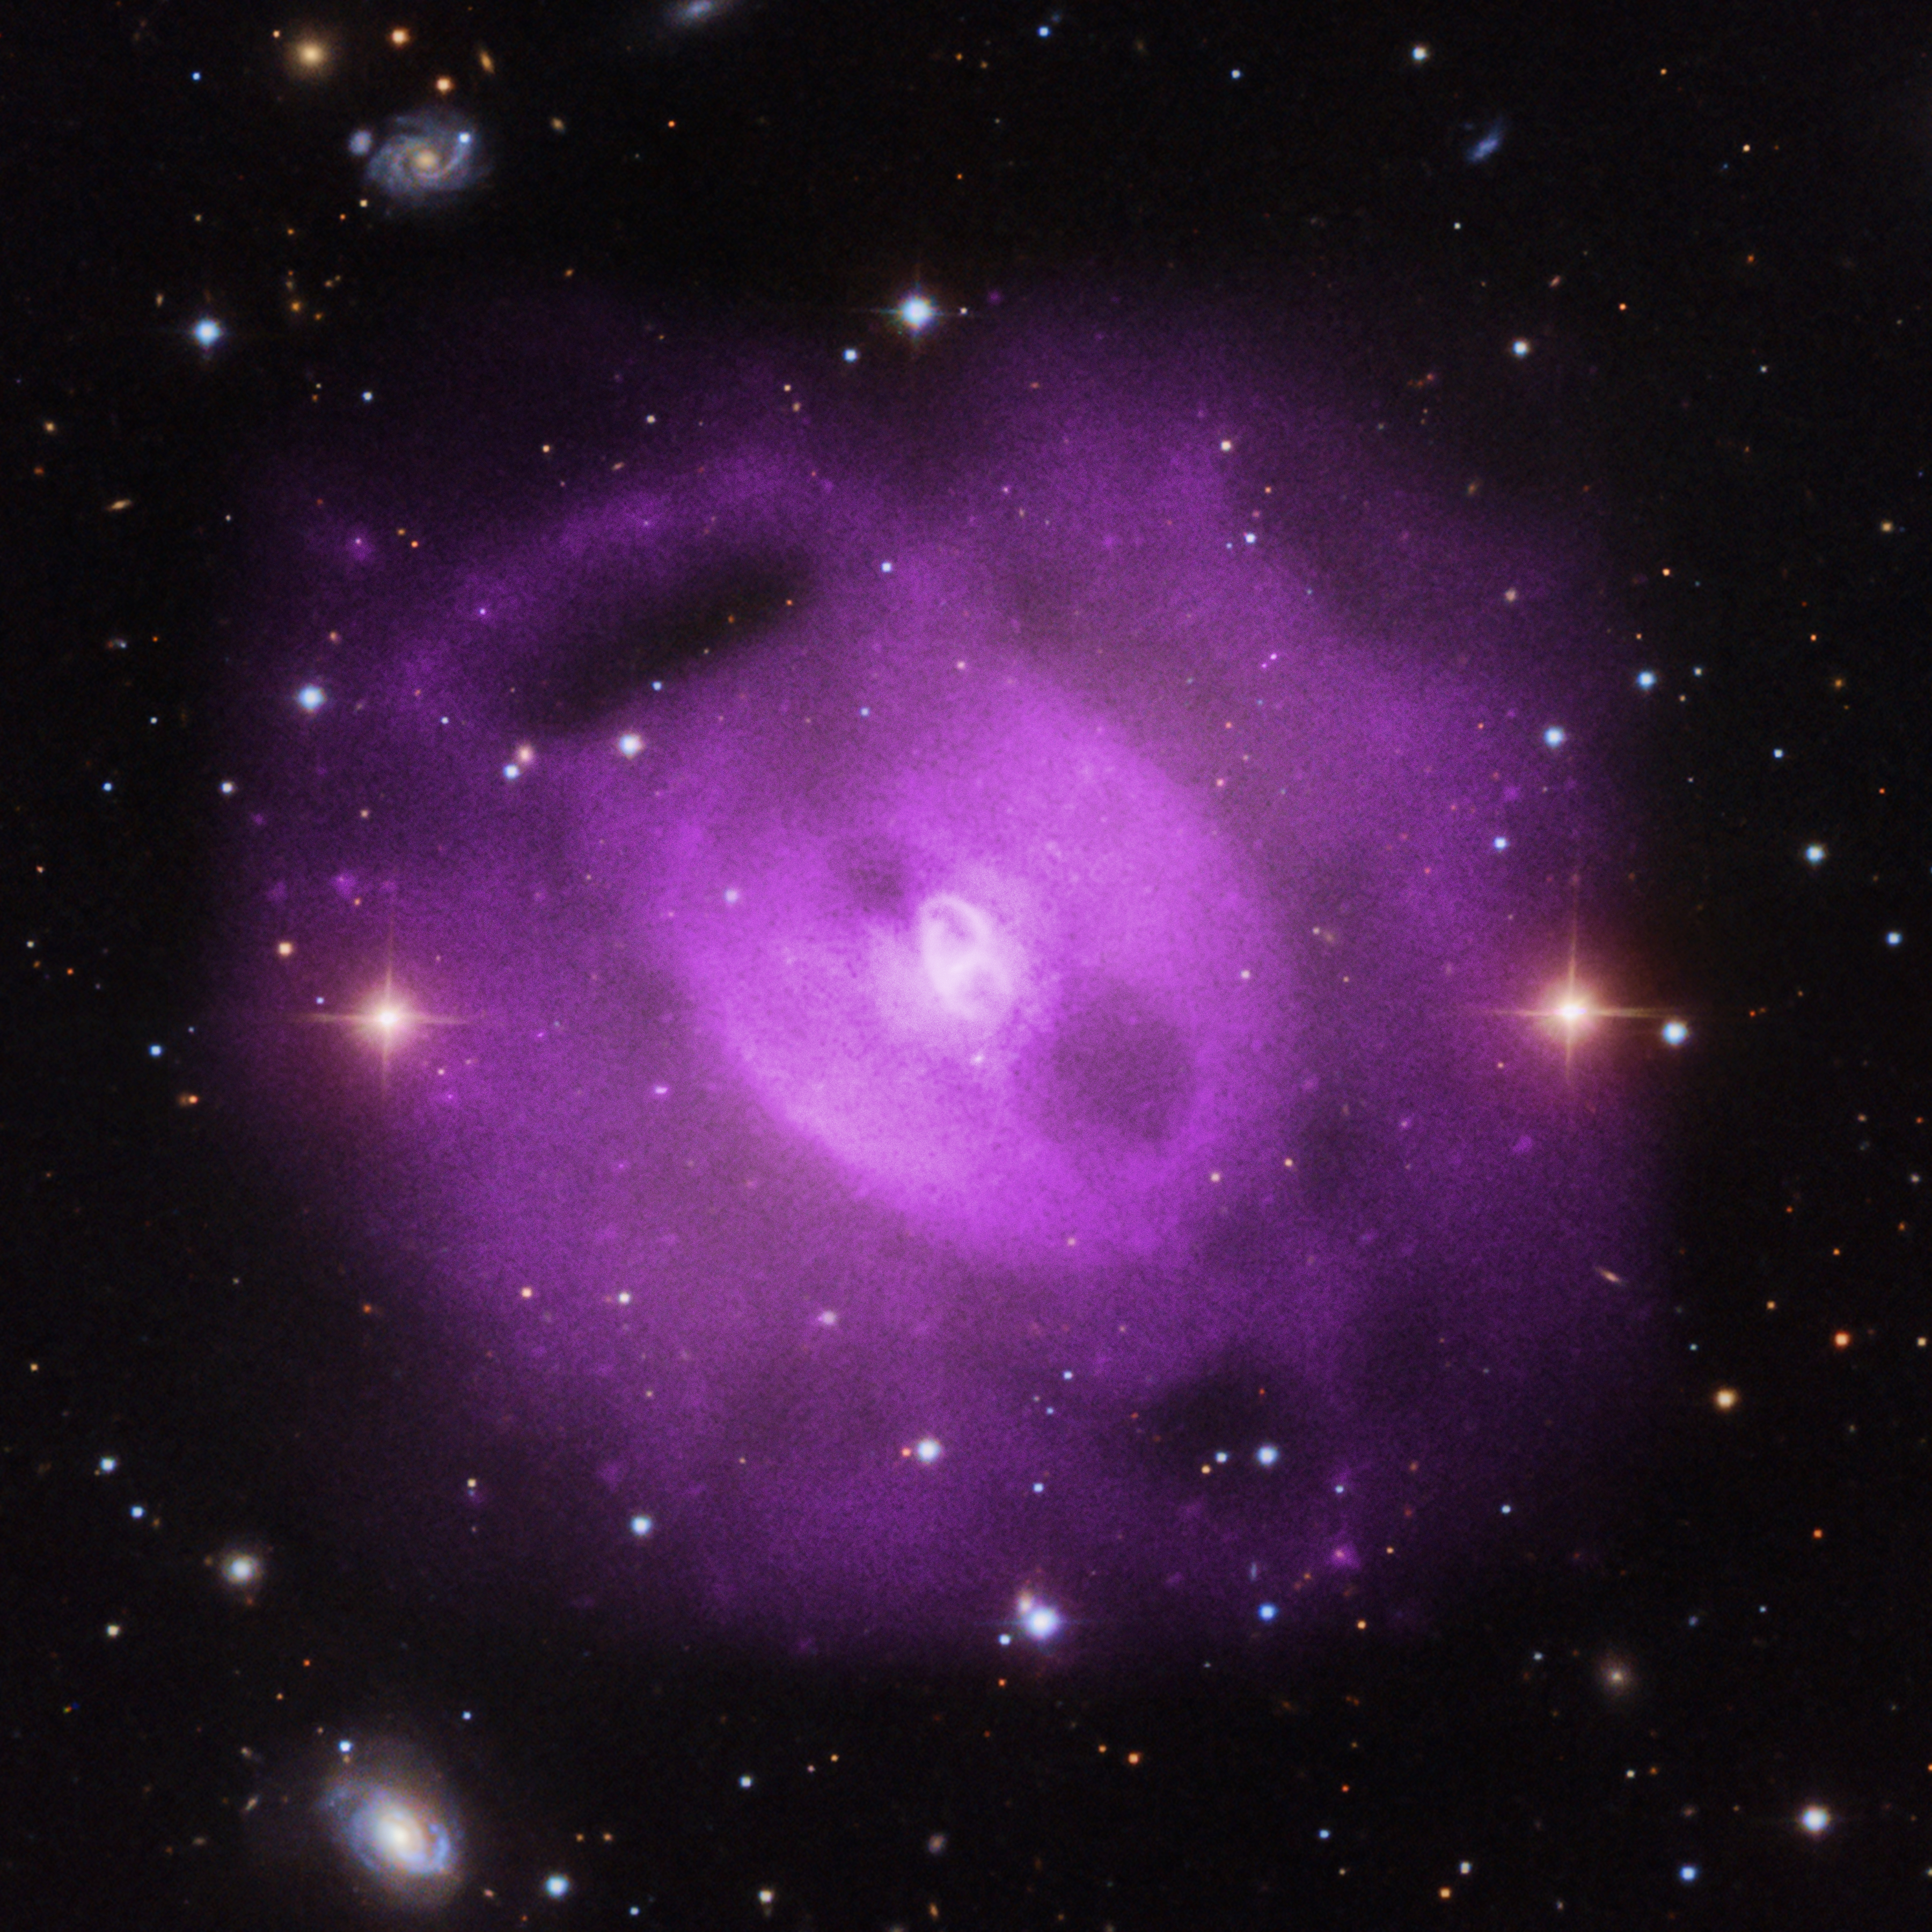
The latest Chandra observations reveal a third pair of cavities in
addition to two that were previously found in NGC 5813, representing
three distinct eruptions from the central black hole. (Mouse over the
image for annotations of the cavities.) This is the highest number of
pairs of cavities ever discovered in either a group or a cluster of
galaxies. Similar to how a low-density bubble of air will rise to the
surface in water, the giant cavities in NGC 5813 become buoyant and move
away from the black hole.
To understand more about the black hole's history of eruptions, the
researchers studied the details of the three pairs of cavities. They
found that the amount of energy required to create the pair of cavities
closest to the black hole is lower than the energy that produced the
older two pairs. However, the rate of energy production, or power, is
about the same for all three pairs. This indicates that the eruption
associated with the inner pair of cavities is still occurring.
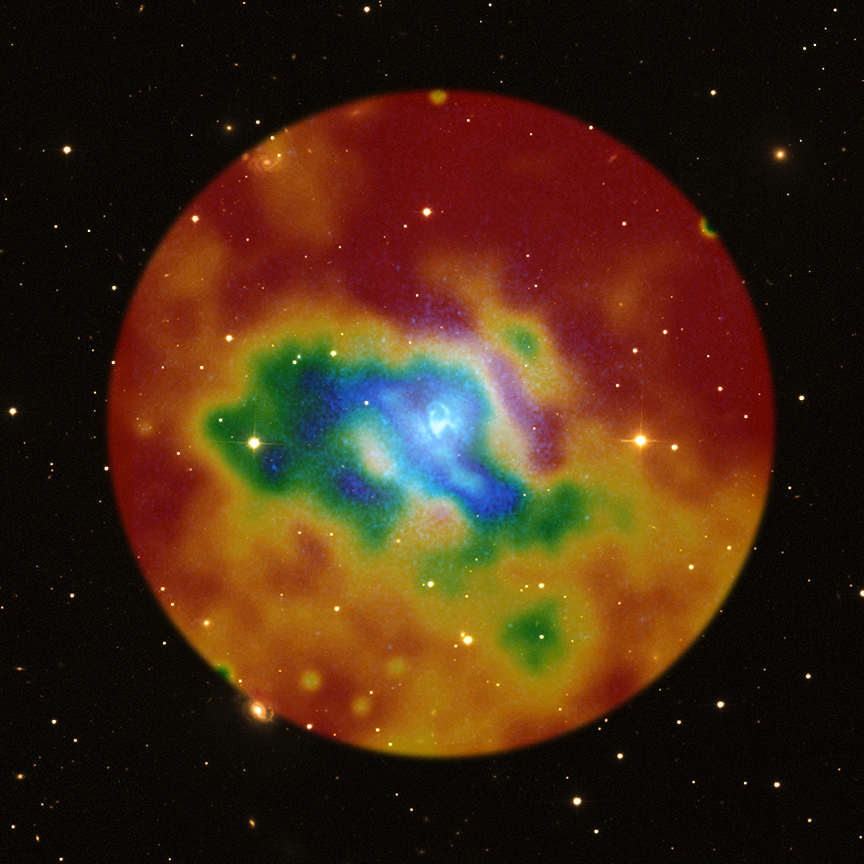
Each of the three pairs of cavities is associated with a shock front,
visible as sharp edges in the X-ray image. These shock fronts, akin to
sonic booms for a supersonic plane, heat the gas, preventing most of it
from cooling and forming large numbers of new stars.
Close study of the shock fronts reveals that they are actually
slightly broadened, or blurred, rather than being very sharp. This may
be caused by turbulence in the hot gas. Assuming this is the case, the
authors found a turbulent velocity - that is, the average speed of
random motions of the gas - of about 160,000 miles per hour (258,000
kilometers per hour). This is consistent with the predictions of
theoretical models and estimates based on X-ray observations of the hot
gas in other groups and clusters.
A paper describing these results was published in the June 1st, 2015 issue of The Astrophysical Journal and is available online.
The first author is Scott Randall from the Harvard-Smithsonian Center
for Astrophysics (CfA) in Cambridge, MA and the co-authors are Paul
Nulsen, Christine Jones, William Forman and Esra Bulbul from CfA; Tracey
Clarke from the Naval Research Laboratory in Washington DC; Ralph Kraft
from CfA; Elizabeth Blanton from Boston University in Boston, MA;
Lawrence David from CfA; Norbert Werner from Stanford University in
Stanford, CA; Ming Sun from University of Alabama in Huntsville, AL;
Megan Donahue from Michigan State University in East Lansing, MI; Simona
Giacintucci from University of Maryland in College Park, MD and Aurora
Simionescu from the Japan Aerospace Exploration Agency in Kanagawa,
Japan.
NASA's Marshall Space Flight Center in Huntsville, Alabama, manages
the Chandra program for the agency's Science Mission Directorate in
Washington. The Smithsonian Astrophysical Observatory in Cambridge,
Massachusetts, controls Chandra's science and flight operations.
Fast Facts for NGC 5813:
Scale: Image is 8.6 arcmin across (about 260,000 light years)
Category: Groups & Clusters of Galaxies
Coordinates (J2000): RA 15h 01m 11.3s | Dec +01° 42' 07.1''
Constellation: Virgo
Observation Date: 9 pointings between Apr 2005 and Apr 2011
Observation Time: 180 hours 33 min (7 days 12 hours 33 min).
Obs. ID: 5907, 9517, 12951-12953, 13246, 13247, 13253, 13255
Instrument: ACIS
References: Randall, S. et al, 2015, ApJ, 805, 112; arXiv:1503.08205
Color Code: X-ray (Purple); Optical (Red, Green, Blue)
Distance Estimate: About 105 million light years
Source: NASA’s Chandra X-ray Observatory

