 X-ray, Optical and Temperature Map Images of NGC 5813
Credit: X-ray: NASA/CXC/SAO/S.Randall et al., Optical: SDSS
JPEG (674.6 kb) - Tiff (14.5 MB) - PS (14.8 MB) - More Images
Zoom-In (flash)
JPEG (674.6 kb) - Tiff (14.5 MB) - PS (14.8 MB) - More Images
Zoom-In (flash)
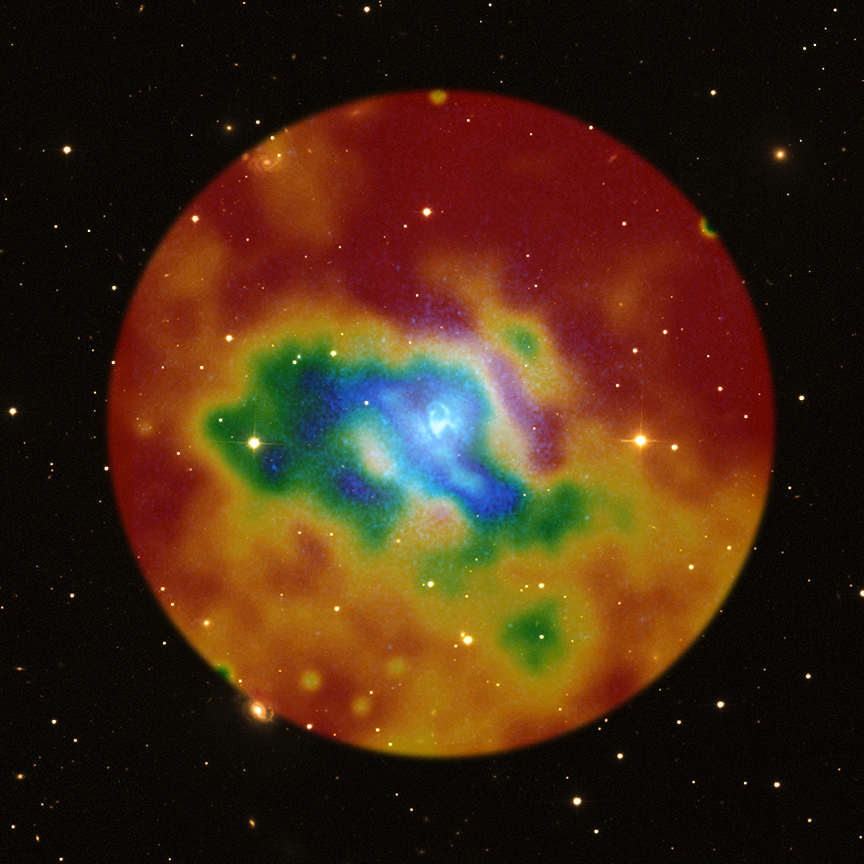
This composite image shows an intergalactic "weather map" around the elliptical galaxy NGC 5813, the dominant central galaxy in a galaxy group located about 105 million light years away from Earth. Just like a weather map for a local forecast on Earth, the colored circle depicts variations in temperature across a region. This particular map presents the range of temperature in a region of space as observed by NASA's Chandra X-ray Observatory, with the hotter temperatures shown in red and decreasingly cooler temperatures shown in orange, yellow, green, and blue. The numbers displayed when rolling your mouse over the image give the gas temperature in millions of degrees.
A notable feature of this image is the relatively small variation in temperature across the weather map, with a range of only about 30% across several hundred thousand light years. Without any sources of heat, the densest gas near the center of the map should cool to much lower temperatures as energy is lost because of radiation. However, regular outbursts generated by the supermassive black hole at the center of NGC 5813 provide heat, preventing the gas near the center of the galaxy from cooling to such low temperatures. This decreases the amount of cool gas available to form new stars. This process is analogous to the Sun providing heat for Earth's atmosphere and preventing water and water vapor from cooling and freezing.
How do outbursts generated by the black hole provide heat? Powerful jets produced as gas swirls toward the black hole push cavities into the hot gas and drive shock waves -- like sonic booms -- outwards, heating the gas. The shocks from the most recent outburst, which occurred about 3 million years ago in Earth's time frame, show up as a "figure eight" structure at the center of the image. This is the first system where the observed heating from shocks alone is sufficient to keep the gas from cooling indefinitely. These shocks allow the relatively tiny black hole to heat the huge area surrounding it, as shown here.

This Chandra image shows hot gas within and around the large elliptical galaxy NGC 5813. Cavities in the gas have been produced by powerful jets formed near the central supermassive black hole, located in the center of the image. These cavities drive shock waves - like sonic booms - outwards, heating the gas. (Credit: NASA/CXC/SAO/S.Randall et al.)
The gas around NGC 5813 shows evidence for three distinct outbursts from the black hole, which occurred 3 million, 20 million and 90 million years ago, in Earth's time frame. The average power of the two most recent outbursts differ by about a factor of six, showing that the power delivered by the jets can vary significantly over timescales of about 10 million years.
A paper describing these results has been accepted for publication in the Astrophysical Journal. The first author of the paper is Scott Randall from the Harvard-Smithsonian Center for Astrophysics (CfA) and the co-authors are Bill Forman from CfA; Simona Giacintucci from CfA and National Institute for Astrophysics (INAF) in Bologna, Italy; Paul Nulsen from CfA; Ming Sun from the University of Virginia; Christine Jones from CfA; Eugene Churazov from the Max Planck Institute for Astrophysics in Garching, Germany and the Space Research Institute in Moscow, Russia; Larry David and Ralph Kraft from CfA; Megan Donahue from Michigan State University; Elizabeth Blanton from Boston University; and Aurora Simionescu and Norbert Werner from Stanford University.
A paper describing these results has been accepted for publication in the Astrophysical Journal. The first author of the paper is Scott Randall from the Harvard-Smithsonian Center for Astrophysics (CfA) and the co-authors are Bill Forman from CfA; Simona Giacintucci from CfA and National Institute for Astrophysics (INAF) in Bologna, Italy; Paul Nulsen from CfA; Ming Sun from the University of Virginia; Christine Jones from CfA; Eugene Churazov from the Max Planck Institute for Astrophysics in Garching, Germany and the Space Research Institute in Moscow, Russia; Larry David and Ralph Kraft from CfA; Megan Donahue from Michigan State University; Elizabeth Blanton from Boston University; and Aurora Simionescu and Norbert Werner from Stanford University.
Fast Facts for NGC 5813:
Scale: Image is 12 arcmin on a side (367,000 light years)
Category: Groups & Clusters of Galaxies
Coordinates: (J2000) RA 15h 01m 11.3s | Dec +01° 42' 07.1''
Constellation: Virgo
Observation Date: Apr 2, 2005 & Jun 5, 2008
Observation Time: 41 hours 20 min
Obs. ID: 5907, 9517
Color Code: X-ray (Blue); Optical (Yellow); Temperature Map (Pseudocolor: Red, Orange, Yellow, Green, Blue)
Instrument: ACIS
References: Randall, S, et al. 2010, ApJ (in press); arXiv:1006.4379
Distance Estimate: 105 million light years