Showing posts with label SDSS-III. Show all posts

Wednesday, July 31, 2013

This is Your Galaxy: New data help astronomers explore the hidden Milky Way

Today, astronomers with the Sloan Digital Sky Survey III (SDSS-III) released a new online public data set featuring 60,000 stars that are helping to tell the story of how our Milky Way galaxy formed.

The highlight of today's "Data Release 10" is a new set of high-resolution stellar spectra — measurements of the amount of light given off by a star at each wavelength — using infrared light, invisible to human eyes but able to penetrate the veil of dust that obscures the center of the Galaxy.

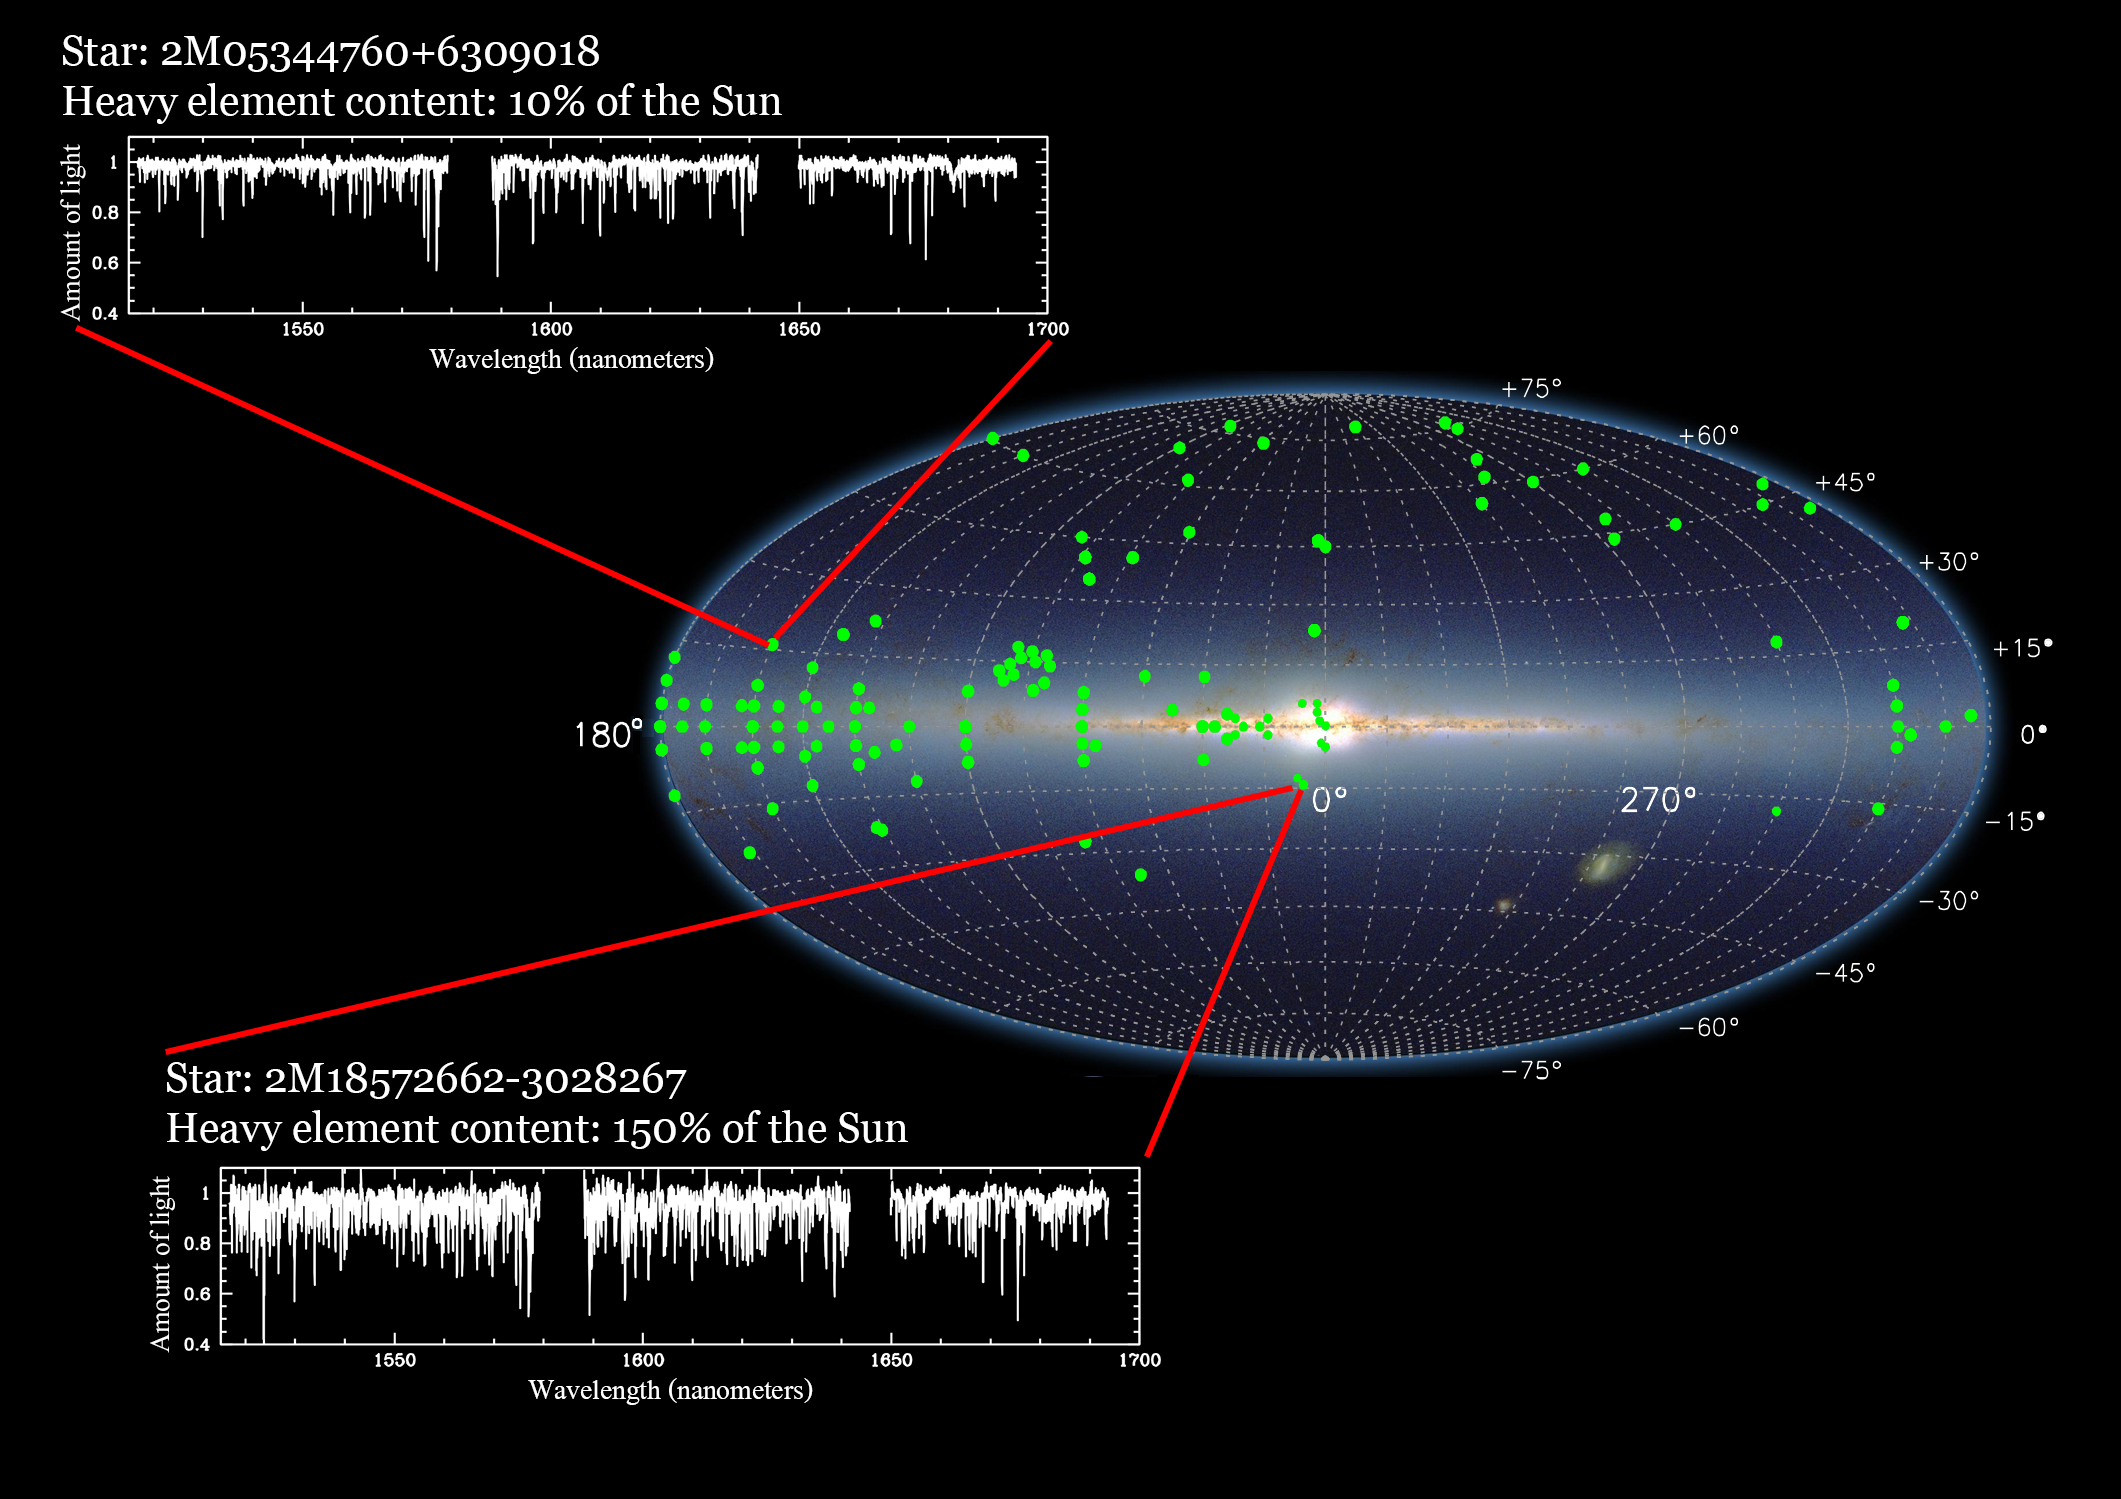
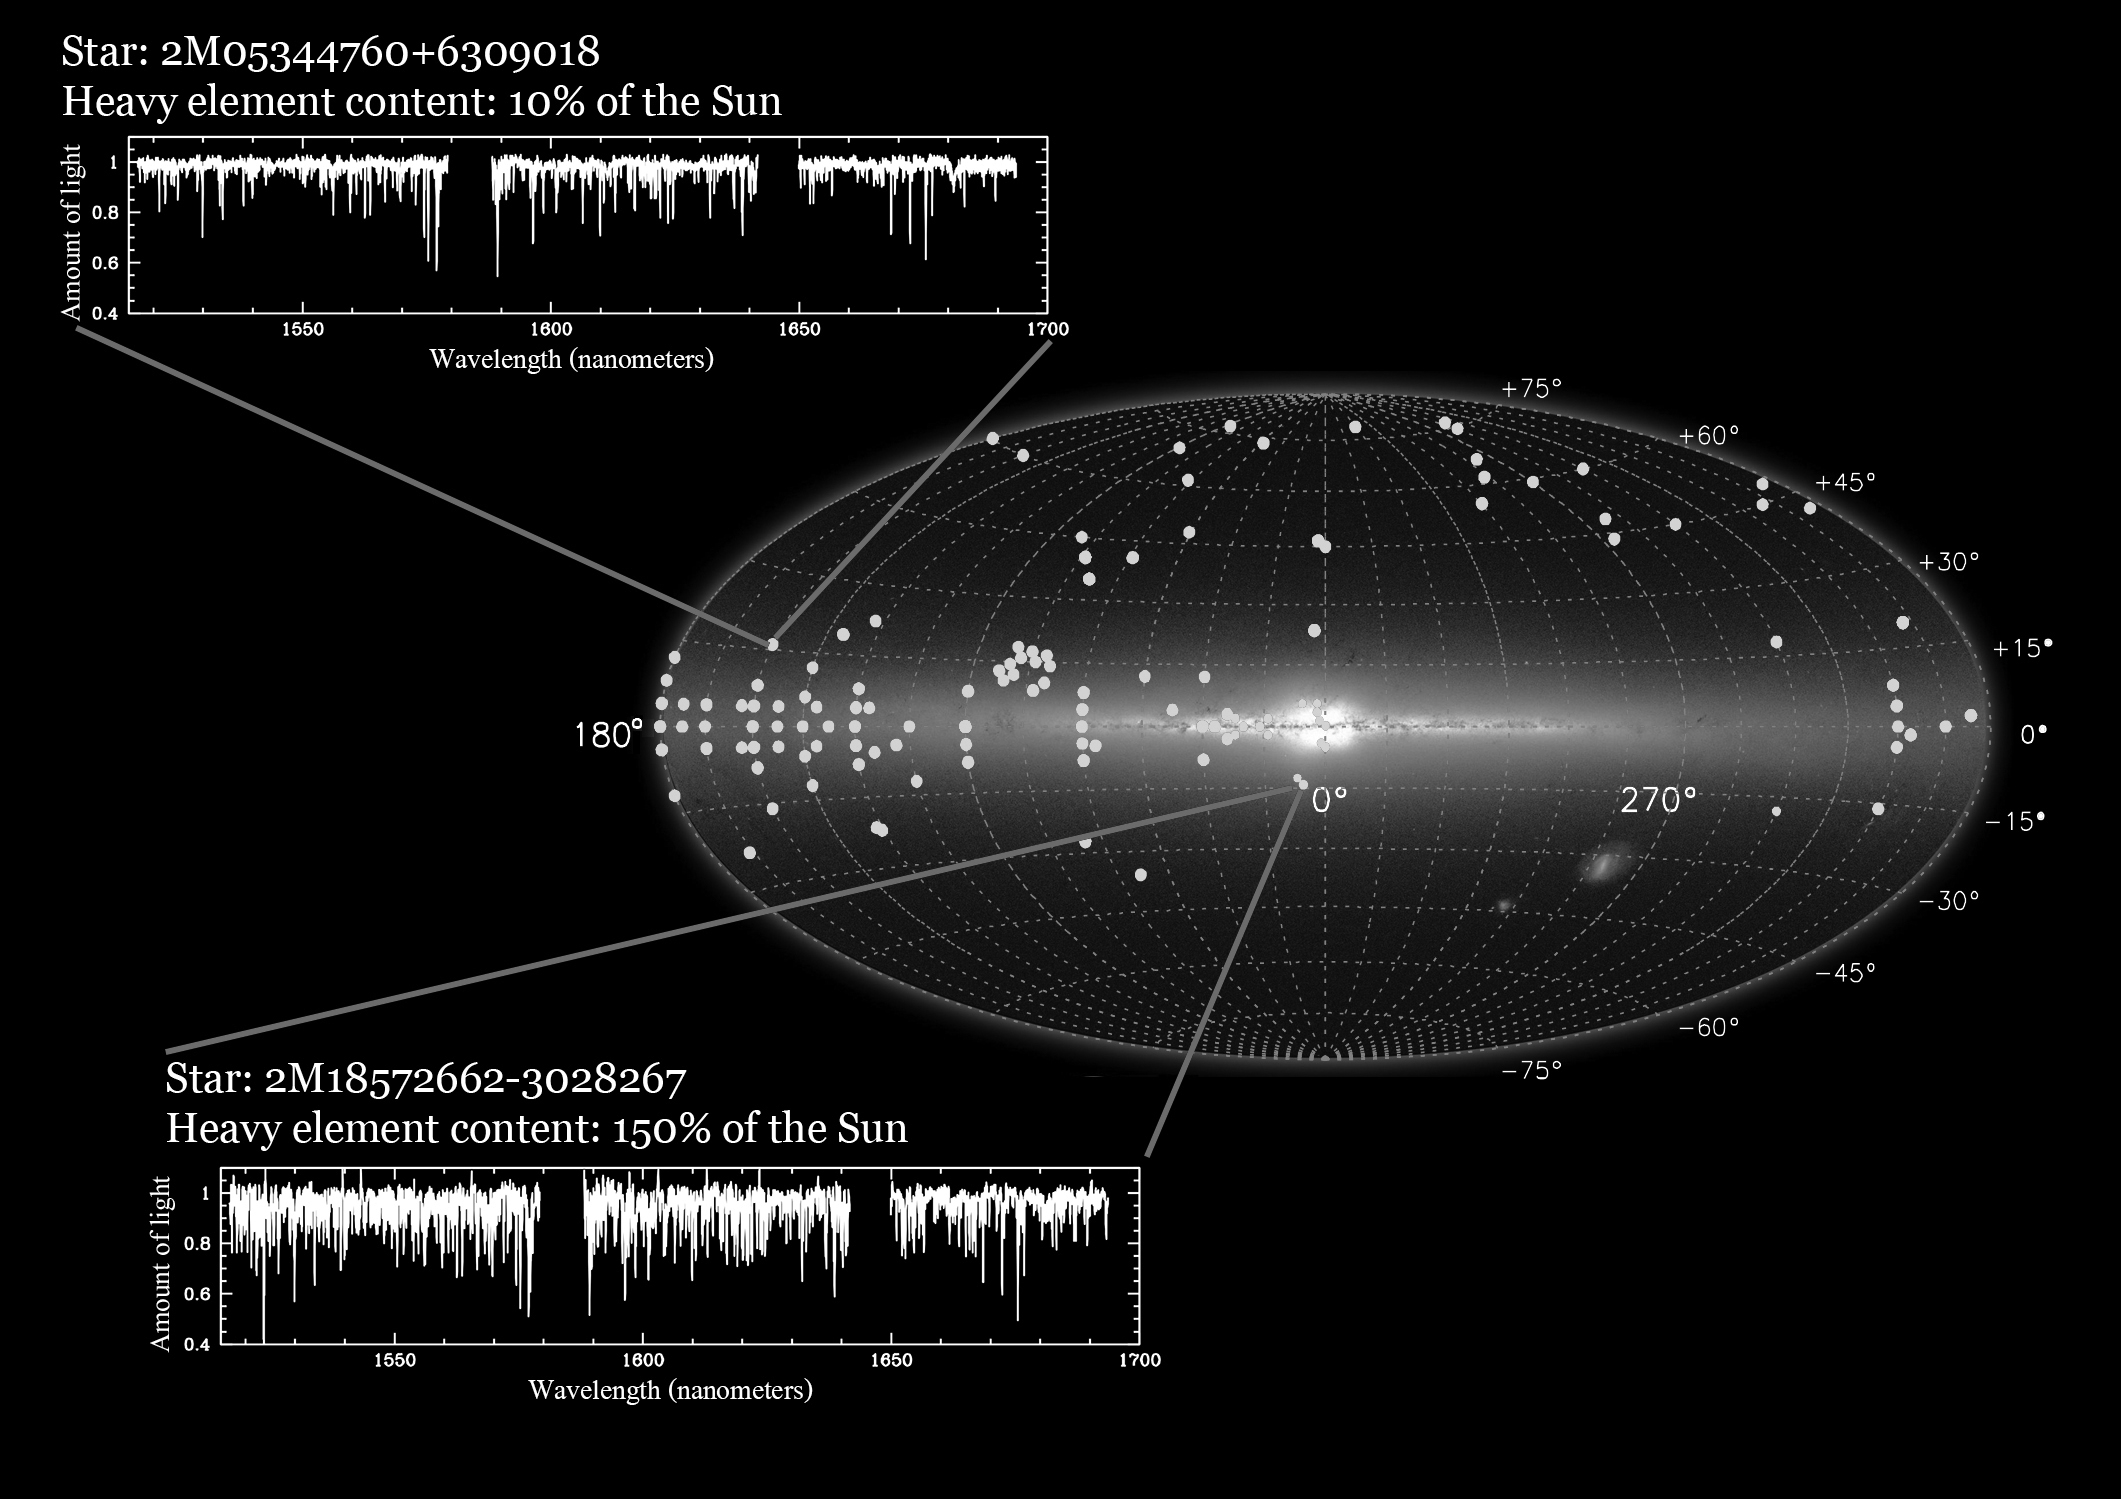
The data released today includes infrared spectra of these two stars, shown in the context of the Milky Way galaxy. 
The map shows an infrared view of the Milky Way as seen from Earth. Green circles show areas where Data Release 10 includes infrared spectroscopy data from the first year of APOGEE observations. The white boxes show the infrared spectra of two stars as seen by APOGEE; red lines show where these stars live in the Galaxy. The two spectra are from two stars: one in the galactic bulge that is rich in elements heavier than hydrogen, and one further out in the disk that has fewer such heavy elements.  
Credit: Peter Frinchaboy (Texas Christian University), Ricardo Schiavon (Liverpool John Moores University), and the SDSS-III Collaboration. Infrared sky image from 2MASS, IPAC/Caltech, and University of Massachusetts.   Other versions:    B/W  -  300 DPI color  -  300 DPI B/W 

"This is the most comprehensive collection of infrared stellar spectra ever made," said Steven Majewski of the University of Virginia, the lead scientist for the APOGEE project. "Sixty thousand stars is almost ten times more high-resolution infrared stellar spectra than have ever been measured before, by all the world's telescopes. Selected from all the different parts of our galaxy, from the nearly-empty outskirts to the dust-enshrouded center, these spectra are allowing us to peel back the curtain on the hidden Milky Way."

The new spectra are the first data released by the SDSS-III's Apache Point Observatory Galactic Evolution Experiment (APOGEE), an effort to create a comprehensive census of our Milky Way galaxy.

"A star's spectrum is a powerful tool for learning about the star — it tells us key details about the star's temperature and size, and what elements are in its atmosphere," said Jon Holtzman of New Mexico State University, who led the effort to prepare the APOGEE data for Data Release 10. "It's one of the best tools we have for learning about stars, like getting someone's fingerprints instead of just knowing their height and weight."

The question of how our Milky Way galaxy formed has been the subject of scientific speculation and debate for hundreds of years. APOGEE's three-dimensional map will provide key information for resolving central questions about how our galaxy formed over the many billions of years of its history.

The Milky Way currently has three main parts: a high-density oblong bulge in the center, the flat disk where we live, and a low-density spherical component called the "halo" extending out hundreds of thousands of light years. "Stars in these different regions have different ages and compositions, which means they formed at different times and under different conditions throughout the history of our galaxy," says Gail Zasowski, an NSF Postdoctoral Fellow at The Ohio State University who led the critical effort to maximize APOGEE's scientific potential by selecting the best possible sample of stars.

If you look up at the sky from a dark site, far away from the overwhelming glow of city lights, the Milky Way galaxy appears as a luminous band across the sky, overlaid with dark curtains. This band is the disk and bulge of our galaxy, and the curtains are the dust that blocks visible light from more distant parts of the Milky Way.

Because of this dust, previous studies of stars in the Milky Way have been limited in their ability to consistently measure stars toward the center of our galaxy. APOGEE's solution is to look in infrared light, which can pass through the dust. This ability to explore previously hidden regions of the Galaxy allows APOGEE to conduct the first comprehensive study of the Milky Way, from center to halo."

Observing tens of thousands of stars is a daunting, time-consuming task. To accomplish its goal of observing 100,000 stars in just three years, the APOGEE instrument observes up to 300 different stars at a time using fiber-optic cables plugged into a large aluminum plate with holes drilled to line up with each star. Light passes through each fiber into the APOGEE spectrograph, where a prism-like grating distributes the light by wavelength. "The grating is the first and largest of its kind deployed in an astronomy instrument," said John Wilson of the University of Virginia, who led APOGEE's instrument design team. "That technology is critical to APOGEE's success."

APOGEE's spectra of stars will help unlock the history of our galaxy, and the key is learning the compositions and motions of stars in each region. Because elements heavier than hydrogen and helium were produced in stars and spread through the Galaxy by exploding stars and stellar winds, astronomers know that stars with more of these heavy elements must have formed more recently, after previous generations of stars had time to create those heavy elements.

"By finding which parts of the Galaxy contain older versus newer stars, and by putting this together with how the stars are moving, we can write a detailed history of how the Galaxy formed, and how it evolved into what we see today," said Peter Frinchaboy of Texas Christian University, who coordinated all of the APOGEE observations.

APOGEE data also provide a rich context for investigating a wide range of questions about the stars themselves. Because APOGEE observes each target star several times, it can identify changes in each star's spectrum over time. This feature has enabled the APOGEE team to discover unusual types of rapidly variable stars, to pinpoint how many stars are actually binary stars with unseen companions, and even to detect the subtle stellar motions caused by orbiting planets.

Data Release 10 also publishes another 685,000 spectra from the SDSS-III Baryon Oscillation Spectroscopic Survey (BOSS). These new spectra come from galaxies and quasars as seen when our universe was much younger, just as the mysterious force of "dark energy" was beginning to influence the universe's expansion. The new BOSS spectra, and the additional spectra that the SDSS-III will continue to obtain in the final years of the survey, will help scientists in their quest to understand what dark energy might be.

SDSS-III is a six-year survey of nearby stars, the Milky Way galaxy, and the distant cosmos. The Sloan Foundation 2.5-meter telescope at Apache Point Observatory in New Mexico conducts observations every night that feed either the BOSS optical or APOGEE infrared spectrograph. "We've been putting out data releases since 2001, and we're not slowing down yet," said SDSS-III Spokesperson Michael Wood-Vasey of the University of Pittsburgh. "Public access to data has always been a key goal of our project, and we're proud to continue that tradition today with this new release rich with information about our own galaxy." All of these data are available to the public, free of charge, at http://www.sdss3.org/dr10.

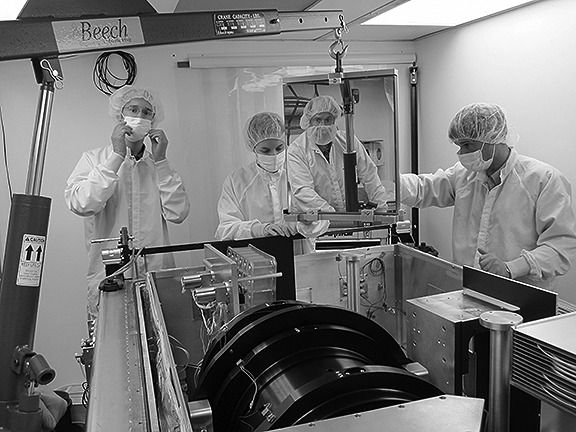
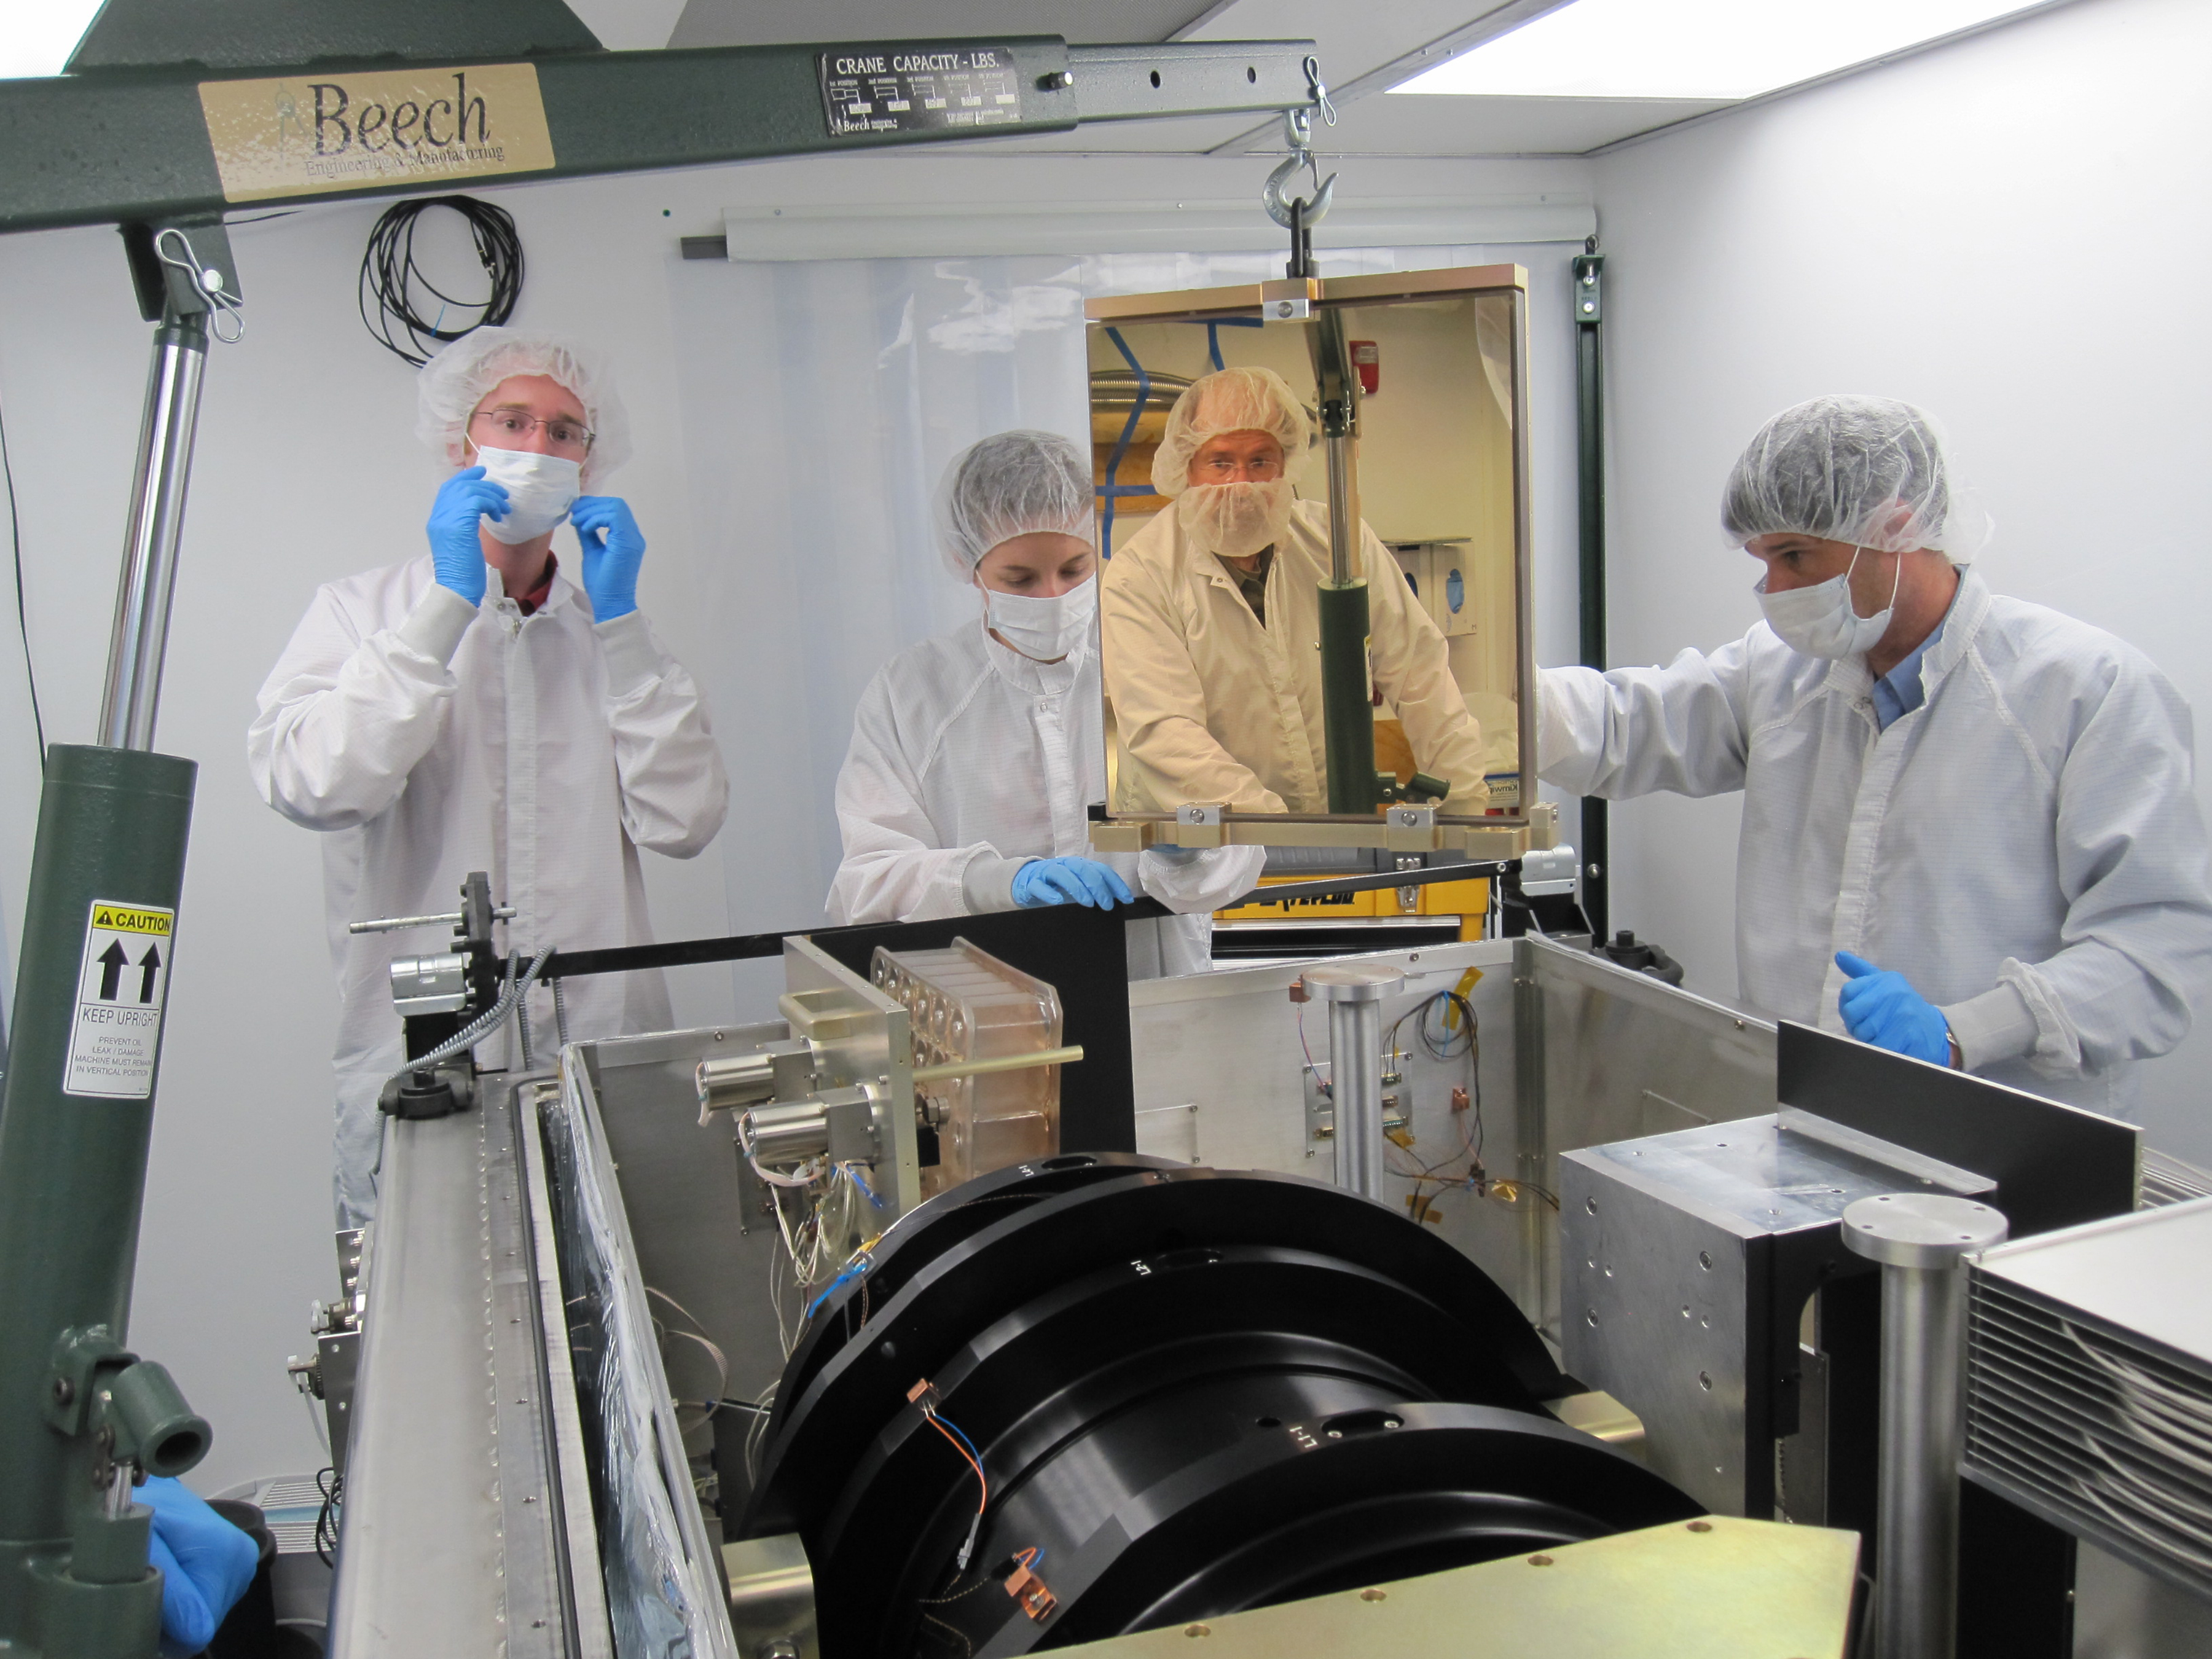
A photo of four SDSS-III scientists working on the APOGEE spectrograph.
Left to right: Garrett Ebelke (Apache Point Observatory), Gail Zasowski (The Ohio State University), Steven Majewski (University of Virginia) and John Wilson (University of Virginia). Majewski is actually standing across the room; he appears here as a reflection in a mirror that was being installed in the spectrograph.   
Credit: Dan Long (Apache Point Observatory). Other versions:    B/W  -  300 DPI color  -  300 DPI B/W

About SDSS-III

Funding for SDSS-III has been provided by the Alfred P. Sloan Foundation, the Participating Institutions, the National Science Foundation, and the U.S. Department of Energy Office of Science. The SDSS-III web site is http://www.sdss3.org .

SDSS-III is managed by the Astrophysical Research Consortium for the Participating Institutions of the SDSS-III Collaboration including the University of Arizona, the Brazilian Participation Group, Brookhaven National Laboratory, Carnegie Mellon University, University of Florida, the French Participation Group, the German Participation Group, Harvard University, the Instituto de Astrofisica de Canarias, the Michigan State/Notre Dame/JINA Participation Group, Johns Hopkins University, Lawrence Berkeley National Laboratory, Max Planck Institute for Astrophysics, Max Planck Institute for Extraterrestrial Physics, New Mexico State University, New York University, Ohio State University, Pennsylvania State University, University of Portsmouth, Princeton University, the Spanish Participation Group, University of Tokyo, University of Utah, Vanderbilt University, University of Virginia, University of Washington, and Yale University.

Contacts:

  • Steven R. Majewski, University of Virginia, srm4n@virginia.edu, 1-434-924-4893
  • Jon Holtzman, New Mexico State University, holtz@nmsu.edu, 1-575-646-8181
  • Gail Zasowski, The Ohio State University, gail.zasowski@gmail.com, 1-614-292-3099
  • John Wilson, University of Virginia, jcw6z@virginia.edu, 434-924-4907
  • Michael Wood-Vasey, SDSS-III Spokesperson, University of Pittsburgh, wmwv@pitt.edu, 1-412-624-2751
  • Jordan Raddick, SDSS-III Public Information Officer, Johns Hopkins University, raddick@jhu.edu, 1-410-516-8889

Thursday, December 20, 2012

So These Stars Orbit in a Bar...

Astronomers identify the stellar patrons of the Milky Way bar

Forget the restaurant at the end of the Universe — astronomers now have the clearest understanding yet of the bar at the center of the Milky Way.

Scientists with the Sloan Digital Sky Survey III (SDSS-III) have announced the discovery of hundreds of stars rapidly moving together in long, looping orbits around the center of our Galaxy. "The best explanation for their orbits is that these stars are part of the Milky Way bar," says David Nidever, a Dean B. McLaughin Fellow in the Astronomy Department at the University of Michigan. "We know that the bar plays an important role in determining the structure of the Galaxy, so learning more about these stars will help us understand the whole Galaxy, even out here in the spiral arms."
 
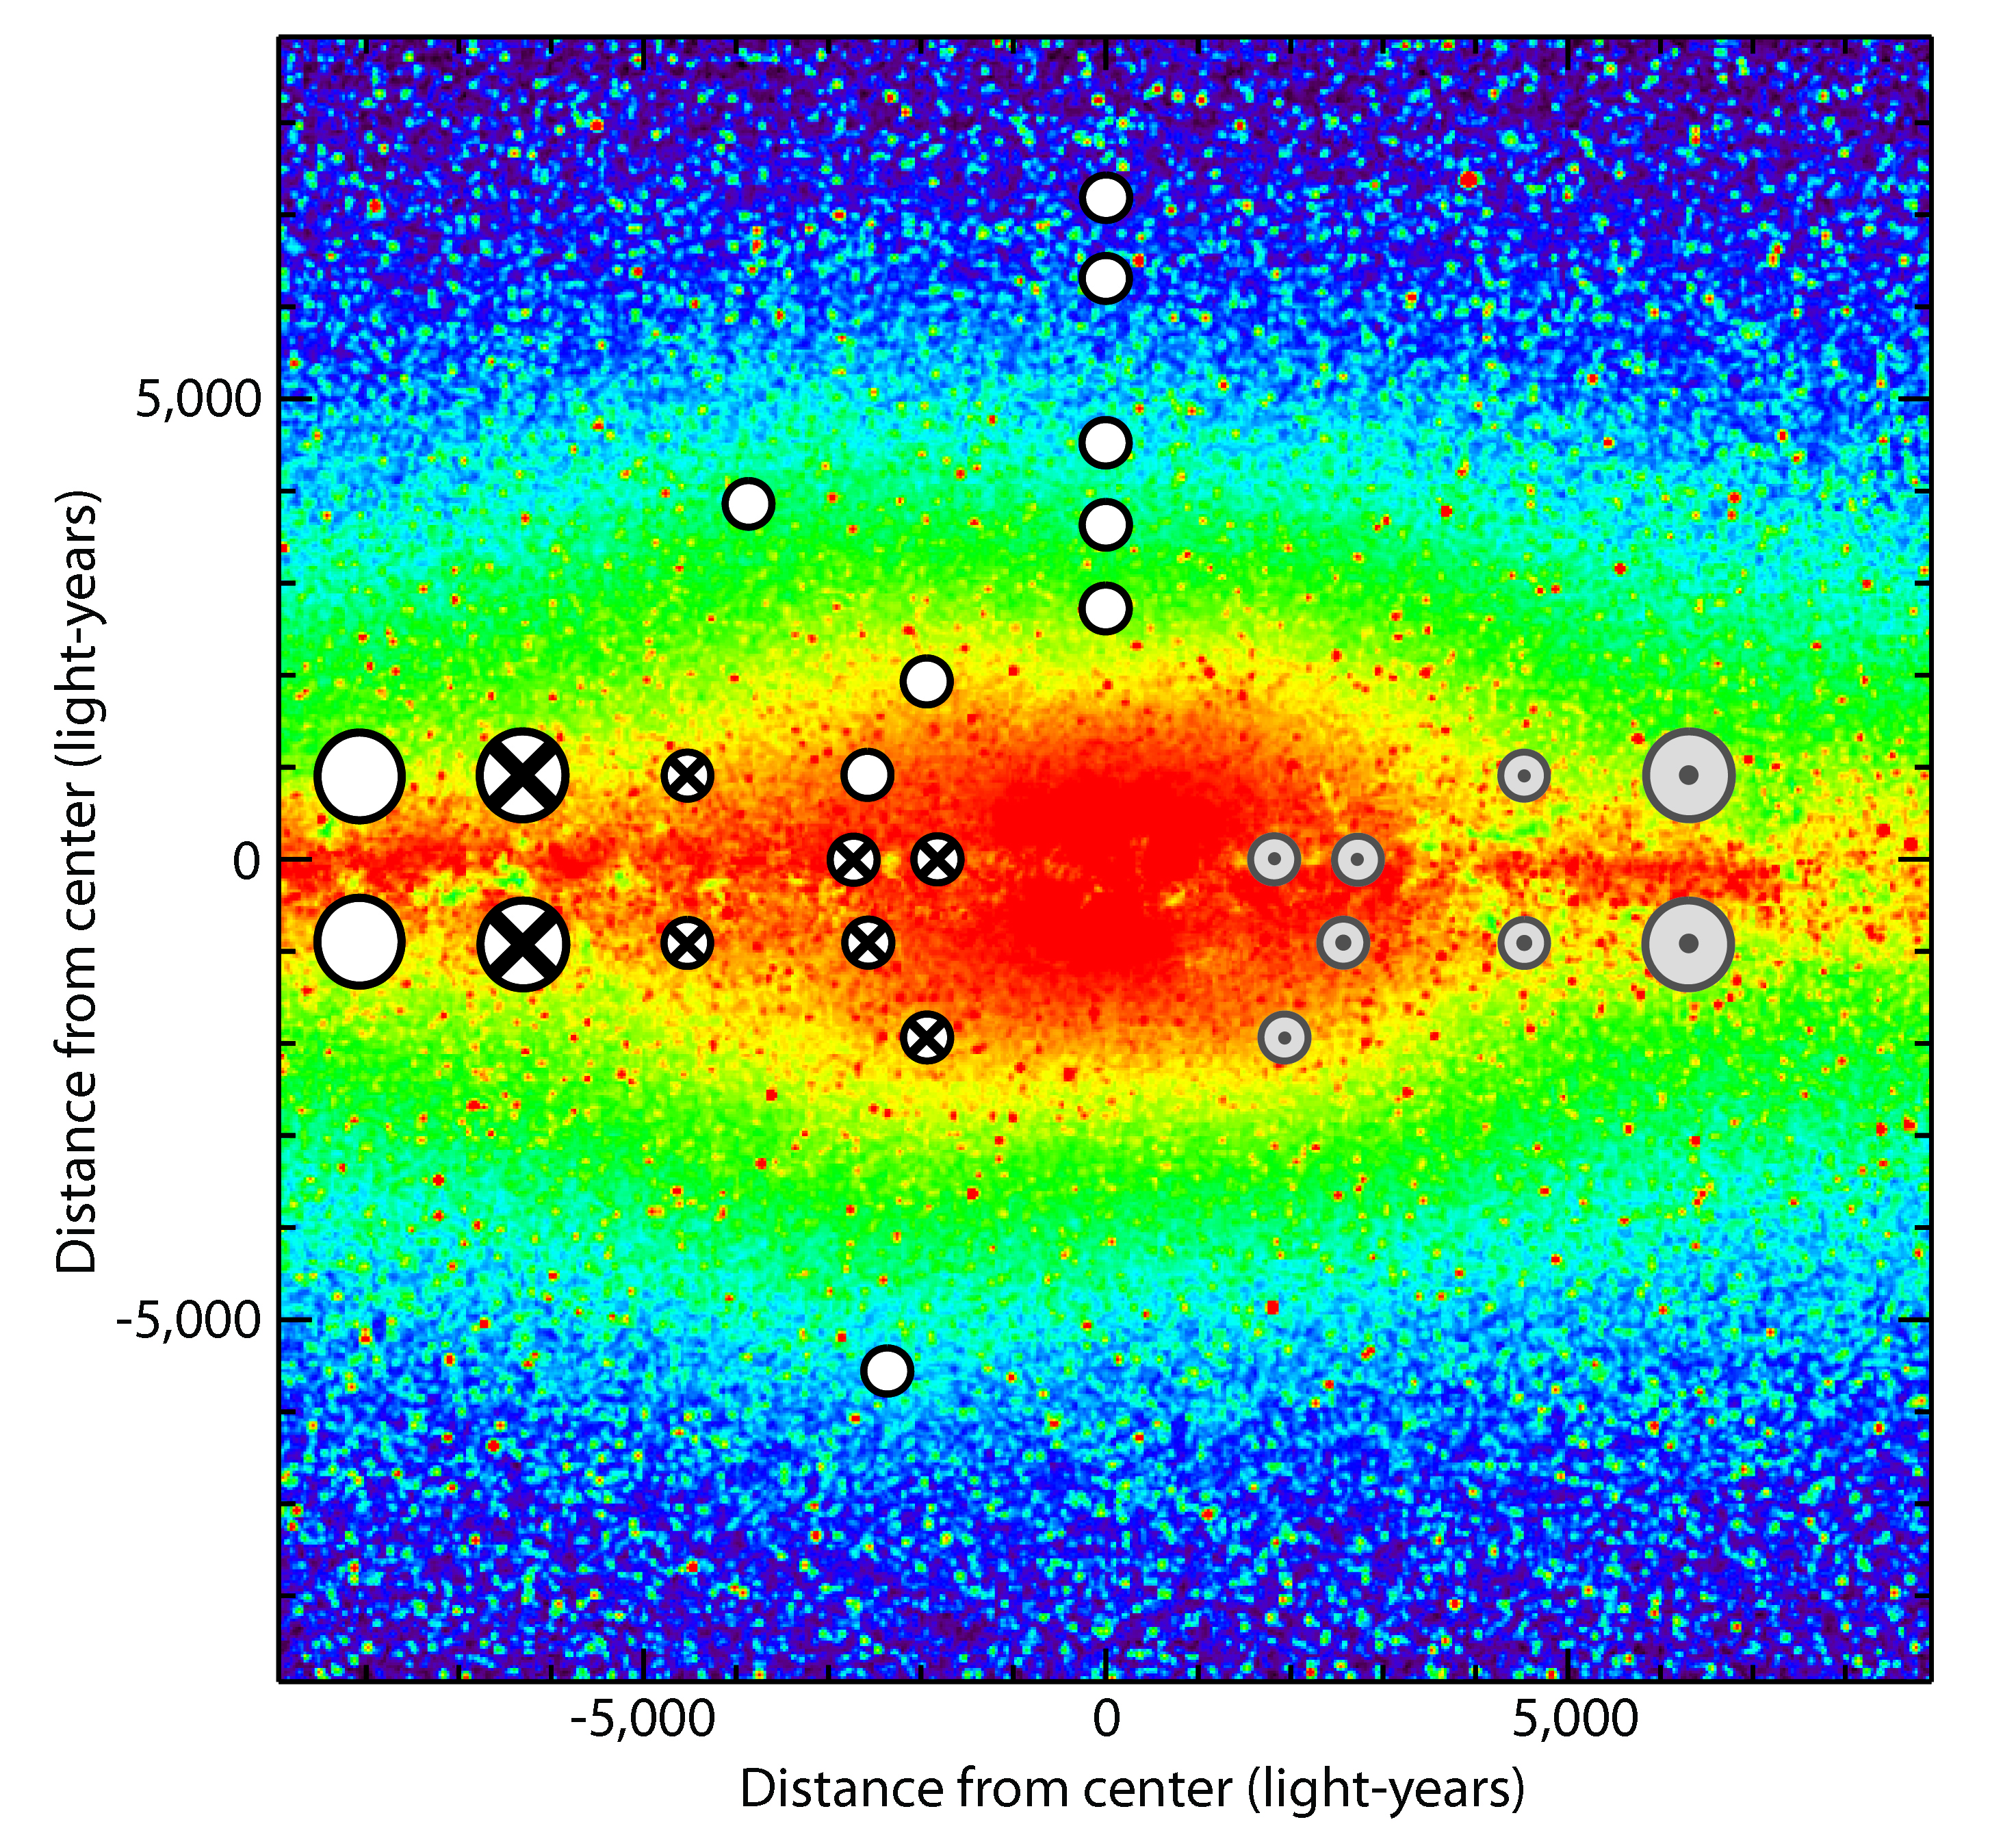
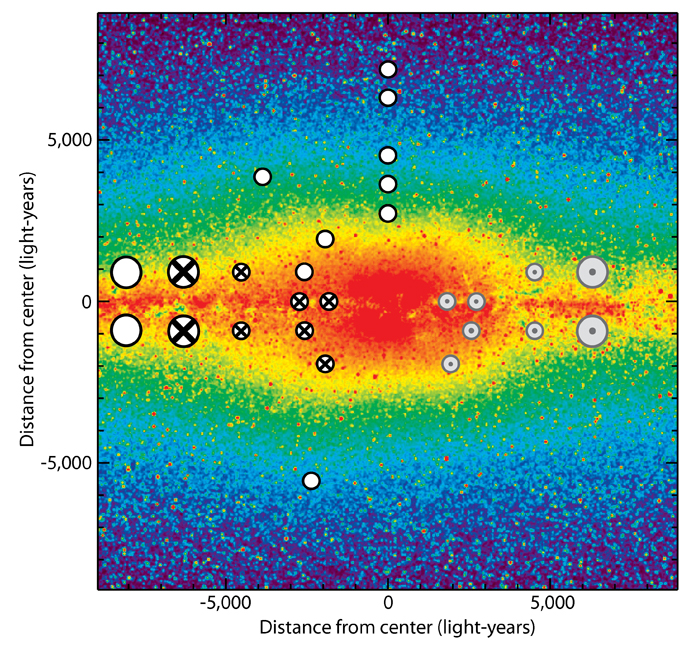
A map of the innermost Milky Way, with circles marking the regions explored by the SDSS-III APOGEE project. Circles marked with "X" show places where the project found high-speed stars associated with the Milky Way's bar moving away from Earth. The lighter regions marked with dots on the other side of the Galactic Center show places where the fourth-generation Sloan Digital Sky Survey hopes to find counterpart bar stars moving toward the Earth.

Illustration Credit: David Nidever (University of Michigan / University of Virginia) and the SDSS-III Collaboration. Background image from the
  Two-Micron All Sky Survey Image Mosaic (Infrared Processing and Analysis Center/Caltech & University of Massachusetts).
Other versions:      300 DPI color JPG
The team's discovery came from accurately measuring the speeds of thousands of stars near the center of the Milky Way. The center of our Galaxy is 30,000 light-years away — close by cosmic standards — yet we know surprisingly little about it, because the Galaxy's dusty disk hides it from view. In spite of this blind spot, though, we do know a key fact about our Galaxy: like many spiral galaxies, the Milky Way has a 'bar' of stars that orbit together around the Galactic Center.
"We know of the bar's existence from many separate lines of evidence," says Gail Zasowski, a National Science Foundation postdoctoral Fellow at The Ohio State University. "What we don't know is which stars are part of the bar, and what the velocities of those stars are. That information will help us understand how the bar formed, and how its stars relate to the stars in the rest of the Galaxy."
The trouble is that there is no obvious way to tell a star in the Milky Way's bar apart from any other star in the same neighborhood. Instead, the key to finding bar stars is to measure the velocities of many stars, then see whether some of those stars are moving together in some unusual pattern. Although interstellar dust blocks nearly all visible light, longer infrared wavelengths can partially shine through. So a survey of stellar positions and velocities that operates in infrared light could finally pierce the veil of dust, and collect data from enough stars in the innermost Milky Way to firmly identify which ones are part of the bar.
Enter SDSS-III's new Apache Point Galactic Evolution Experiment (APOGEE). APOGEE uses a custom-built high-resolution infrared spectrograph attached to the 2.5-meter Sloan Foundation Telescope in New Mexico, and is capable of measuring the velocities and chemical compositions of up to 300 stars at once. "What separates APOGEE from previous spectroscopic surveys is that we are studying the Galaxy using infrared light," Nidever says. APOGEE began observations in June 2011 and has already observed more than 48,000 stars all over our galaxy.
In a paper published recently in the Astrophysical Journal, a worldwide team of scientists including Nidever and Zasowski used data from the first few months of APOGEE observations to measure the velocities for nearly 5,000 stars near the Galactic center. With these velocity measurements, they assembled a picture of how these stars orbit the center of the Milky Way. However, quite unexpectedly, they found that a substantial fraction of stars in the inner Galaxy are moving away from us quickly — about 10 percent of the total stars in their sample are moving at more than 200 kilometers per second (400,000 miles per hour) away from the Earth. The observed pattern of these fast stars is similar in many different parts of the inner Galaxy, and is the same above and below the midplane of the Galaxy — suggesting that these measurements of fast central stars are not just a statistical fluke, but really are a feature of our Galaxy.

An artist's impression of what the Milky Way might look like viewed from above. The small blue dot is where we are on Earth (not to scale). The solid red arrows show the high-speed stars moving away from Earth that were discovered by SDSS-III. The dashed arrows show the stars moving toward Earth that are expected to be seen by the fourth-generation Sloan Digital Sky Survey.

Credit: Jordan Raddick (Johns Hopkins University) and Gail Zasowski (The Ohio State University / University of Virginia).  Milky Way artist's concept by NASA/JPL-Caltech/R. Hurt (SSC-Caltech).

Other versions:      300 DPI color JPG 

The team then compared their observations with the predictions of the bar stars from the latest computer models of the Galaxy — and the observations matched the predictions closely. "Based on the evidence from the model comparisons, I am now confident that these fast-moving stars are part of the bar," Nidever says. "I was actually quite surprised that they showed up so clearly in our survey.

APOGEE's identification of which stars are part of the bar will allow astronomers to study how stars in the bar and in the rest of the galaxy react to one another. "The bar acts like a giant mixer for our galaxy," says Steven Majewski, a professor of astronomy at the University of Virginia and the principal investigator for the APOGEE project. "As the bar rotates, it churns up the motions of nearby stars. Over time, this mixing should have a large effect on the disk of our galaxy, including in spiral arms where we live, but this effect is not well understood. This new sample of definitively-identified bar stars gives us a unique opportunity to learn more about exactly how this giant blender mixes up our galaxy."

But the team's discovery only tells half the story. So far, APOGEE has only observed one side of the bar, the side where the stars are moving away from the Earth. On the other side, the stars must be moving toward Earth. But unfortunately, the Sloan telescope is inconveniently placed: the other half of the Milky Way bar is visible only from Earth's southern hemisphere. Seeing the other side of the bar is one of the motivations for a planned fourth generation of the Sloan Digital Sky Survey. Part of this successor project will implement the same techniques using a 2.5-meter telescope in Chile to observe the rest of the inner Milky Way. The new survey is set to begin in 2014.


Paper announcing the results

D.L. Nidever, G. Zasowski, S.R. Majewski, J. Bird, A.C. Robin, I. Martinez-Valpuesta, R.L. Beaton, R. Schönrich, Ralph; M. Schultheis, J.C. Wilson, M.F. Skrutskie, R.W. O'Connell, M. Shetrone, R.P. Schiavon, J.A. Johnson, B. Weiner, O. Gerhard, D.P. Schneider, C. Allende Prieto, K. Sellgren, D. Bizyaev, H. Brewington, J. Brinkmann, D.J. Eisenstein, P.M. Frinchaboy, A.E. García Pérez, J. Holtzman, F.R. Hearty, E. Malanushenko, V. Malanushenko, D. Muna, D. Oravetz, K. Pan, A. Simmons, S. Snedden, and B.A. Weaver, 2012,
Astrophysical Journal Letters, 755(2), L25, doi:10.1088/2041-8205/755/2/L25.


About SDSS-III

Funding for SDSS-III has been provided by the Alfred P. Sloan Foundation, the Participating Institutions, the National Science Foundation, and the U.S. Department of Energy Office of Science. The SDSS-III web site is http://www.sdss3.org/.

SDSS-III is managed by the Astrophysical Research Consortium for the Participating Institutions of the SDSS-III Collaboration including the University of Arizona, the Brazilian Participation Group, Brookhaven National Laboratory, University of Cambridge, Carnegie Mellon University, University of Florida, the French Participation Group, the German Participation Group, Harvard University, the Instituto de Astrofisica de Canarias, the Michigan State/Notre Dame/JINA Participation Group, Johns Hopkins University, Lawrence Berkeley National Laboratory, Max Planck Institute for Astrophysics, Max Planck Institute for Extraterrestrial Physics, New Mexico State University, New York University, Ohio State University, Pennsylvania State University, University of Portsmouth, Princeton University, the Spanish Participation Group, University of Tokyo, University of Utah, Vanderbilt University, University of Virginia, University of Washington, and Yale University.

Contacts:
  • David Nidever, University of Michigan, dnidever -at- umich.edu, 734-615-6141
  • Gail Zasowski, The Ohio State University, gail.zasowski -at- gmail.com, 614-292-6925
  • Steven Majewski, University of Virginia, srm4n -at- virginia.edu, 434-924-4893
  •  Michael Wood-Vasey, SDSS-III Spokesperson, University of Pittsburgh, wmwv -at- pitt.edu, 412-624-2751
  • Jordan Raddick, SDSS Public Information Officer, raddick -at- jhu.edu, 410-516-8889


Tuesday, October 02, 2012

Gone, with the Wind

The case of the missing quasar gas clouds has been solved by a worldwide team of astronomers, and the answer is blowin' in the wind. 

Astronomers Nurten Filiz Ak and Niel Brandt of the Pennsylvania State University led the team, which announced their results in a paper published in today's issue of The Astrophysical Journal. The paper describes 19 distant quasars in which giant clouds of gas seemed to disappear in just a few years. 

"We know that many quasars have structures of fast-moving gas caught up in 'quasar winds,' and now we know that those structures can regularly disappear from view," says Filiz Ak, a graduate student at Penn State and lead author of the paper. "But why is this happening?" 


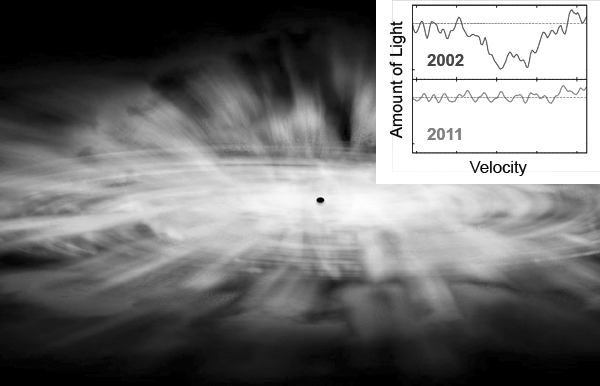
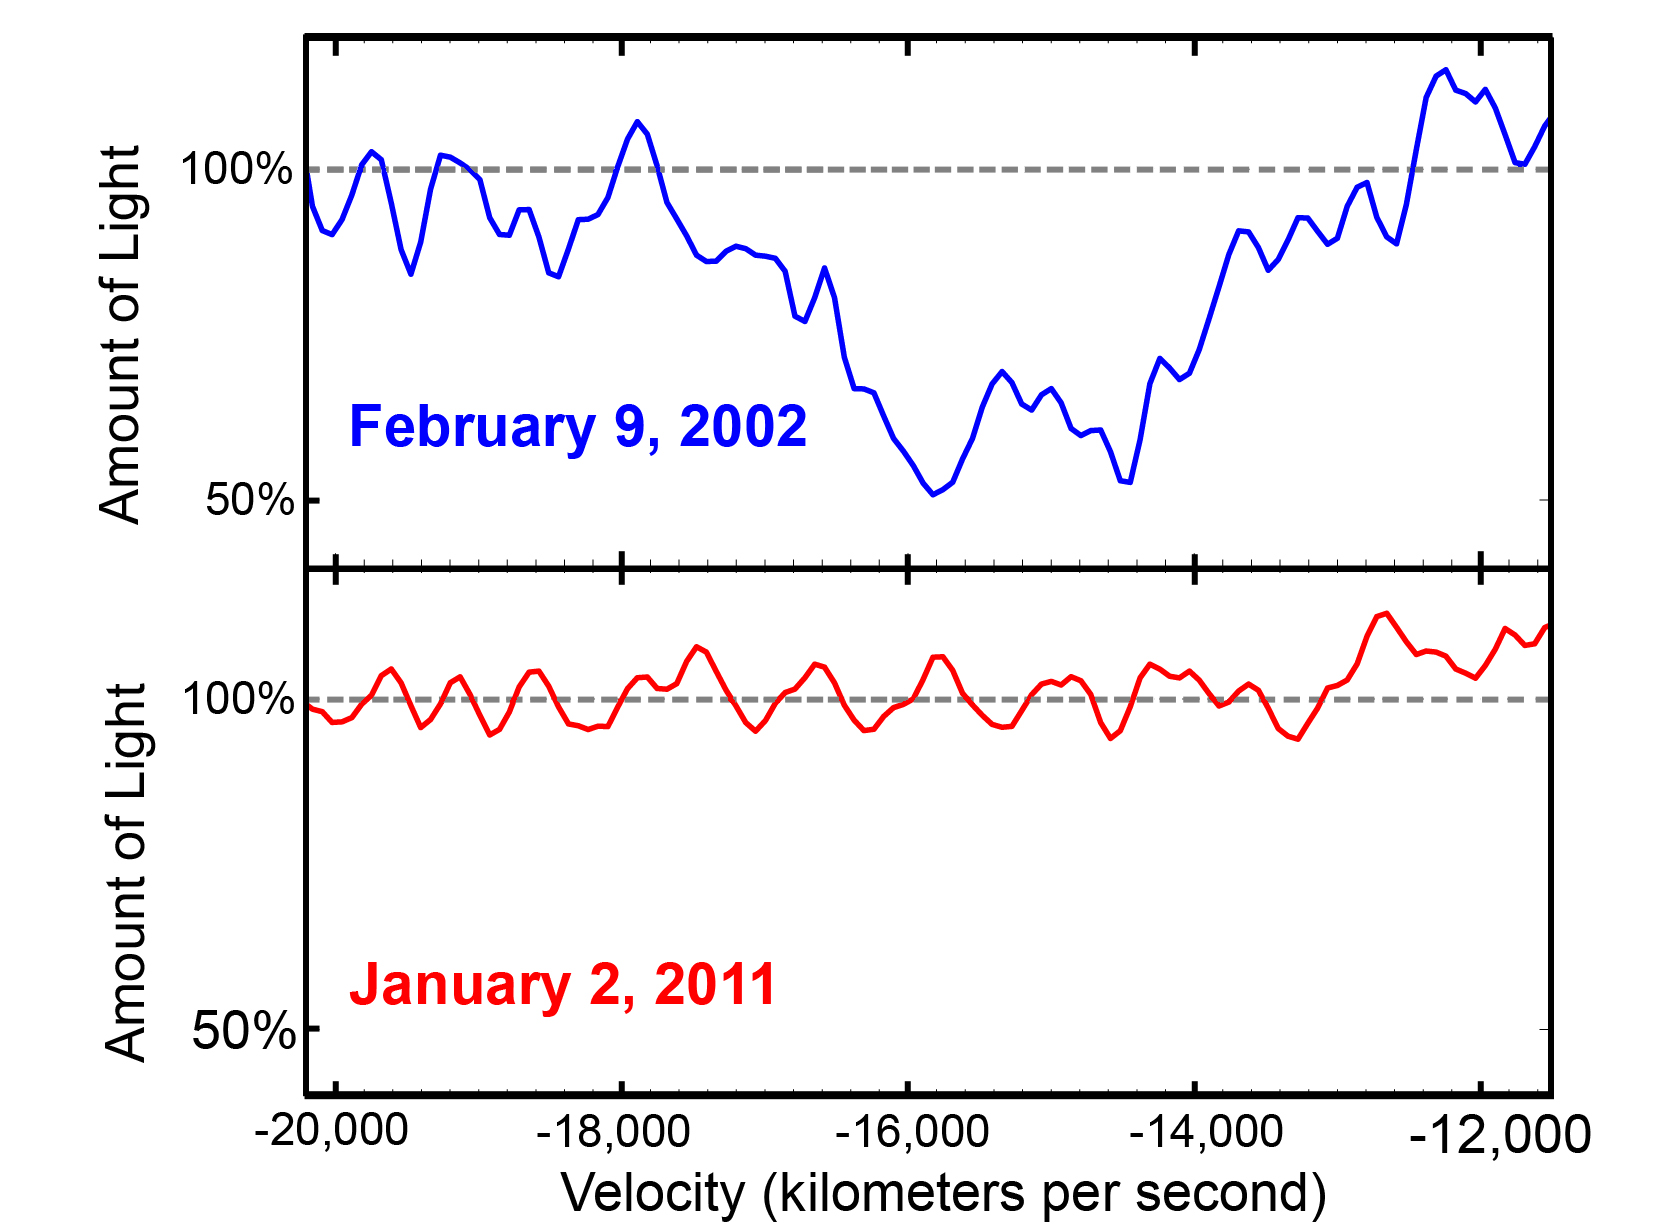
 An artist's impression of a quasar like one of the nineteen found by this study. The black dot in the center represents the supermassive black hole at the center of the quasar. The red-and-yellow spiral surrounding it shows the accretion disk of hot gas falling into the black hole. Some of this gas is ejected as the quasar's wind, which is shown in light blue. The size of the accretion disk shown is comparable to the size of our Solar System. The inset at the top right shows two SDSS spectra for the same quasar (named SDSS J093620.52+004649.2). The upper spectrum (blue) was taken in 2002, while the lower spectrum (red) was taken in 2011. The deep, wide valley in the 2002 spectrum is a so-called "broad absorption line" — a feature which has disappeared from its spectrum by 2011. Credit: NASA/CXC/M. Weiss, Nahks Tr'Ehnl, Nurten Filiz Ak .

Other versions:  B/W  -  300 DPI color TIFF  -  300 DPI B/W TIFF


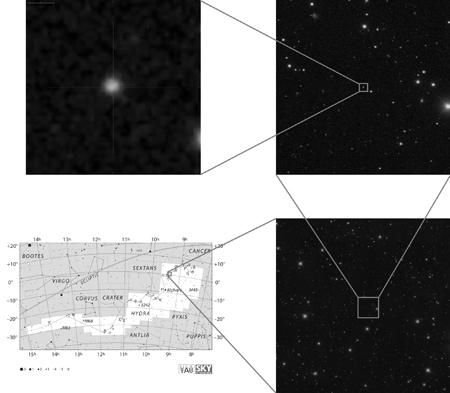
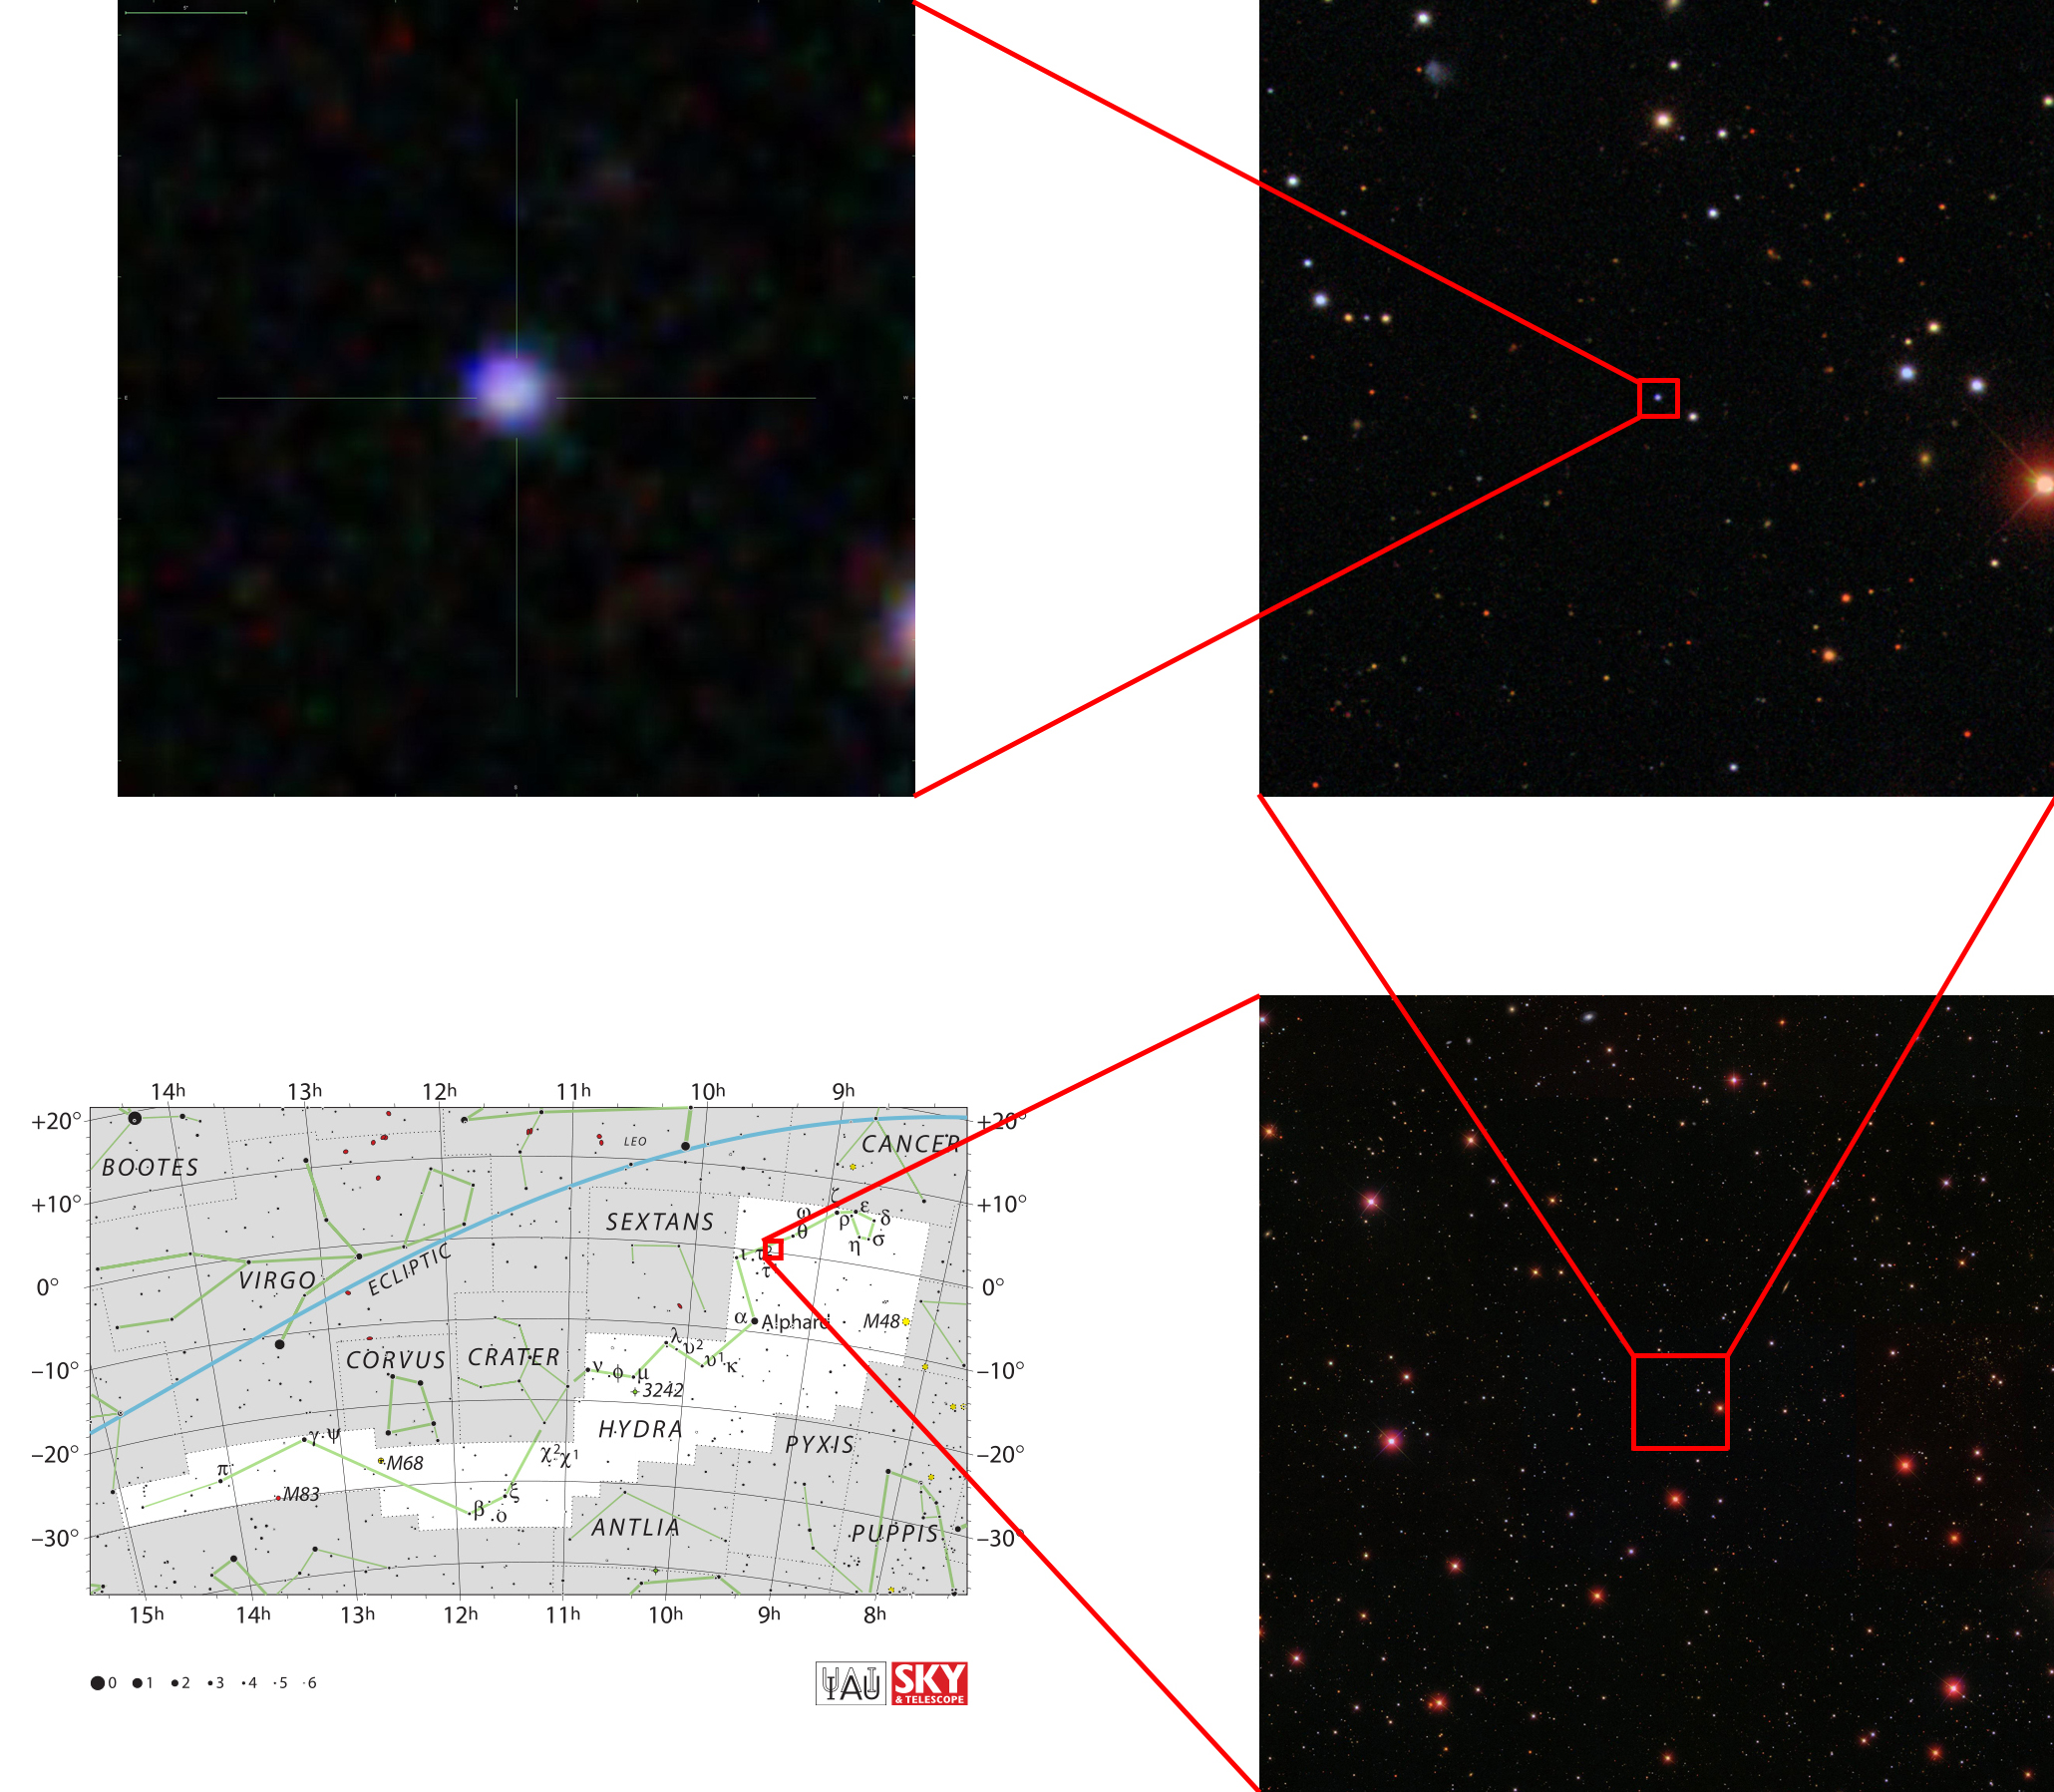
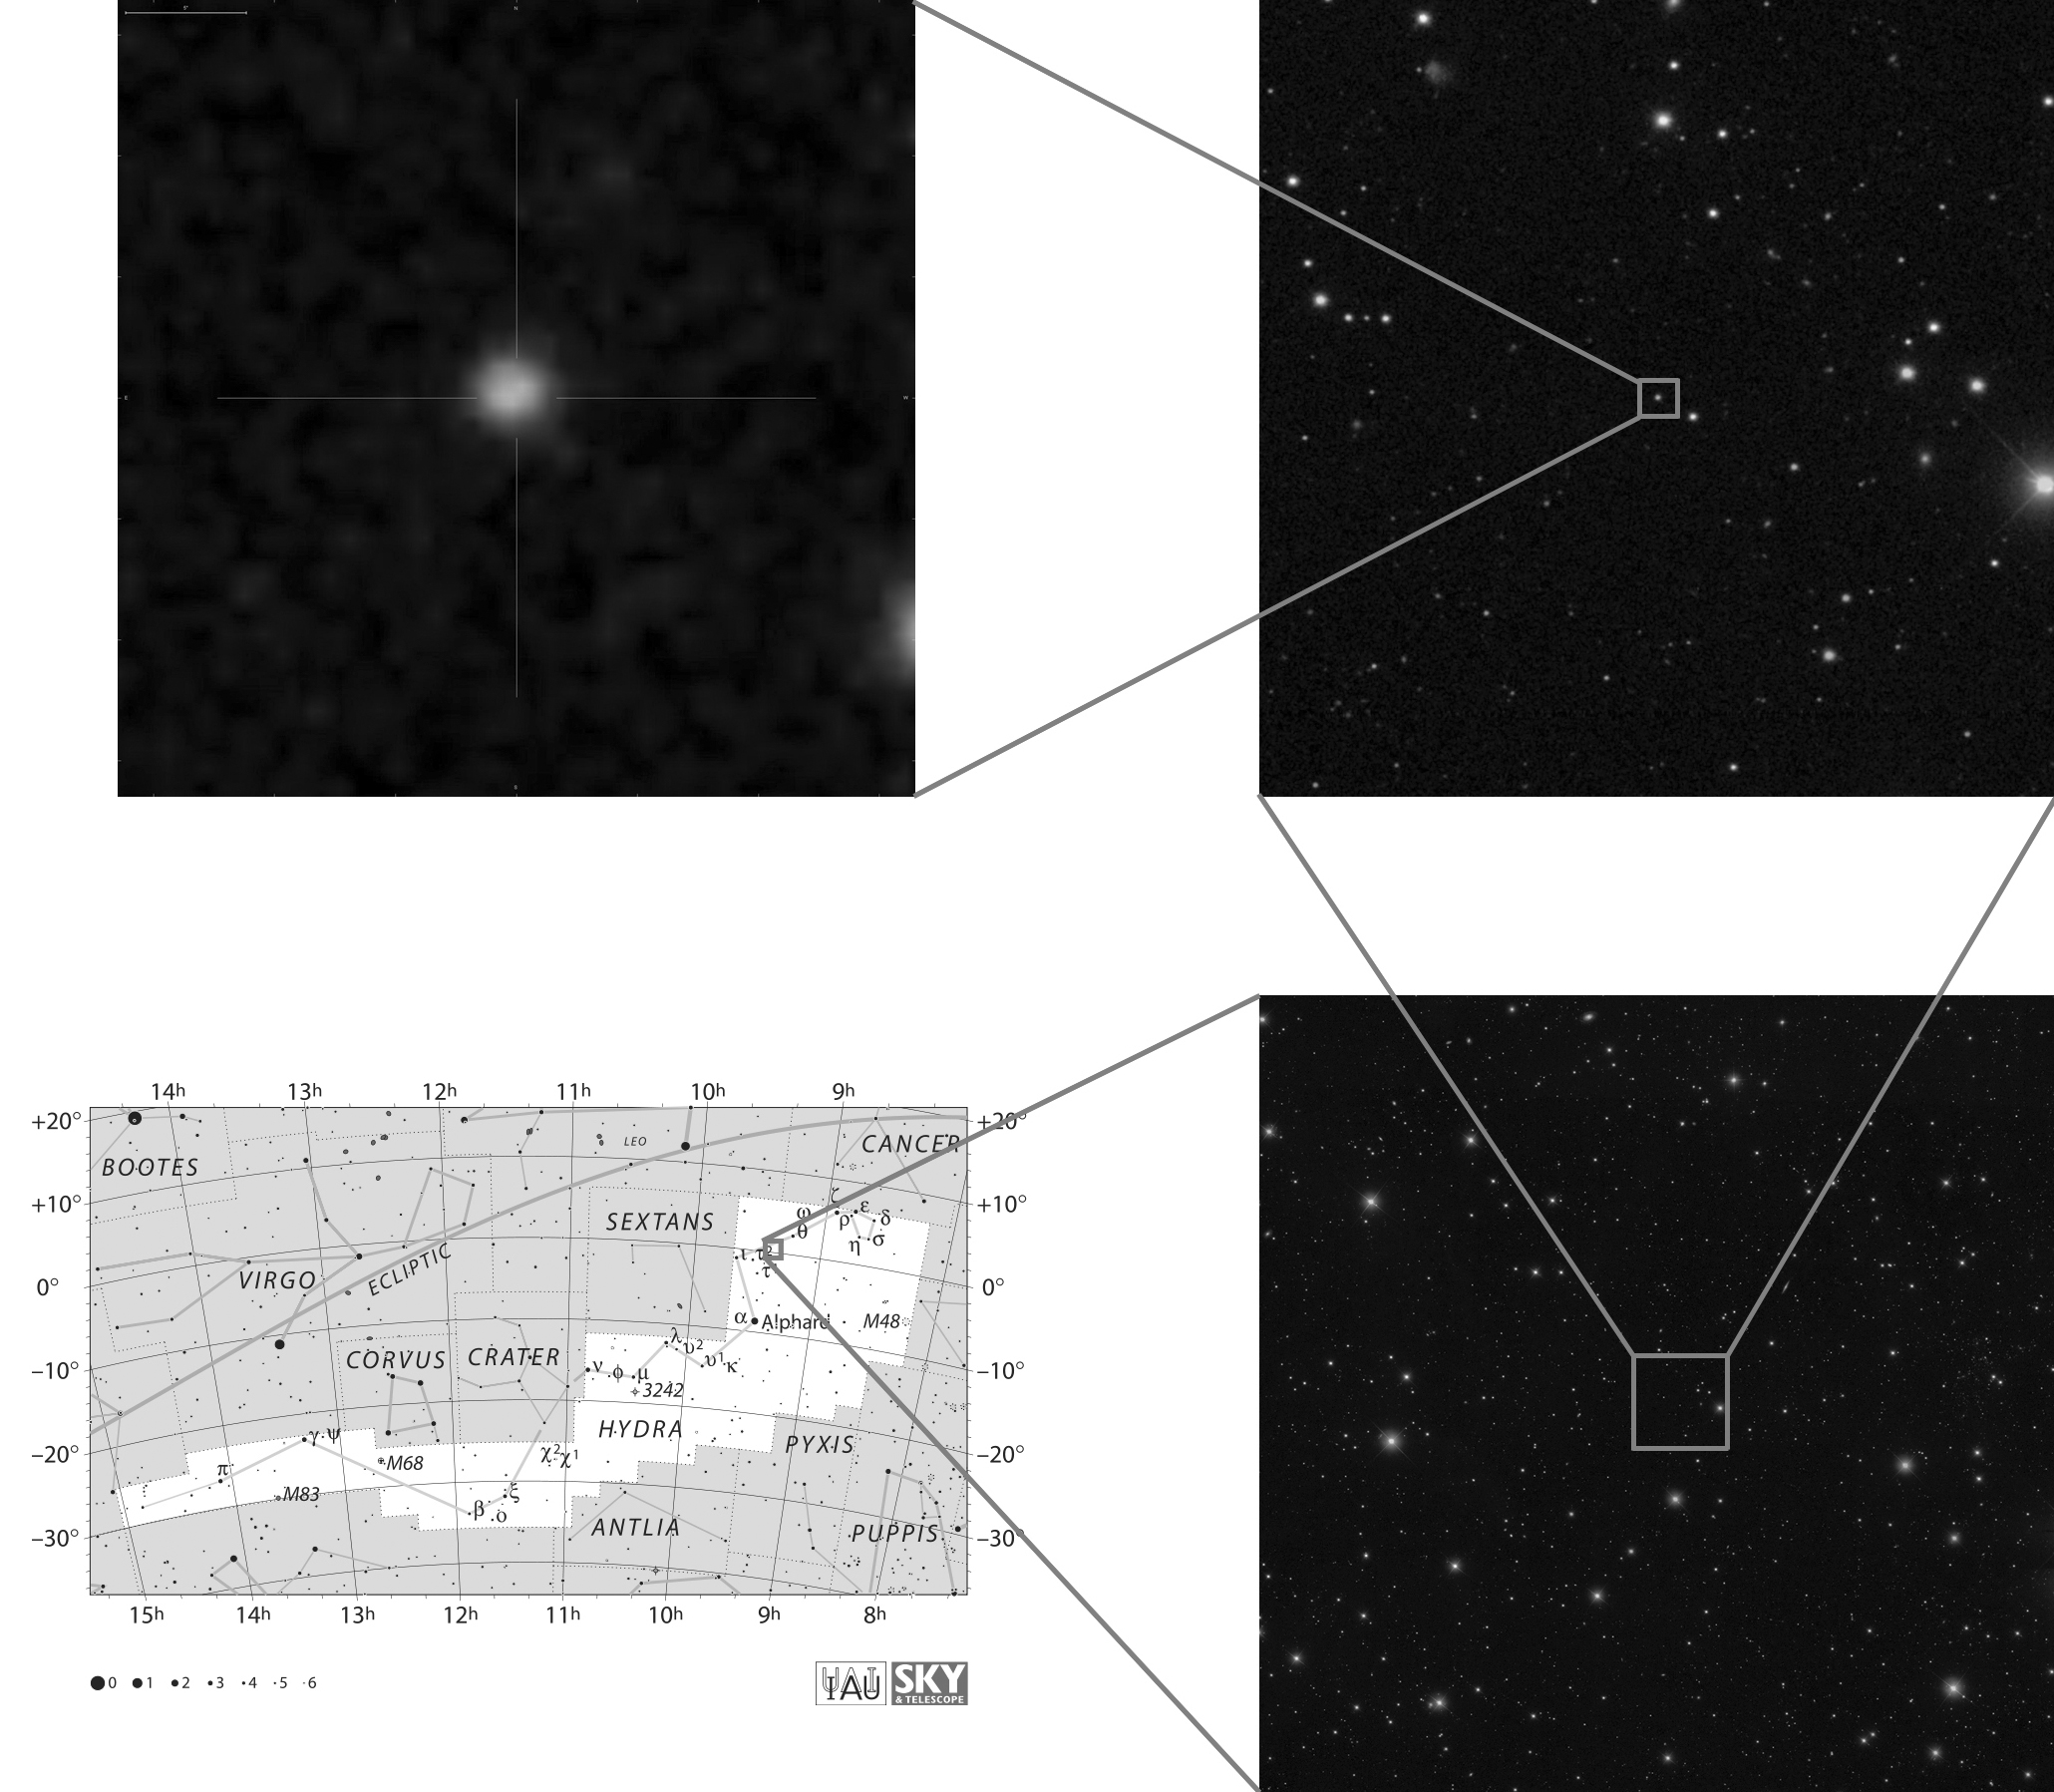
 An SDSS image of the quasar  SDSS J093620.52+004649.2, one of the 19 quasars with disappearing BAL troughs. The constellation map on the bottom left shows the quasar's position in the constellation Hydra. Three successive views zoom in closer and closer to the quasar.

Credit: Jordan Raddick (Johns Hopkins University) and the SDSS-III collaboration. Hydra constellation chart from The Constellations, produced by the International Astronomical Union and Sky and Telescope magazine (Roger Sinnott, Rick Fienberg, and Alan MacRobert).
Other versions:    B/W JPG   -   300 DPI color JPG   -   300 DPI B/W JPG

Quasars are powered by gas falling into supermassive black holes at the centers of galaxies. As the gas falls into the black hole, it heats up and gives off light. The gravitational force from the black hole is so strong, and is pulling so much gas, that the hot gas glows brighter than the entire surrounding galaxy.

 But with so much going on in such a small space, not all the gas is able to find its way into the black hole. Much of it instead escapes, carried along by strong winds blowing out from the center of the quasar.

 "These winds blow at thousands of miles per second, far faster than any winds we see on Earth," says Niel Brandt, a professor at Penn State and Filiz Ak's Ph.D. advisor. "The winds are important because we know that they play an important role in regulating the quasar's central black hole, as well as star formation in the surrounding galaxy."

Many quasars show evidence of these winds in their spectra — measurements of the amount of light that the quasar gives off at different wavelengths. Just outside the center of the quasar are clouds of hot gas flowing away from the central black hole. As light from deeper in the quasar passes through these clouds on its way to Earth, some of the light gets absorbed at particular wavelengths corresponding to the elements in the clouds.

 As gas clouds are accelerated to high speeds by the quasar, the Doppler effect spreads the absorption over a broad range of wavelengths, leading to a wide valley visible in the spectrum. The width of this "broad absorption line (BAL)" measures the speed of the quasar's wind. Quasars whose spectra show such broad absorption lines are known as "BAL quasars."

 But the hearts of quasars are chaotic, messy places. Quasar winds blow at thousands of miles per second, and the disk around the central black hole is rotating at speeds that approach the speed of light. All this adds up to an environment that can change quickly.

 Previous studies had found a few examples of quasars whose broad absorption lines seemed to have disappeared between one observation and the next. But these quasars had been found one at a time, and largely by chance — no one had ever done a systematic search for them. Undertaking such a search would require measuring spectra for hundreds of quasars, spanning several years.

 Enter the Sloan Digital Sky Survey (SDSS). Since 1998, SDSS has been regularly measuring spectra of quasars. Over the past three years, as part of SDSS-III's Baryon Oscillation Spectroscopic Survey (BOSS), the survey has been specifically seeking out repeated spectra of BAL quasars through a program proposed by Brandt and colleagues.

 Their persistence paid off — the research team gathered a sample of 582 BAL quasars, each of which had repeat observations over a period of between one and nine years – a sample about 20 times larger than any that had been previously assembled. The team then began to search for changes, and were quickly rewarded. In 19 of the quasars, the broad absorption lines had disappeared.

What's going on here? There are several possible explanations, but the simplest is that, in these quasars, gas clouds that we had seen previously are literally "gone with the wind" —the rotation of the quasar's disk and wind have carried the clouds out of the line-of-sight between us and the quasar.

 And because the sample of quasars is so large, and had been gathered in such a systematic manner, the team can go beyond simply identifying disappearing gas clouds. "We can quantify this phenomenon," says Filiz Ak.

 Finding nineteen such quasars out of 582 total indicates that about three percent of quasars show disappearing gas clouds over a three-year span, which in turn suggests that a typical quasar cloud spends about a century along our line of sight. "Since the universe is 14 billion years old, we're used to astronomical phenomena lasting a very long time," says Pat Hall of York University in Toronto, another team member. "It's fascinating to discover something that changes within a human lifetime."

 Now, as other astronomers come up with models of quasar winds, their models will need to explain this 100-year timescale. As theorists begin to consider the results, the team continues to analyze their sample of quasars — more results are coming soon. "This is really exciting for me," Filiz Ak says. "I'm sitting at my desk, discovering the nature of the most powerful winds in the Universe."


Paper announcing the results

Filiz Ak, N., W. N. Brandt, P. B. Hall, D. P. Schneider, S. F. Anderson, R. R. Gibson, B. F. Lundgren, A. D. Myers, P. Petitjean, N.P. Ross, Y. Shen, D. G. York, D. Bizyaev, J. Brinkmann, E. Malanushenko, D. J. Oravetz, K. Pan, A. E. Simmons, B. A. Weaver. 2012, Broad Absorption Line Disappearance on Multi-Year Timescales in a Large Quasar Sample, The Astrophysical Journal, 757(2), 114, doi:10.1088/0004-637X/757/2/114.

See it for yourself!

The quasar above is part of the SDSS-III's
Data Release 9, which means that all its data available free of charge online. Use the links below to see the quasar change right before your eyes!

The three links below will take you to an interactive spectrum viewer for three spectra of this quasar, measured by the Sloan Digital Sky Survey on three different nights. The spectra are labeled at the bottom in Ångstroms — one Ångstrom equals one ten-billionth of a meter.

Zoom in on the area of each spectrum around 4000 Ångströms. In that area, you should see a broad valley in the 2001 and 2002 spectra — a valley that is gone from the 2011 spectrum!


Contacts:
  1. Nurten Filiz Ak, Pennsylvania State University, nfilizak -at- psu.edu, +1 814 865 4536
  2. Niel Brandt, Pennsylvania State University, niel -at- psu.edu, +1 814 865 3509
  3. Pat Hall, York University, phall -at- yorku.ca, +1 416 736 2100 x77752
  4. Michael Wood-Vasey, SDSS-III Spokesperson, University of Pittsburgh, wmwv -at- pitt.edu, +1 412 624 2751
  5. Jordan Raddick, SDSS Public Information Officer, raddick -at- jhu.edu, +1 410 516 8889
Source: SDSS-III
Massive Spectroscopic Surveys of the Distant Universe, the Milky Way Galaxy and Extrasolar Planetary Systems


Wednesday, August 08, 2012

Astronomers Release the Largest Ever Three-Dimensional Map of the Sky

This is a still image from a video fly-through of the SDSS-III galaxies mapped in Data Release 9. Credit: Yushu Yao and Prabhat (Lawrence Berkeley National Laboratory, NERSC), Miguel A. Aragon (Johns Hopkins University), and the SDSS-III Collaboration.


Cambridge, MA - The Sloan Digital Sky Survey III (SDSS-III) has released the largest three-dimensional map of massive galaxies and distant black holes ever created. The new map pinpoints the locations and distances of over a million galaxies. It covers a total volume of 70 billion cubic light-years.

"We want to map the largest volume of the universe yet, and to use that map to understand how the expansion of the universe is accelerating," said Daniel Eisenstein (Harvard-Smithsonian Center for Astrophysics), the director of SDSS-III.

The map is the centerpiece of Data Release 9 (DR9), which publicly releases the data from the first two years of a six-year survey project. The release includes images of 200 million galaxies and spectra of 1.35 million galaxies. (Spectra take more time to collect than photographs, but provide the crucial third dimension by letting astronomers measure galaxy distances.)

"Our goal is to create a catalog that will be used long after we are done," said Michael Blanton of New York University, who led the team that prepared Data Release 9.

The release includes new data from the ongoing SDSS-III Baryon Oscillation Spectroscopic Survey (BOSS), which will measure the positions of massive galaxies up to six billion light-years away, as well as quasars - giant black holes actively feeding on stars and gas - up to 12 billion light-years from Earth.

BOSS is targeting these big, bright galaxies because they live in the same places as other galaxies and they're easy to spot. Mapping these big galaxies thus provides an effective way to make a map of the rest of the galaxies in the universe.

With such a map, scientists can retrace the history of the universe over the last six billion years. With that history, they can get better estimates for how much of the universe is made up of "dark matter" - matter that we can't directly see because it doesn't emit or absorb light - and "dark energy," the even more mysterious force that drives the accelerating expansion of the universe.

"Dark matter and dark energy are two of the greatest mysteries of our time," said David Schlegel of Lawrence Berkeley National Laboratory, the principal investigator of BOSS. "We hope that our new map of the universe can help someone solve the mystery."

This release is being issued jointly with the SDSS-III Collaboration.

All the data are available now on the Data Release 9 website at http://www.sdss3.org/dr9. The new data are being made available to astronomers, as well as students, teachers, and the public. The SkyServer website includes lesson plans for teachers that use DR9 data to teach astronomy and other topics in science, technology, and math. DR9 data will also feature in a new release of the Galaxy Zoo citizen science project, which allows online volunteers to contribute to cutting-edge astronomy research.

Headquartered in Cambridge, Mass., the Harvard-Smithsonian Center for Astrophysics (CfA) is a joint collaboration between the Smithsonian Astrophysical Observatory and the Harvard College Observatory. CfA scientists, organized into six research divisions, study the origin, evolution and ultimate fate of the universe.

For more information, contact:

David A. Aguilar
Director of Public Affairs
Harvard-Smithsonian Center for Astrophysics
617-495-7462

daguilar@cfa.harvard.edu

Christine Pulliam
Public Affairs Specialist
Harvard-Smithsonian Center for Astrophysics
617-495-7463

cpulliam@cfa.harvard.edu

Jordan Raddick, SDSS-III
410-516-8889

raddick@jhu.edu

Monday, December 05, 2011

A Beast With Four Tails

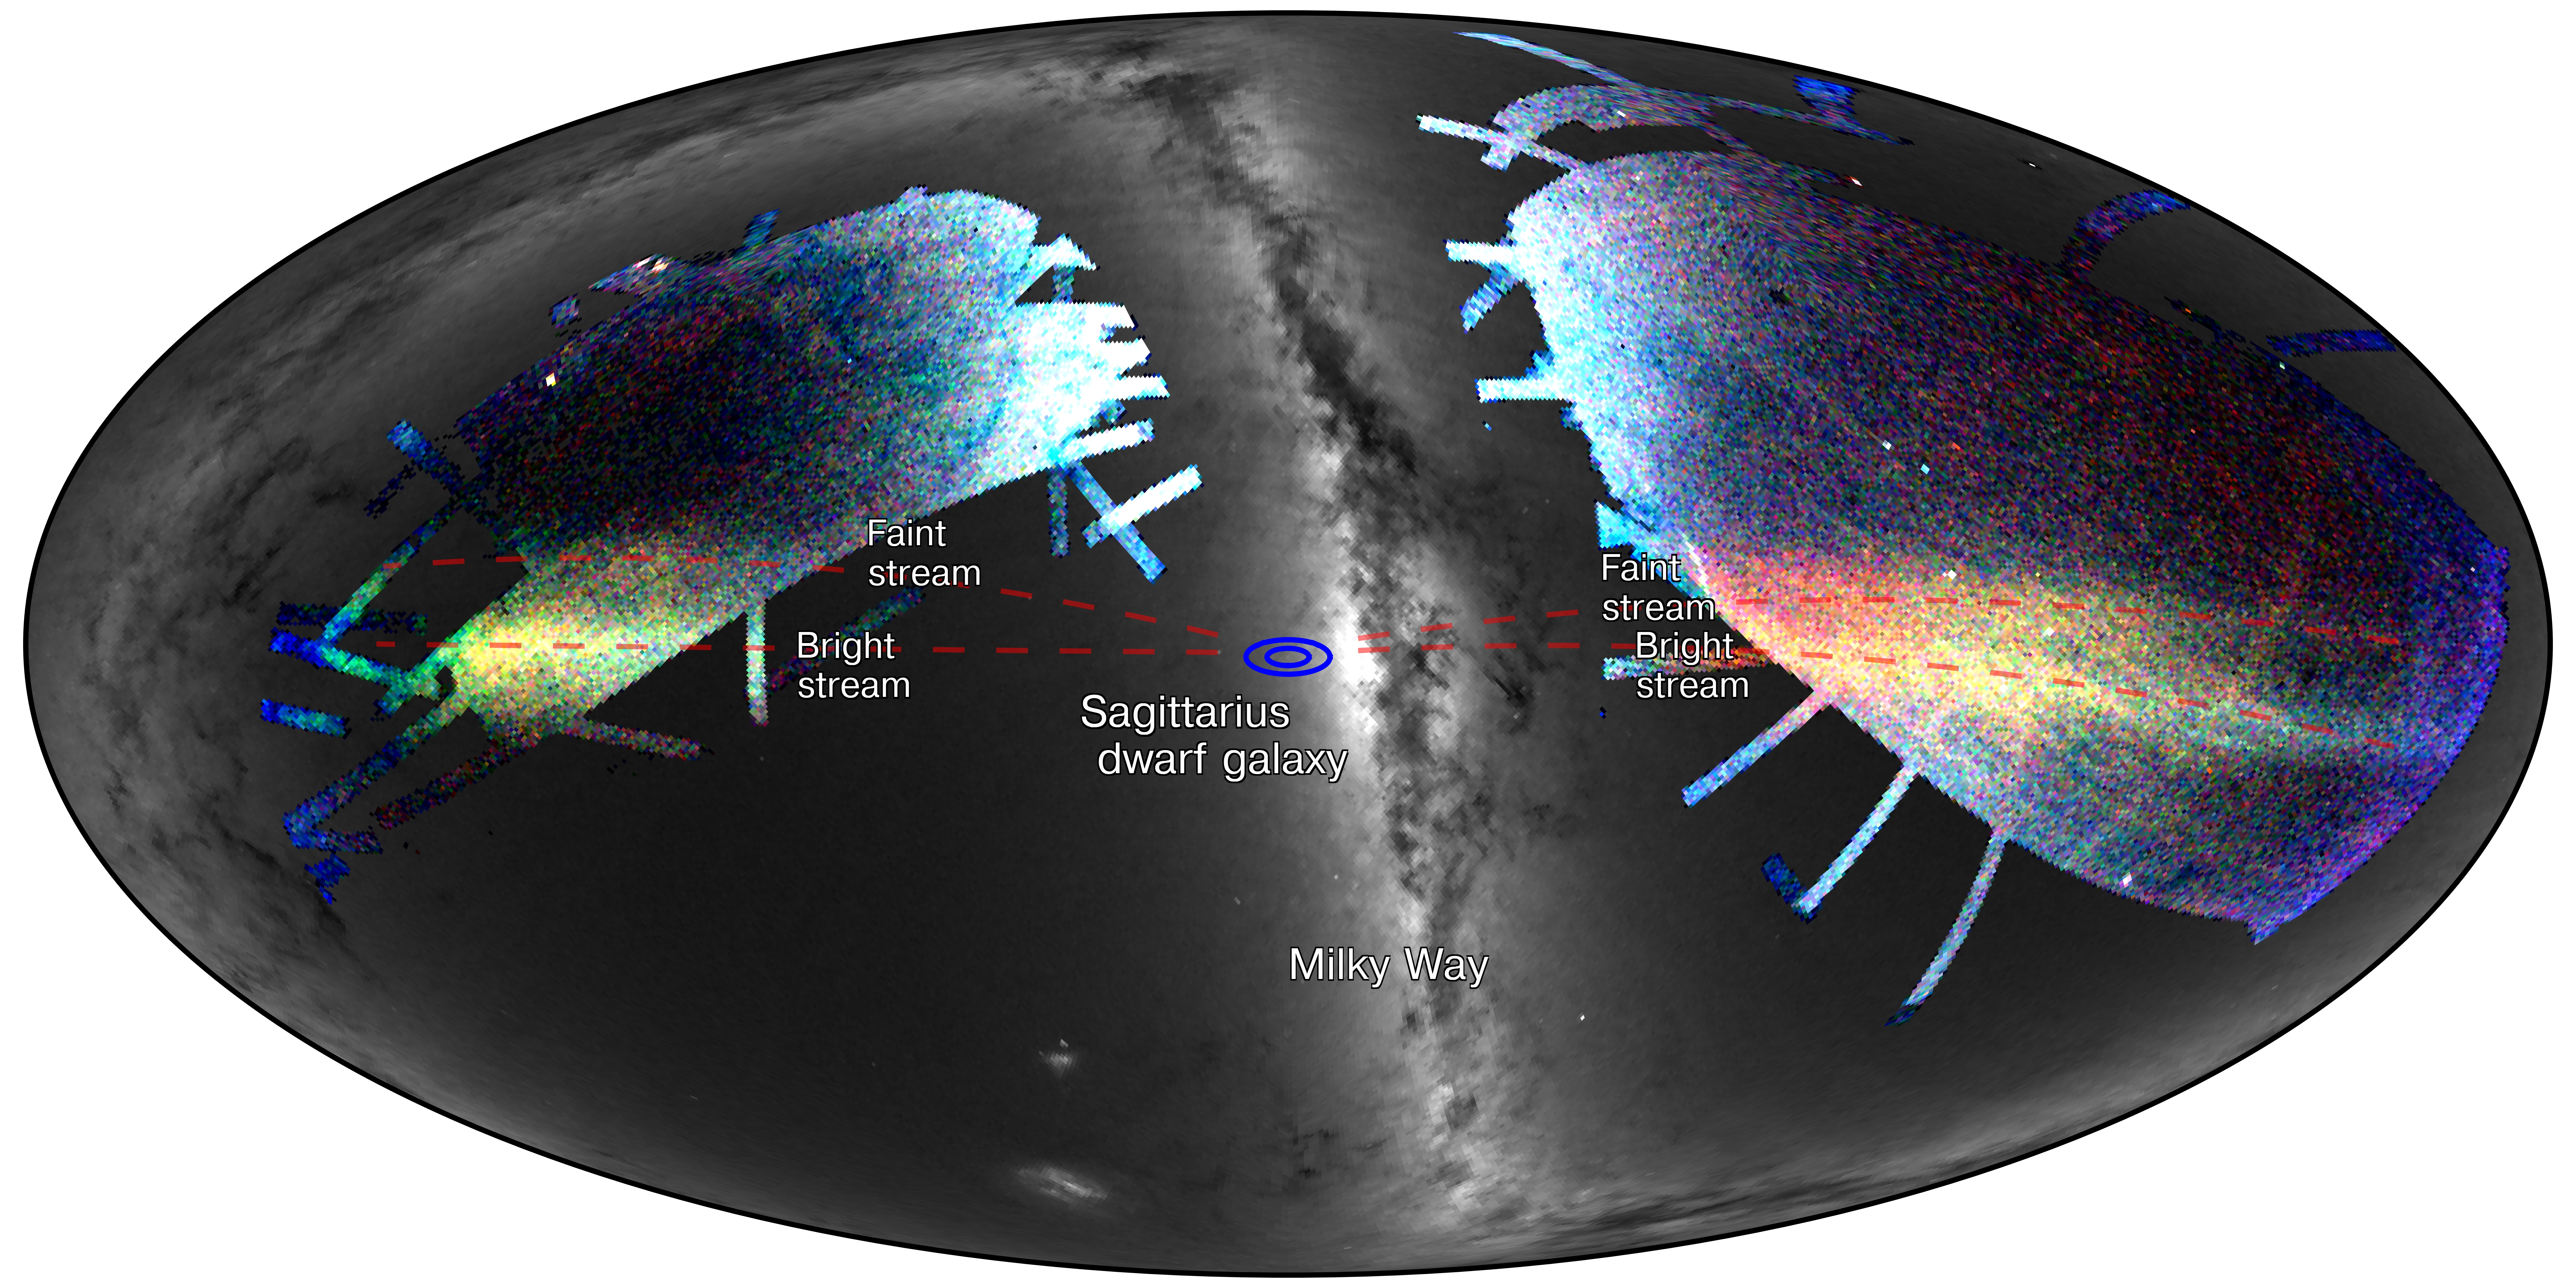
A map of the sky showing the numbers of stars counted in the Sagittarius streams. The colors indicate the distances to the stars identified in the study - stars located in red areas are further away, while stars in the blue areas are closer. The dotted red lines trace out the Sagittarius streams, and the blue ellipses in the center show the current location of the Sagittarius Dwarf Galaxy. Figure credit: S. Koposov and the SDSS-III collaboration. Click here for a larger (300 DPI) version.

The Milky Way galaxy continues to devour its small neighboring dwarf galaxies and the evidence is spread out across the sky.

A team of astronomers led by Sergey Koposov and Vasily Belokurov of the University of Cambridge recently discovered two streams of stars in the Southern Galactic hemisphere that were torn off the Sagittarius dwarf galaxy. This discovery came from analyzing data from the latest Sloan Digital Sky Survey (SDSS-III) and was announced in a paper released December 1, 2011 (arXiv paper #1111.7042) that connects these new streams with two previously known streams in the Northern Galactic hemisphere.

"We have long known that when small dwarf galaxies fall into bigger galaxies, elongated streams, or tails, of stars are pulled out of the dwarf by the enormous tidal field," said Sergey Koposov.

The Sagittarius dwarf galaxy used to be one of the brightest of the Milky Way satellites. Its disrupted remnant now lies on the other side of the Galaxy, breaking up as it is crushed and stretched by huge tidal forces. It is so small that it has lost half of its stars and all its gas over the last billion years.

Before SDSS-III, Sagittarius was known to have two tails, one in front of and one behind the remnant. Previous SDSS imaging had already found the Sagittarius tidal tail in the Northern Galactic sky in 2006 and revealed that one of the tails was forked into two.

"That was an amazing discovery," said Vasily Belokurov, "but the remaining piece of the puzzle, the structure in the South, was missing until now."

Sergey Koposov and colleagues analyzed density maps of over 13 million stars in the latest release of Sloan Digital Sky Survey data, including the crucial coverage of the Southern Galactic sky. The new data show that the Sagittarius stream in the South is also split into two, a fatter and brighter stream alongside a thinner and fainter stream. This brighter stream is more enriched with iron and other metals than its dimmer companion. Because each generation of stars makes and distributes more metals into the next generation, the Cambridge astronomers concluded that the brighter stream is younger than the older fainter one.

"Sagittarius is like a beast with four tails," observed Wyn Evans, from the Institute of Astronomy, University of Cambridge.

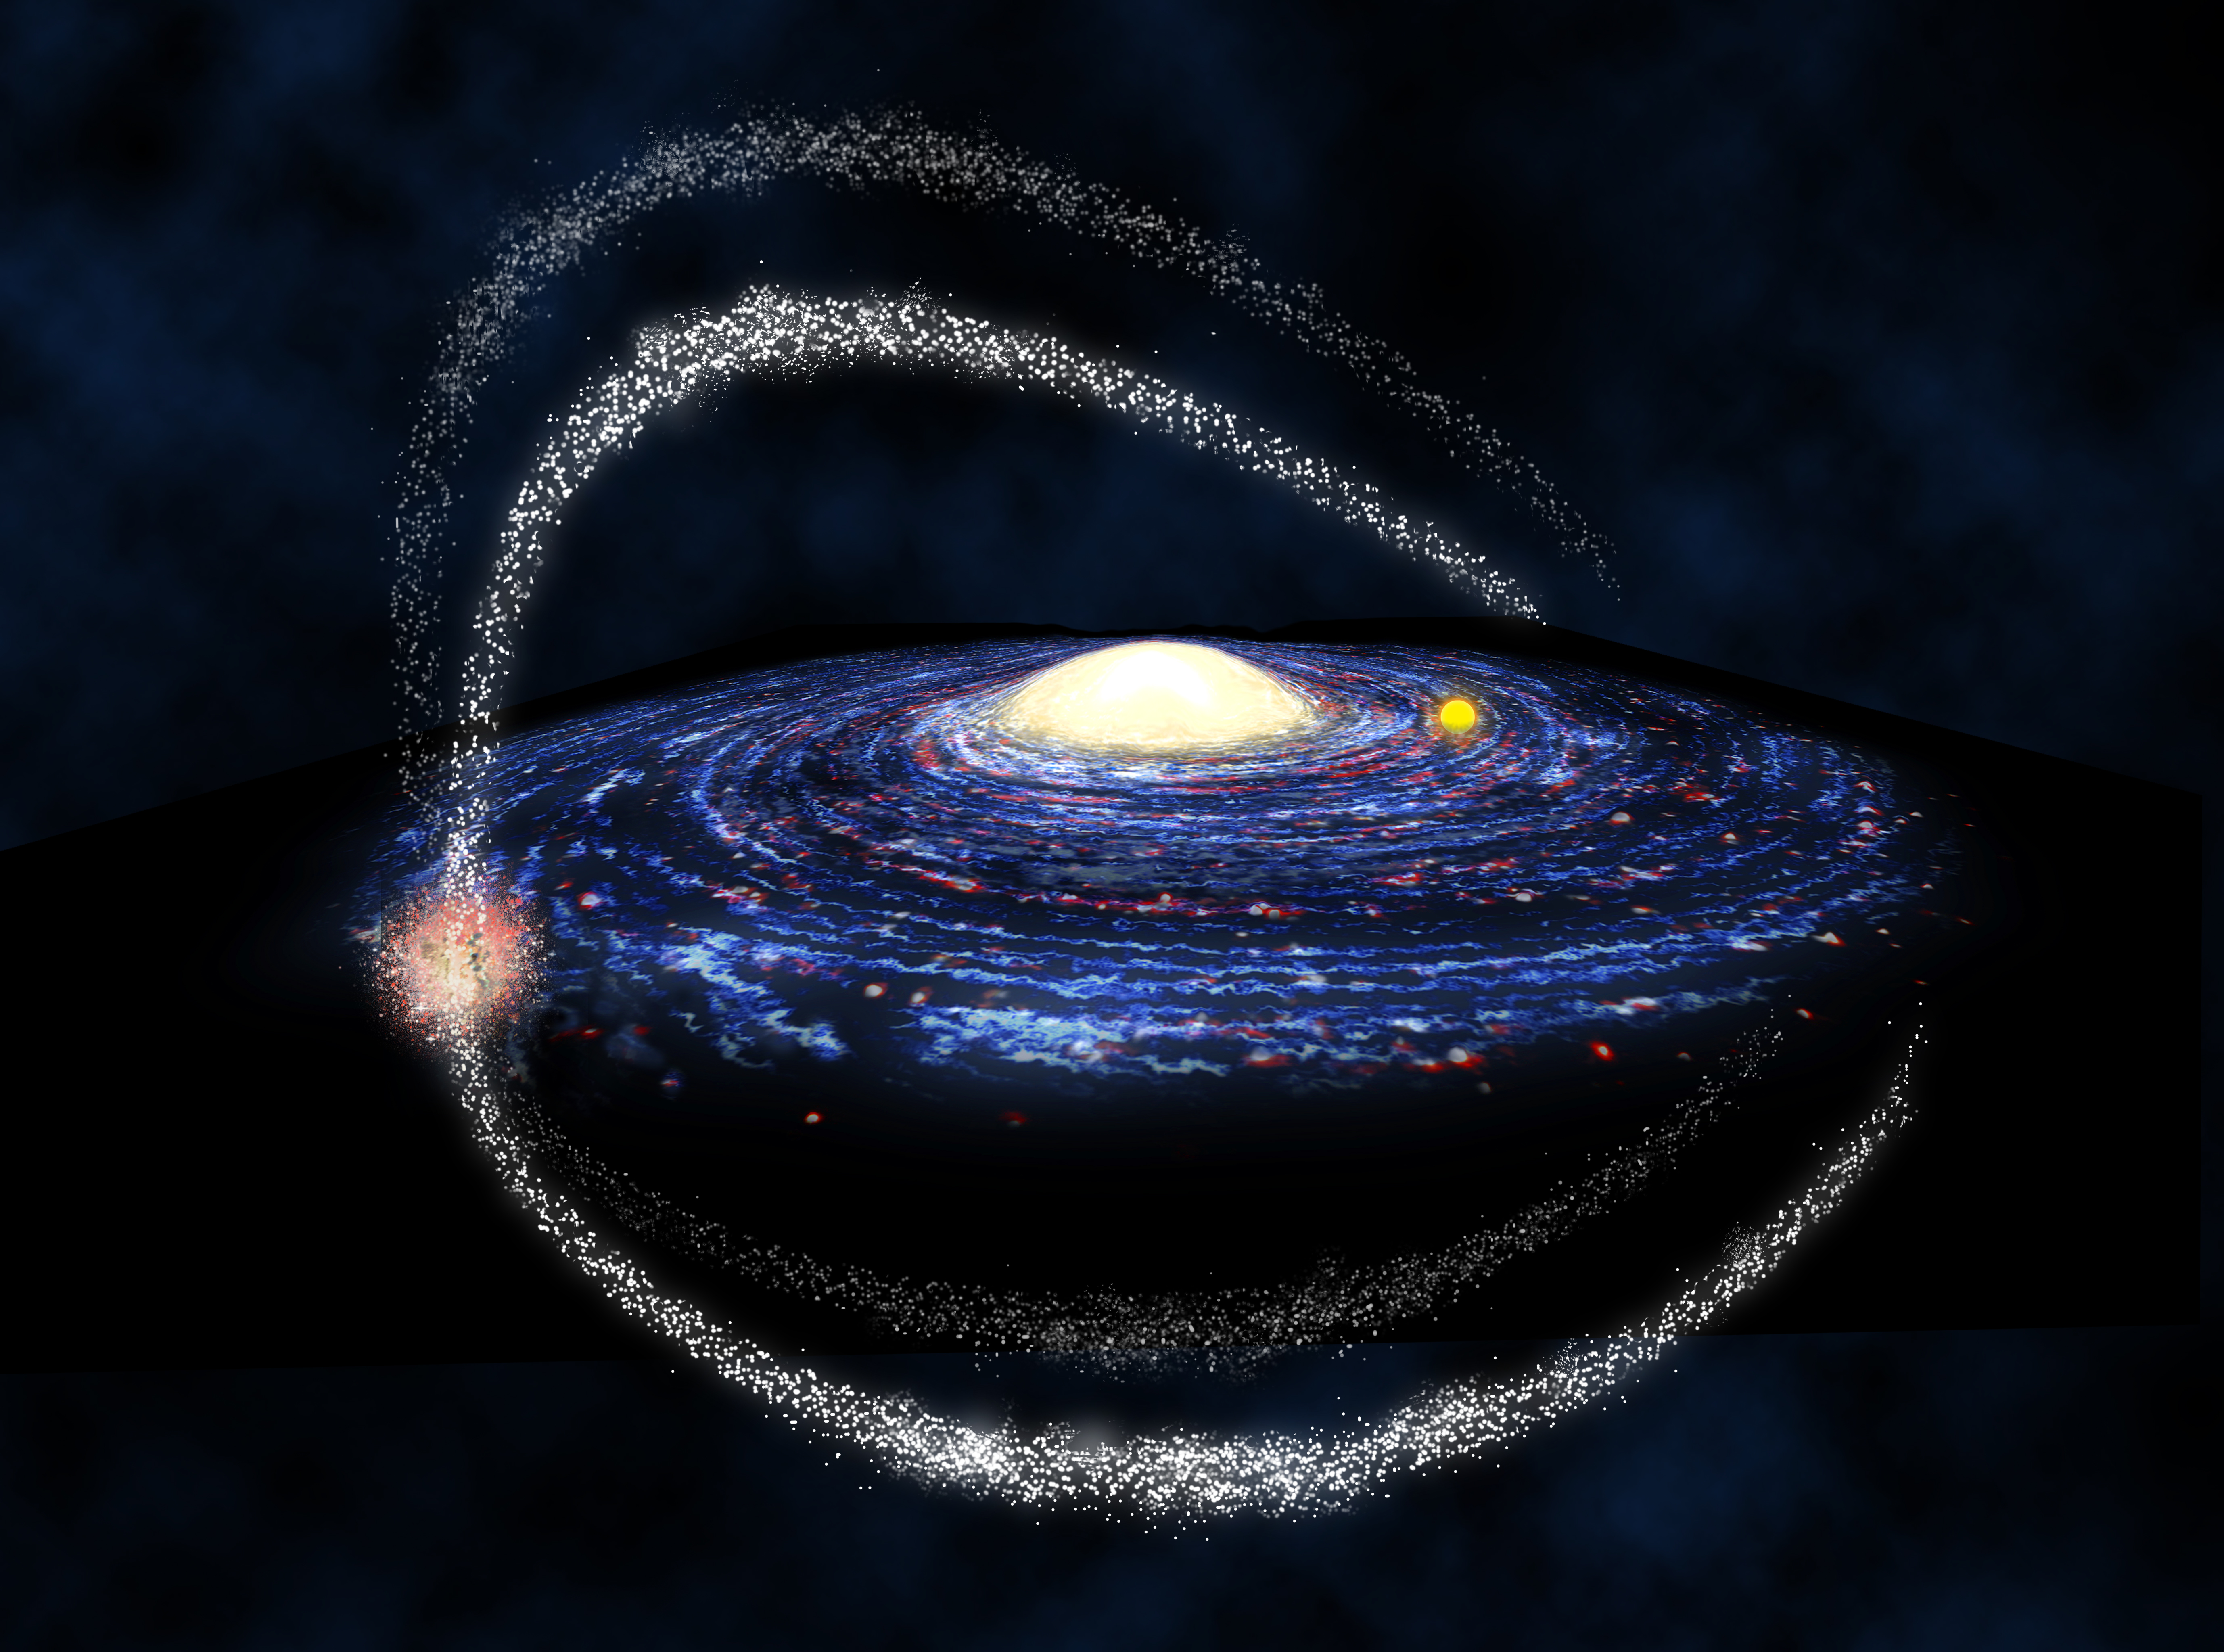
An artist's impression of the four tails of the Sagittarius Dwarf Galaxy (the orange clump on the left of the image) orbiting the Milky Way. The bright yellow circle to the right of the galaxy's center is our Sun (not to scale). Figure credit: Amanda Smith, Institute of Astronomy, University of Cambridge

The Sagittarius dwarf galaxy is on the other side of the galaxy from us, but we can see its tidal tails of stars (white in this image) stretching across the sky as they wrap around our galaxy. Click here for a larger (300 DPI) version.

No one knows the mechanism that caused the splitting of the tidal tails. However, scientists believe that perhaps the Sagittarius dwarf galaxy was once a part of a binary galactic system, similar to the present day Large and Small Magellanic Clouds. Each of these could have produced a leading and trailing tail on falling into the Milky Way Galaxy, yielding four in all.

But co-author Geraint Lewis of Sydney University has another idea. He says, "Perhaps the Sagittarius dwarf galaxy has suffered an encounter with an object in the game of Galactic billiards. Maybe a collision with a massive clump of dark matter, or even another satellite galaxy, has split each of the streams into two."

A final theory suggests that, just as meteors have spread into different streams through evolution in the Solar system, debris from Sagittarius may have spread into different streams at different points in time. Different epochs may suffer different amounts of precession in the Galaxy, causing the split streams. "I have been running hundreds of simulations of the disruption of the Sagittarius dwarf and this idea looks very plausible," commented Jorge Penarrubia of the IAA, Granada, who was also involved in the study.

Whatever the explanation, SDSS-III has provided a wealth of new information on the engorgement of the Sagittarius galaxy. The disruption of smaller galaxies has occurred many times in the history of the Milky Way and other galaxies like ours throughout the Universe.

The wagging of the four tails of Sagittarius will shed new light on both the structure and formation of the Milky Way.

Additional Resources

The paper is available from the arXiv Preprint Server (paper number 1111.7042)

The following YouTube video is an illustration of the streams produced by the Sagittarius dwarf galaxy wrapping around the Milky Way.


This YouTube movie shows an illustration of multiple streams produced by the disruption of the Sagittarius dwarf galaxy in the Milky Way halo. The orange sphere shows the location of the Sun in the Galaxy. The Sagittarius dwarf galaxy itself is located in the middle of the stream. The size of the area shown in the movie is approximately 600 thousands light years (200 kiloparsecs). Figure credit: S. Koposov and the SDSS-III collaboration

About SDSS-III

Funding for SDSS-III has been provided by the Alfred P. Sloan Foundation, the Participating Institutions, the National Science Foundation, and the U.S. Department of Energy. The SDSS-III web site is http://www.sdss3.org/.

SDSS-III is managed by the Astrophysical Research Consortium for the Participating Institutions of the SDSS-III Collaboration including the University of Arizona, the Brazilian Participation Group, Brookhaven National Laboratory, University of Cambridge, University of Florida, the French Participation Group, the German Participation Group, the Instituto de Astrofisica de Canarias, the Michigan State/Notre Dame/JINA Participation Group, Johns Hopkins University, Lawrence Berkeley National Laboratory, Max Planck Institute for Astrophysics, New Mexico State University, New York University, Ohio State University, Pennsylvania State University, University of Portsmouth, Princeton University, the Spanish Participation Group, University of Tokyo, University of Utah, Vanderbilt University, University of Virginia, University of Washington, and Yale University.

Contacts:

Sergey Koposov,
University of Cambridge,

koposov@ast.cam.ac.uk, +44 01223 337551

Vasily Belokurov,
University of Cambridge,

vasily@ast.cam.ac.uk, +44 01223 337515

Wyn Evans, University of Cambridge,
nwe@ast.cam.ac.uk, +44 01223 765847

Michael Wood-Vasey,
SDSS-III Spokesperson,
University of Pittsburgh,
wmwv@pitt.edu, +1 412-624-2751

Jordan Raddick,
SDSS Public Information Officer,

raddick@jhu.edu, +1 410-516-8889

Copyright © 2010 SDSS-III