Showing posts with label Sloan Digital Sky Survey-III. Show all posts

Thursday, July 21, 2016

1.2 Million Galaxies in 3D

This 
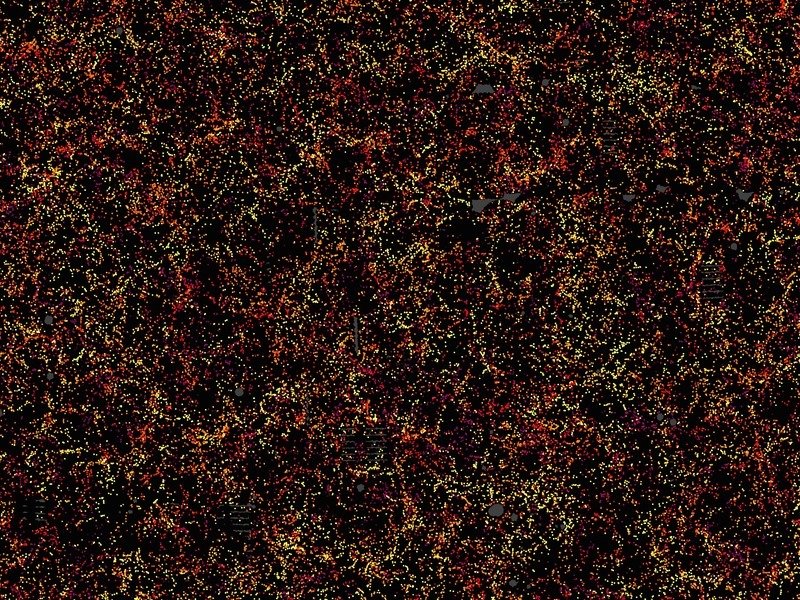
is one slice through the map of the large-scale structure of the Universe from the Sloan Digital Sky Survey and its Baryon Oscillation Spectroscopic Survey. Each dot in this picture indicates the position of a galaxy 6 billion years into the past. The image covers about 1/20th of the sky, a slice of the Universe 6 billion light-years wide, 4.5 billion light-years high, and 500 million light-years thick. Colour indicates distance from Earth, ranging from yellow on the near side of the slice to purple on the far side. Galaxies are highly clustered, revealing superclusters and voids whose presence is seeded in the first fraction of a second after the Big Bang. This image contains 48,741 galaxies, about 3% of the full survey dataset. Grey patches are small regions without survey data. Image credit: Daniel Eisenstein and SDSS-III. Hi-res image

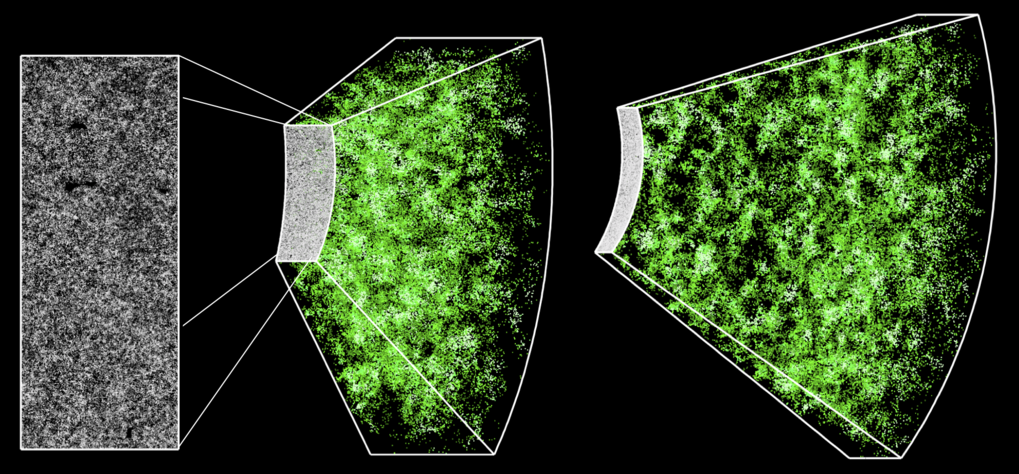
This is a section of the three-dimensional map constructed by BOSS. The rectangle on the left shows a cut-out of 1000 sq. degrees in the sky containing nearly 120,000 galaxies, or roughly 10% of the total survey. The spectroscopic measurements of each galaxy - every dot in that cut-out - transform the two-dimensional picture into a three-dimensional map, extending our view out to 7 billion years in the past. The brighter regions in this map correspond to the regions of the Universe with more galaxies and therefore more dark matter. The extra matter in those regions creates an excess gravitational pull, which makes the map a test of Einstein’s theory of gravity. © Jeremy Tinker und SDSS-III. Hi-res image


What are the properties of Dark Energy? This question is one of the most intriguing ones in astronomy and scientists are one step closer in answering this question with the largest three-dimensional map of the universe so far: This map contains 1.2 million galaxies in a volume spanning 650 cubic billion light years. Hundreds of scientists from the Sloan Digital Sky Survey III (SDSS-III) – including researchers at the Max Planck Institutes for Extraterrestrial Physics and for Astrophyics - used this map to make one of the most precise measurements yet of dark energy. They found excellent agreement with the standard cosmological model and confirmed that dark energy is highly consistent with a cosmological constant.

"We have spent a decade collecting measurements of 1.2 million galaxies over one quarter of the sky to map out the structure of the Universe over a volume of 650 cubic billion light years,” says Jeremy Tinker of New York University, a co-leader of the scientific team that led this effort. Hundreds of scientists are part of the Sloan Digital Sky Survey III (SDSS-III) team.

These new measurements were carried out by the Baryon Oscillation Spectroscopic Survey (BOSS) programme of SDSS-III. Shaped by a continuous tug-of-war between dark matter and dark energy, the map revealed by BOSS allows astronomers to measure the expansion rate of the Universe by determining the size of the so-called baryonic acoustic oscillations (BAO) in the three-dimensional distribution of galaxies.

Pressure waves travelled through the young Universe up to when it was only 400,000 years old at which point they became frozen in the matter distribution of the Universe. The end result is that galaxies are preferentially separated by a characteristic distance, which astronomers call the BAO scale. The primordial size of the BAO scale is exquisitely determined from observations of the cosmic microwave background.

Ariel Sanchez of the Max-Planck Institute of Extraterrestrial Physics (MPE) led the effort to estimate the exact amount of dark matter and dark energy based on the BOSS data and explains: "Measuring the acoustic scale across cosmic history gives a direct ruler with which to measure the Universe’s expansion rate.  With BOSS, we have traced the BAO’s subtle imprint on the distribution of galaxies spanning a range of time from 2 to 7 billion years ago."

For the very precise measurements, however, the data had to be painstakingly analysed. Especially the determination of distances to the galaxies posed a big challenge. This is inferred from the galaxy spectra, which show that a galaxy’s light is shifted to the red part of the spectrum because it moves away from us. This so-called redshift is correlated with a galaxy’s distance: The farther a galaxy is away from us, the faster it moves.

“However, galaxies also have peculiar motions and the peculiar velocity component along the line-of-sight leads to the so-called redshift space distortion,” explains Shun Saito from the Max Planck Institute for Astrophysics (MPA), who contributed sophisticated models to the BOSS data analysis. “This makes the galaxy distribution anisotropic because the line-of-sight direction is now special – only along this direction the distance is measured through a redshift, which is contaminated by peculiar velocity. In other words, the characteristic anisotropic pattern allows us to measure the peculiar velocity of galaxies – and because the motion of galaxies is governed by gravity, we can use this measurement to constrain to what level Einstein’s general relativity is correct at cosmological scales. In order to properly interpret the data, we have developed a refined model to describe the galaxy distribution.”

Another approach, used by a junior MPE researcher for his PhD thesis, is to use the angular positions of galaxies on the sky instead of physical 3D positions. “This method uses only observables,” explains Salvador Salazar. “We make no prior assumptions about the cosmological model.”

Around the world, other groups all used slightly different models and methodologies to analyse the huge BOSS data set. “We now have seven measurements, which are slightly different, but highly correlated,” Ariel Sanchez points out. “To extract the most information about the cosmological parameters, we had to find not only the best methods and models for data analysis but also the optimal combination of these measurements.”

This analysis has now born fruit: the BOSS data show that dark energy, which is driving the cosmological expansion, is consistent with a cosmological constant within an error of only 5%. This constant, called Lambda, was introduced by Albert Einstein to counter the attractive force of matter, i.e. it has a repellent effect. Moreover, all results are fully consistent with the standard cosmological model, giving further strength to this still relatively young theory.

In particular, the map also reveals the distinctive signature of the coherent movement of galaxies toward regions of the Universe with more matter, due to the attractive force of gravity. Crucially, the observed amount of infall matches well to the predictions of general relativity. This supports the idea that the acceleration of the expansion rate is driven by a phenomenon at the largest cosmic scales, such as dark energy, rather than a breakdown of our gravitational theory.


Contact:

Saito, Shun
Phone: 2225
Email: ssaito@mpa-garching.mpg.de

Hämmerle, Hannelore
Hämmerle, Hannelore
Press officer
Phone: 3980
Email: hanne@mpa-garching.mpg.de


Original Publication 

1. Jan Niklas Grieb, Ariel G. Sánchez, Salvador Salazar-Albornoz et al. (the BOSS collaboration)
The clustering of galaxies in the completed SDSS-III Baryon Oscillation Spectroscopic Survey: Cosmological implications of the Fourier space wedges of the final sample
submitted to MNRAS
Source

2. Salvador Salazar-Albornoz, Ariel G. Sanchez, Jan Niklas Grieb et al.
The clustering of galaxies in the completed SDSS-III Baryon Oscillation Spectroscopic Survey: Angular clustering tomography and its cosmological implications
submitted to MNRAS
Source

3. Ariel G. Sanchez, Jan Niklas Grieb, Salvador Salazar-Albornoz et al.
The clustering of galaxies in the completed SDSS-III Baryon Oscillation Spectroscopic Survey: combining correlated Gaussian posterior distributions
submitted to MNRAS
Source

4. Ariel G. Sanchez, Roman Scoccimarro, Martin Crocce et al.
The clustering of galaxies in the completed SDSS-III Baryon Oscillation Spectroscopic Survey: cosmological implications of the configuration-space clustering wedges
submitted to MNRAS
Source

5. Florian Beutler, Hee-Jong Seo, Shun Saito et al.
The clustering of galaxies in the completed SDSS-III Baryon Oscillation Spectroscopic Survey: Anisotropic galaxy clustering The clustering of galaxies in the completed SDSS-III Baryon Oscillation Spectroscopic Survey: Baryon Acoustic Oscillations in Fourier-space
submitted to MNRAS
Source

Wednesday, January 11, 2012

Calculating What’s in the Universe from the Biggest Color 3-D Map

The Sloan Digital Sky Survey III surveyed 14,000 square degrees of the sky, more than a third of its total area, and delivered over a trillion pixels of imaging data. This image shows over a million luminous galaxies at redshifts indicating times when the universe was between seven and eleven billion years old, from which the sample in the current studies was selected. (By David Kirkby of the University of California at Irvine and the SDSS collaboration. Click on image for best resolution. An animated version is at http://darkmatter.ps.uci.edu/lrg-sdss.)

Since 2000, the three Sloan Digital Sky Surveys (SDSS I, II, III) have surveyed well over a quarter of the night sky and produced the biggest color map of the universe in three dimensions ever. Now scientists at the U.S. Department of Energy’s Lawrence Berkeley National Laboratory (Berkeley Lab) and their SDSS colleagues, working with DOE’s National Energy Research Scientific Computing Center (NERSC) based at Berkeley Lab, have used this visual information for the most accurate calculation yet of how matter clumps together – from a time when the universe was only half its present age until now.

“The way galaxies cluster together over vast expanses of the sky tells us how both ordinary visible matter and underlying invisible dark matter are distributed, across space and back in time,” says Shirley Ho, an astrophysicist at Berkeley Lab and Carnegie Mellon University, who led the work. “The distribution gives us cosmic rulers to measure how the universe has expanded, and a basis for calculating what’s in it: how much dark matter, how much dark energy, even the mass of the hard-to-see neutrinos it contains. What’s left over is the ordinary matter and energy we’re familiar with.”

For the present study Ho and her colleagues first selected 900,000 luminous galaxies from among over 1.5 million such galaxies gathered by the Baryon Oscillation Spectrographic Survey, or BOSS, the largest component of the still-ongoing SDSS III. Most of these are ancient red galaxies, which contain only red stars because all their faster-burning stars are long gone, and which are exceptionally bright and visible at great distances. The galaxies chosen for this study populate the largest volume of space ever used for galaxy clustering measurements. Their brightness was measured in five different colors, allowing the redshift of each to be estimated.

“By covering such a large area of sky and working at such large distances, these measurements are able to probe the clustering of galaxies on incredibly vast scales, giving us unprecedented constraints on the expansion history, contents, and evolution of the universe,” says Martin White of Berkeley Lab’s Physics Division, a professor of physics and astronomy at the University of California at Berkeley and chair of the BOSS science survey teams. “The clustering we’re now measuring on the largest scales also contains vital information about the origin of the structure we see in our maps, all the way back to the epoch of inflation, and it helps us to constrain – or rule out – models of the very early universe.”

After augmenting their study with information from other data sets, the team derived a number of such cosmological constraints, measurements of the universe’s contents based on different cosmological models. Among the results: in the most widely accepted model, the researchers found – to less than two percent uncertainty – that dark energy accounts for 73 percent of the density of the universe.

The team’s results are presented January 11 at the annual meeting of the American Astronomical Society in Austin, Texas, and have been submitted to the Astrophysical Journal. They are currently available online at http://arxiv.org/abs/1201.2137.

The power of the universe

“The way mass clusters on the largest scales is graphed in an angular power spectrum, which shows how matter statistically varies in density across the sky,” says Ho. “The power spectrum gives a wealth of information, much of which is yet to be exploited.” For example, information about inflation – how the universe rapidly expanded shortly after the big bang – can be derived from the power spectrum.

Closely related to the power spectrum are two “standard rulers,” which can be used to measure the history of the expansion of the universe. One ruler has only a single mark – the time when matter and radiation were exactly equal in density.

“In the very early universe, shortly after the big bang, the universe was hot and dominated by photons, the fundamental particles of radiation,” Ho explains. “But as it expanded, it began the transition to a universe dominated by matter. By about 50,000 years after the big bang, the density of matter and radiation were equal. Only when matter dominated could structure form.”

The other cosmic ruler is also big, but it has many more than one mark in the power spectrum; this ruler is called BAO, for baryon acoustic oscillations. (Here, baryon is shorthand for ordinary matter.) Baryon acoustic oscillations are relics of the sound waves that traveled through the early universe when it was a hot, liquid-like soup of matter and photons. After about 50,000 years the matter began to dominate, and by about 300,000 years after the big bang the soup was finally cool enough for matter and light to go their separate ways.

Differences in density that the sound waves had created in the hot soup, however, left their signatures as statistical variations in the distribution of light, detectable as temperature variations in the cosmic microwave background (CMB), and in the distribution of baryons. The CMB is a kind of snapshot that can still be read today, almost 14 billion years later. Baryon oscillations – variations in galactic density peaking every 450 million light-years or so – descend directly from these fluctuations in the density of the early universe.

BAO is the target of the Baryon Oscillation Spectroscopic Survey. By the time it’s completed, BOSS will have measured the individual spectra of 1.5 million galaxies, a highly precise way of measuring their redshifts. The first BOSS spectroscopic results are expected to be announced early in 2012.

Meanwhile the photometric study by Ho and her colleagues deliberately uses many of the same luminous galaxies but derives redshifts from their brightnesses in different colors, extending the BAO ruler back over a previously inaccessible redshift range, from z = 0.45 to z = 0.65 (z stands for redshift).

“As an oscillatory feature in the power spectrum, not many things can corrupt or confuse BAO, which is why it is considered one of the most trustworthy ways to measure dark energy,” says Hee-Jong Seo of the Berkeley Center for Cosmological Physics at Berkeley Lab and the UC Berkeley Department of Physics, who led BAO measurement for the project. “We call BAO a standard ruler for a good reason. As dark energy stretches the universe against the gravity of dark matter, more dark energy places galaxies at a larger distance from us, and the BAO imprinted in their distribution looks smaller. As a standard ruler the true size of BAO is fixed, however. Thus the apparent size of BAO gives us an estimate of the cosmological distance to our target galaxies – which in turn depends on the properties of dark energy.”

Says Ho, “Our study has produced the most precise photometric measurement of BAO. Using data from the newly accessible redshift range, we have traced these wiggles back to when the universe was about half its present age, all the way back to z = 0.54.”

Seo adds, “And that’s to an accuracy within 4.5 percent.”

Reining in the systematics

“With such a large volume of the universe forming the basis of our study, precision cosmology was only possible if we could control for large-scale systematics,” says Ho. Systematic errors are those with a physical basis, including differences in the brightness of the sky, or stars that mimic the colors of distant galaxies, or variations in weather affecting “seeing” at the SDSS’s Sloan Telescope – a dedicated 2.5 meter telescope at the Apache Point Observatory in southern New Mexico.

After applying individual corrections to these and other systematics, the team cross-correlated the effects on the data and developed a novel procedure for deriving the best angular power-spectrum of the universe with the lowest statistical and systematic errors.

With the help of 40,000 central-processing-unit (CPU) hours at NERSC and another 20,000 CPU hours on the Riemann computer cluster at Berkeley Lab, NERSC’s powerful computers and algorithms enabled the team to use all the information from galactic clustering in a huge volume of sky, including the full shape of the power spectrum and, independently, BAO, to get excellent cosmological constraints. The data as well as the analysis output are stored at NERSC.

“Our dataset is purely imaging data, but our results are competitive with the latest large-scale spectroscopic surveys,” Ho says. “What we lack in redshift precision, we make up in sheer volume. This is good news for future imaging surveys like the Dark Energy Survey and the Large Synoptic Survey Telescope, suggesting they can achieve significant cosmological constraints even compared to future spectroscopy surveys.”

###

Animated visualizations of the luminous galaxies in the SDSS-III dataset can be accessed at http://darkmatter.ps.uci.edu/lrg-sdss.

“Clustering of Sloan Digital Sky Survey III photometric luminous galaxies: The measurement, systematics, and cosmological implications,” by Shirley Ho, Antonio Cuesta, Hee-Jong Seo, Roland de Putter, Ashley J. Ross, Martin White, Nikhil Padmanabhan, Shun Saito, David J. Schlegel, Eddie Schlafly, Uroŝ Seljak, Carlos Hernández-Monteagudo, Ariel G. Sánchez, Will J. Percival, Michael Blanton, Ramin Skibba, Don Schneider, Beth Reid, Olga Mena, Matteo Viel, Daniel J. Eisenstein, Francisco Prada, Benjamin Weaver, Neta Bahcall, Dimitry Bizyaev, Howard Brewinton, Jon Brinkman, Luiz Nicolaci da Costa, John R. Gott, Elena Malanushenko, Viktor Malanushenko, Bob Nichol, Daniel Oravetz, Kaike Pan, Nathalie Palanque-Delabrouille, Nicholas P. Ross, Audrey Simmons, Fernando de Simoni, Stephanie Snedden,and Christophe Yeche, has been submitted to Astrophysical Journal and is now available online at http://arxiv.org/abs/1201.2137.

“Acoustic scale from the angular power spectra of SDSS-III DR8 photometric luminous galaxies,” by Hee-Jong Seo, Shirley Ho, Martin White, Antonio J. Cuesta, Ashley J. Ross, Shun Saito, Beth Reid, Nikhil Padmanabhan, Will J. Percival, Roland de Putter, David J. Schlegel, Daniel J. Eisenstein, Xiaoying Xu, Donald P. Schneider, Ramin Skibba, Licia Verde, Robert C. Nichol, Dmitry Bizyaev, Howard Brewington, J. Brinkmann, Luiz Alberto Nicolai da Costa, J. Richard Gott III, Elena Malanushenko, Viktor Malanushenko, Dan Oravetz, Nathalie Palanque-Delabrouille, Kaike Pan, Francisco Prada, Nicholas P. Ross, Audrey Simmons, Fernando Simoni, Alaina Shelden, Stephanie Snedden, and Idit Zehavi, has been submitted to Astrophysical Journal and is available online at http://lakme.lbl.gov/~sheejong/Research/ANGULAR_BAO/Paper/AngularBAOfinal.pdf.

Funding for SDSS-III has been provided by the Alfred P. Sloan Foundation, the Participating Institutions, the National Science Foundation, and the U.S. Department of Energy’s Office of Science. The SDSS-III web site is http://www.sdss3.org/.

SDSS-III is managed by the Astrophysical Research Consortium for the Participating Institutions of the SDSS-III Collaboration including the University of Arizona, the Brazilian Participation Group, Brookhaven National Laboratory, University of Cambridge, Carnegie Mellon University, University of Florida, the French Participation Group, the German Participation Group, the Instituto de Astrofisica de Canarias, the Michigan State/Notre Dame/JINA Participation Group, Johns Hopkins University, Lawrence Berkeley National Laboratory, Max Planck Institute for Astrophysics, New Mexico State University, New York University, Ohio State University, Pennsylvania State University, University of Portsmouth, Princeton University, the Spanish Participation Group, University of Tokyo, University of Utah, Vanderbilt University, University of Virginia, University of Washington, and Yale University.

DOE’s Office of Science is the single largest supporter of basic research in the physical sciences in the United States, and is working to address some of the most pressing challenges of our time. For more information, please visit the Office of Science website at http://science.energy.gov/.

Lawrence Berkeley National Laboratory addresses the world’s most urgent scientific challenges by advancing sustainable energy, protecting human health, creating new materials, and revealing the origin and fate of the universe. Founded in 1931, Berkeley Lab’s scientific expertise has been recognized with 13 Nobel prizes. The University of California manages Berkeley Lab for the U.S. Department of Energy’s Office of Science. For more, visit www.lbl.gov.


Scientific contact: Shirley Ho, cwho@lbl.gov

Tuesday, January 11, 2011

Astronomers Release the Largest Image of the Sky Ever Made

SDSS-III's new image contains a wealth of information on scales both small and large. At left is the SDSS-III view of a small part of the sky, centered on the galaxy Messier 33 (M33). A zoom-in on M33 at center shows the spiral arms of this galaxy, including the blue knots of intense star formation known as H II regions. At right, a further zoom into M33 shows the object NGC 604, one of the largest H II regions in that galaxy. (From M. Blanton and SDSS-III. Zoom-in

Seattle, WA – On Tuesday, Jan. 11, the Sloan Digital Sky Survey-III (SDSS-III) released the largest digital image of the sky ever made, and it’s free to all. The image has been put together over the last decade from millions of 2.8-megapixel images, thus creating a color image of more than a trillion pixels. This terapixel image is so big and detailed that one would need 500,000 high-definition TVs to view it at its full resolution.

“This image provides opportunities for many new scientific discoveries in the years to come,” exclaims Bob Nichol, a professor at the University of Portsmouth and Scientific Spokesperson for the SDSS-III collaboration.

The new image is at the heart of new data being released by the SDSS-III collaboration at the 217th American Astronomical Society meeting in Seattle. This new SDSS-III data release, along with the previous data releases that it builds upon, gives astronomers the most comprehensive view of the night sky ever made. SDSS data have already been used to discover nearly half a billion astronomical objects, including asteroids, stars, galaxies, and distant quasars. The latest, most precise positions, colors, and shapes for all these objects are also being released today.

“This is one of the biggest giveaways in the history of science,” says Professor Mike Blanton from New York University, who is leading the data archive work in SDSS-III. Blanton and many other scientists have been working for months preparing the release of all this data. This data will be a legacy for the ages, explains Blanton, as previous ambitious sky surveys, like the Palomar Sky Survey of the 1950s, are still being used as references even today. “We expect the SDSS data to have that sort of shelf life,” comments Blanton.

The image was started in 1998 using what was then the world’s largest digital camera – a 138-megapixel imaging detector on the back of a dedicated 2.5-meter telescope at the Apache Point Observatory in New Mexico. Over the last decade, the Sloan Digital Sky Survey has scanned a third of the whole sky. Now, this imaging camera is being retired, and will be part of the permanent collection at the Smithsonian in recognition of its contributions to Astronomy.

“It’s been wonderful to see the science results that have come from this camera,” says Connie Rockosi, an astronomer from the University of California at Santa Cruz, who started working on the camera in the 1990s as an undergraduate student with Jim Gunn, Professor of Astronomy at Princeton University and SDSS-I/II Project Scientist. Rockosi’s entire career so far has paralleled the history of the SDSS camera. “It’s a bittersweet feeling to see this camera retired, because I’ve been working with it for nearly 20 years,” she says.

But what next? This enormous image has formed the basis for new surveys of the universe using the SDSS telescope. These surveys rely on spectra, an astronomical technique that uses instruments to spread the light from a star or galaxy into its component wavelengths. Spectra can be used to find the distances to distant galaxies, and the properties (such as temperature and chemical composition) of different types of stars and galaxies.

“We have upgraded the existing SDSS instruments, and we are using them to measure distances to over a million galaxies detected in this image,” explains David Schlegel, an astronomer from the U.S. Department of Energy’s Lawrence Berkeley National Laboratory and the principal investigator of the new SDSS-III Baryon Oscillation Spectroscopic Survey (BOSS). Schlegel explains that measuring distances to galaxies is more time-consuming than simply taking their pictures, but in return it provides a detailed three-dimensional map of the galaxies’ distribution in space.

BOSS started taking data in 2009 and will continue until 2014, explains Schlegel. Once finished, BOSS will be the largest 3-D map of galaxies ever made, extending the original SDSS galaxy survey to a much larger volume of the universe. The goal of BOSS is to precisely measure how so-called dark energy has changed over the recent history of the universe. These measurements will help astronomers understand the nature of this mysterious substance. “Dark energy is the biggest conundrum facing science today,” says Schlegel, “and the SDSS continues to lead the way in trying to figure out what the heck it is!”

A map of the whole sky, derived from the SDSS-III image, is divided into the northern and southern hemispheres of our Milky Way galaxy. Visible in the map are the clusters and walls of galaxies that are the largest structures in the entire universe. (From M. Blanton and SDSS-III.

In addition to BOSS, the SDSS-III collaboration has been studying the properties and motions of hundreds of thousands of stars in the outer parts of our Milky Way galaxy. The survey, known as the Sloan Extension for Galactic Understanding and Exploration – or SEGUE – started several years ago but has now been completed as part of the first year of SDSS-III.

In conjunction with the image being released today, astronomers from SEGUE are also releasing the largest map of the outer Galaxy ever released. “This map has been used to study the distribution of stars in our galaxy,” says Rockosi, the principal investigator of SEGUE. “We have found many streams of stars that originally belonged to other galaxies torn apart by the gravity of our Milky Way. We’ve long thought that galaxies evolve by merging with others; the SEGUE observations confirm this basic picture.”

SDSS-III is also undertaking two other surveys of our galaxy through 2014. The first, called MARVELS, will use a new instrument to repeatedly measure spectra for approximately 8,500 nearby stars like our own sun, looking for the tell-tale wobble caused by large Jupiter-like planets orbiting them. MARVELS is predicted to discover around a hundred new giant planets, as well as potentially finding a similar number of brown dwarfs, which are intermediate between the most massive planets and the smallest stars.

The second survey is the APO Galactic Evolution Experiment (APOGEE), which is using one of the largest infrared spectrographs ever built to undertake the first systematic study of stars in all parts of our galaxy, even stars on the other side of our galaxy beyond the central bulge. Such stars are traditionally difficult to study as their visible light is obscured by large amounts of dust in the disk of our galaxy. However, by working at longer, infrared wavelengths, APOGEE can study them in great detail, thus revealing their properties and motions to explore how the different components of our galaxy were put together.

“The SDSS-III is an amazingly diverse project built on the legacy of the original SDSS and SDSS-II surveys,” summarizes Nichol. “This image is the culmination of decades of work by hundreds of people, and has already produced many incredible discoveries. Astronomy has a rich tradition of making all such data freely available to the public, and we hope everyone will enjoy it as much as we have.”

Additional information

SDSS-III announced Data Release Eight (DR8) on Jan. 11, 2011, at the 217th meeting of the American Astronomical Society. The release can be found at http://www.sdss3.org/dr8. All data published as part of DR8 is freely available to other astronomers, scientists, and the public. Technical journal papers describing DR8 and the SDSS-III project were also released on this date on the arXiv e-Print archive.

A composite image including the zoom in to NGC 604 and the northern and southern galactic maps is available at http://tinyurl.com/2amuwcj. Larger images of the maps in the northern and southern galactic hemispheres are available at http://tinyurl.com/27tntqb and http://tinyurl.com/25z4h3e.

The SDSS-III Collaboration (http://www.sdss3.org) includes many institutions from around the globe. Funding for SDSS-III has been provided by the Alfred P. Sloan Foundation, the Participating Institutions, the National Science Foundation, and the U.S. Department of Energy’s Office of Science. The SDSS-III is managed by the Astrophysical Research Consortium for the Participating Institutions of the SDSS-III Collaboration including the University of Arizona, the Brazilian Participation Group, Brookhaven National Laboratory, University of Cambridge, University of Florida, the French Participation Group, the German Participation Group, the Instituto de Astrofísica de Canarias, the Michigan State/Notre Dame/JINA Participation Group, Johns Hopkins University, Lawrence Berkeley National Laboratory, Max Planck Institute for Astrophysics, New Mexico State University, New York University, the Ohio State University, the Penn State University, University of Portsmouth, Princeton University, the Spanish Participation Group, University of Tokyo, the University of Utah, Vanderbilt University, University of Virginia, University of Washington, and Yale University.

Scientific contacts:

Michael Blanton
New York University, 646-279-5098

Connie Rockosi
University of California Santa Cruz, 831-459-5246

David Schlegel
Lawrence Berkeley National Laboratory, 510-495-2595

Bob Nichol
University of Portsmouth, SDSS-III Scientific Spokesperson, +44 7963 792049

Jordan Raddick
SDSS-III Public Information Officer, 443-570-7105