Monday, March 31, 2008

Huge 'Peanut' Stars Share Material

Based on real data, this artist rednering shows the shape of the two stars that share material in what's now being called a yellow supergiant eclipsing binary system.
Credit: Kevin Gecsi, courtesy of Ohio State University


A pair of newfound stars orbit each other so closely that they share material, taking on the appearance of a giant peanut in space.

In fact, a second freshly examined system has the same two-lobed look. The systems were announced today and are the first and second of a new class of objects.

The first system found is 13 million light-years away — relatively close by cosmic standards — inside a small galaxy called Holmberg IX. Both stars are very bright, yellow stars about 15 times the mass of our sun. In the pair's orbital cycle, one star moves in front of the other, blocking its light from our vantage point, so astronomers see one star, then two, then one, and so on, as illustrated in a video.

The study, funded by the National Science Foundation, was published recently in Astrophysical Journal Letters. The observations were made with the Large Binocular Telescope (LBT) on Mt. Graham in Arizona.

In looking for other examples, Jose Prieto, Ohio State University graduate student and lead author on the journal paper, found another one much closer, less than 230,000 light-years away in the Small Magellanic Cloud, a small galaxy that orbits our own Milky Way. The star system had been discovered in the 1980s, but was misidentified. When Prieto re-examined the data that astronomers had recorded at the time, he saw that the pattern of light was very similar to the one they had detected in the first pair. The stars were even the same size — 15 to 20 times the mass of the sun — and melded together in the same kind of peanut shape. The system was clearly a yellow supergiant eclipsing binary, the new name given to this class of objects.

"We didn't expect to find one of these things, much less two," said Kris Stanek, associate professor of astronomy at Ohio State and a colleague in the study. "We needed the 8.4-meter LBT to spot the first binary, but the second one is so bright that you could see it with binoculars in your back yard. Yet, if we hadn't found the first one, we may never have found the second one."

The finds may help solve another mystery. Of all the supernovas that have been studied over the years, two have been linked to yellow supergiants, but theory doesn't predict any should be yellow supergiants.

Over millions of years, Prieto explained, a star will burn hotter or cooler as it consumes different chemical elements in its core. The most massive stars swing back and forth between being cool red supergiants or hot blue ones. They spend most of their lives at one end of the temperature scale or the other, but spend only a short time in-between, where they are classified as yellow. Most stars end their life in a supernova at the red end of the cycle; a few do at the blue end. But none do it during the short yellow transitional phase in between.

At least, that's what astronomers thought.

Prieto, Stanek and their colleagues suspect that yellow binary systems like the ones they found could be the progenitors of these odd yellow supernovas.

"When two stars orbit each other very closely, they share material, and the evolution of one affects the other," Prieto said. "It's possible two supergiants in such a system would evolve more slowly and spend more time in the yellow phase — long enough that one of them could explode as a yellow supergiant."

By SPACE.com Staff

Sunday, March 30, 2008

Weak Lensing Distorts the Universe

Credit: S. Colombi (IAP), CFHT Team

Is the distant universe really what it appears to be? Astronomers hope not. Intervening dark matter, which is normally invisible, might show its presence by distorting images originating in the distant universe, much the way an old window distorts images originating on the other side.

By noting the degree to which background galaxies appear unusually flat and unusually similar to neighbors, the dark matter distribution producing these weak gravitational lensing distortions can be estimated.

Analysis of the shapes of 200,000 distant galaxies imaged with the Canada-France-Hawaii Telescope (CFHT) does indicate the presence of a massive network of distributed dark matter.

Future results may even be able to discern details of the distribution. The above computer generated simulation image shows how dark matter, shown in red, distorts the light path from and apparent shape of distant galaxies, depicted in blue.

Friday, March 28, 2008

New place to seek life on Mars

A salt deposit discovered on the Red Planet points
to a new place to hunt for life's ancient traces.

Provided by the Mars Space Flight Facility


Bright blue marks a deposit of chloride (salt) minerals in the southern highlands of Mars in this THEMIS false-color image which highlights mineral composition differences. Using THEMIS, researchers have found more than 200 such features. These deposits typically lie within topographic depressions and suggest that Mars was much wetter long ago. The black rectangle shows the outline of a closeup view in the image below.
Credit: NASA/JPL/Arizona State University/University of Hawaii

Scientists using a Mars-orbiting camera designed and operated at Arizona State University's Mars Space Flight Facility have discovered the first evidence for deposits of chloride minerals, salts, in numerous places on Mars. These deposits, say the scientists, show where water was once abundant and may also provide evidence for the existence of former life on Mars.

A team of scientists led by Mikki Osterloo, of the University of Hawaii, used data from the Thermal Emission Imaging System (THEMIS) on NASA's Mars Odyssey orbiter to discover and map the Martian chloride deposits.

Developed at Arizona State University, THEMIS is a multi-wavelength camera that takes images in five visual bands and 10 infrared ones. At infrared wavelengths, the smallest details THEMIS can see on the martian surface are 330 feet (100 meters) wide.

The scientists found about 200 individual places in the martian southern hemisphere that show spectral characteristics consistent with chloride minerals. These salt deposits occur in the middle to low latitudes all around the planet within ancient, heavily cratered terrain.

Osterloo says that she found the sites by looking through thousands of THEMIS images processed to reveal, in false colors, compositional differences on the Martian surface. As she explains, "I started noting these sites because they showed up bright blue in one set of images, green in a second set, and yellow-orange in a third."

Says team member Philip Christensen, "THEMIS gives us a good look at the thermal infrared, the best part of the spectrum for identifying salt minerals by remote sensing from orbit."

When plotted on a global map of Mars, the chloride sites appeared only in the southern highlands, the most ancient rocks on Mars.

Christensen goes on to characterize the sites' geological setting. "Many of the deposits lie in basins with channels leading into them," he says. "This is the kind of feature, like salt-pan deposits on Earth, that's consistent with water flowing in over a long time."

Christensen, a Regents' Professor of Geological Sciences at ASU's School of Earth and Space Exploration in the College of Liberal Arts and Sciences, designed THEMIS and is the instrument's principal investigator.

Says Osterloo, "The deposits range in area from about one square kilometer to about 25 square kilometers," or about 0.4 square mile to about 10 square miles. She adds, "Because the deposits appear to be disconnected from each other, we don't think they all came from one big, global body of surface water." Instead, she says, "They could come from groundwater reaching the surface in low spots. The water would evaporate and leave mineral deposits, which build up over years."

The scientists think the salt deposits formed mostly in the middle to late Noachian epoch, a time that researchers have dated to about 3.9 to 3.5 billion years ago. Several lines of evidence suggest Mars then had intermittent periods of substantially wetter and warmer conditions than today's dry, frigid climate.

Up to now, scientists looking for evidence of past life on Mars have focused mainly on a handful of places that show evidence of clay or sulfate minerals. The reasoning is that clays indicate weathering by water and that sulfates may form by water evaporation.

The new research, however, suggests an alternative mineral target to explore for biological remains. Says Christensen, "By their nature, salt deposits point to a lot of water, which could potentially remain standing in pools as it evaporates." That's crucial, he says. "For life, it's all about a habitat that endures for some time."

There may also be a concentrating effect, Christensen adds. "The deposits lie in what are probably sedimentary basins. If you look upstream, you might find only a trace of organic materials because they're thinly dispersed." But over a long period of time, he explains, "The water flowing into a basin can concentrate the organic materials and they could be well preserved in the salt."

Whether or not the Red Planet ever had life is the biggest scientific question driving Mars research. On Earth, salt has proven remarkably good at preserving organic material. For example, bacteria have been revived in the laboratory after being preserved in salt deposits for millions of years.

NASA is currently studying potential landing sites for its Mars Science Laboratory (MSL), a new-generation rover due for launch in fall 2009. Sites featuring clay deposits number heavily in the short-list of candidate places to send the rover.

Christensen says, "Scientists have studied Martian clay mineral sites for years now, and it's natural they should be considered as targets for the Mars Science Laboratory rover. However, the discovery of chloride minerals in topographic basins within the oldest rocks on Mars should also be considered as an alternative mineralogy for MSL or future rovers to explore."

"This discovery demonstrates the continuing value of the Odyssey science mission, now entering its seventh year," says Jeffrey Plaut, Odyssey project scientist at the Jet Propulsion Laboratory. "The more we look at Mars, the more fascinating a place it becomes."

In a sharper view and with colors close to its natural appearance, the chloride mineral deposit looks bright in tone, like salt pans on Earth. The deposit seems to be emerging as overlying material erodes away. Inset boxes show two areas in greater detail, revealing cracks that formed as the salt deposit dried.
Credit:NASA/JPL/Arizona State University/University of Hawaii/University of Arizona

Across the Universe

Credit: NASA Swift Team, Stefan Immler (GSFC) et al.

How far can you see? Even the faintest stars visible to the eye are merely hundreds or thousands of light-years distant, all well within our own Milky Way Galaxy. Of course, if you know where to look you can also spot the Andromeda Galaxy as a pale, fuzzy cloud, around 2.5 million light-years away.

But staring toward the northern constellation Bootes on March 19th, even without binoculars or telescope you still could have witnessed a faint, brief, flash of light from a gamma-ray burst. The source of that burst has been discovered to lie over halfway across the Universe at a distance of about 7.5 billion light-years. Now holding the distinction of the most distant object that could be seen by the unaided eye and the intrinsically brightest object ever detected, the cosmic explosion is estimated to have been over 2.5 million times more luminous than the brightest known supernova.

The monster burst was identified and located by the orbiting Swift satellite, enabling rapid distance measurements and follow-up observations by large ground-based telescopes. The fading afterglow of the gamma-ray burster, cataloged as GRB080319B, is shown in these two panels in X-rays (left) and ultraviolet light (right).

Wednesday, March 26, 2008

Cassini Tastes Organic Material at Saturn's Geyser Moon

Credit:NASA/JPL/GSFC/SwRI/SSI
Heat radiating from the entire length of 150 kilometer (95 mile)-long fractures is seen in this best-yet heat map of the active south polar region of Enceladus.

Credit:NASA/JPL/University of Colorado/SSI
New structure, density and composition measurements of Enceladus’ water plume were obtained when the Cassini spacecraft’s Ultraviolet Imaging Spectrograph observed the star zeta Orionis pass behind the plume Oct. 24, 2007, as seen in this animation.

NASA's Cassini spacecraft tasted and sampled a surprising organic brew erupting in geyser-like fashion from Saturn's moon Enceladus during a close flyby on March 12. Scientists are amazed that this tiny moon is so active, "hot" and brimming with water vapor and organic chemicals.

New heat maps of the surface show higher temperatures than previously known in the south polar region, with hot tracks running the length of giant fissures. Additionally, scientists say the organics "taste and smell" like some of those found in a comet. The jets themselves harmlessly peppered Cassini, exerting measurable torque on the spacecraft, and providing an indirect measure of the plume density.

"A completely unexpected surprise is that the chemistry of Enceladus, what's coming out from inside, resembles that of a comet," said Hunter Waite, principal investigator for the Cassini Ion and Neutral Mass Spectrometer at the Southwest Research Institute in San Antonio. "To have primordial material coming out from inside a Saturn moon raises many questions on the formation of the Saturn system."

"Enceladus is by no means a comet. Comets have tails and orbit the sun, and Enceladus' activity is powered by internal heat while comet activity is powered by sunlight. Enceladus' brew is like carbonated water with an essence of natural gas," said Waite.

The Ion and Neutral Mass Spectrometer saw a much higher density of volatile gases, water vapor, carbon dioxide and carbon monoxide, as well as organic materials, some 20 times denser than expected. This dramatic increase in density was evident as the spacecraft flew over the area of the plumes.

New high-resolution heat maps of the south pole by Cassini's Composite Infrared Spectrometer show that the so-called tiger stripes, giant fissures that are the source of the geysers, are warm along almost their entire lengths, and reveal other warm fissures nearby. These more precise new measurements reveal temperatures of at least minus 93 degrees Celsius (minus 135 Fahrenheit.) That is 17 degrees Celsius (63 degrees Fahrenheit) warmer than previously seen and 93 degrees Celsius (200 degrees Fahrenheit) warmer than other regions of the moon. The warmest regions along the tiger stripes correspond to two of the jet locations seen in Cassini images.

"These spectacular new data will really help us understand what powers the geysers. The surprisingly high temperatures make it more likely that there's liquid water not far below the surface," said John Spencer, Cassini scientist on the Composite Infrared Spectrometer team at the Southwest Research Institute in Boulder, Colo.

Previous ultraviolet observations showed four jet sources, matching the locations of the plumes seen in previous images. This indicates that gas in the plume blasts off the surface into space, blending to form the larger plume.

Images from previous observations show individual jets and mark places from which they emanate. New images show how hot spot fractures are related to other surface features. In future imaging observations, scientists hope to see individual plume sources and investigate differences among fractures.

"Enceladus has got warmth, water and organic chemicals, some of the essential building blocks needed for life," said Dennis Matson, Cassini project scientist at NASA's Jet Propulsion Laboratory in Pasadena, Calif. "We have quite a recipe for life on our hands, but we have yet to find the final ingredient, liquid water, but Enceladus is only whetting our appetites for more."

At closest approach, Cassini was only 30 miles from Enceladus. When it flew through the plumes it was 120 miles from the moon's surface. Cassini's next flyby of Enceladus is in August.

The Cassini-Huygens mission is a cooperative project of NASA, the European Space Agency and the Italian Space Agency. The mission is managed by JPL for NASA's Science Mission Directorate, Washington.

Source: NASA/JPL

Contacts: Carolina Martinez 818-354-9382
Jet Propulsion Laboratory, Pasadena,
Calif. carolina.martinez@jpl.nasa.gov

Dwayne Brown 202-358-1726

Headquarters, Washington
dwayne.c.brown@nasa.gov

Cosmic Searchlights Reveal "Lost" Galaxies

Credit:NASA/JPL-Caltech/STScI/CXC/UofA/ESA/AURA/JHU

About this image: The distant dim galaxies in this study were smaller and less massive than our galactic neighbor M82, featured in this image. However, like M82 they are undergoing intense star formation, and the explosions from massive dying stars is blowing gas and metals out of the galaxy. Outgoing gas and metals can be seen as the colorful clouds extending above and below the galaxy's central disk.

NASA's Spitzer, Hubble, and Chandra space observatories teamed up to create this multi-wavelength, false-colored view of the M82 galaxy. The lively portrait celebrates Hubble's "sweet sixteen" birthday.
X-ray data recorded by Chandra appears in blue; infrared light recorded by Spitzer appears in red; Hubble's observations of hydrogen emission appear in orange, and the bluest visible light appears in yellow-green.

Millions of faint galaxies are hovering near the edge of our universe, too dim to be detected by most telescopes -- but some huge cosmic explosions and the supersensitive infrared eyes of NASA's Spitzer Space Telescope are bringing many of these muted galaxies to light.

Located approximately 12.5 billion light-years away from Earth, the distant galaxies exist in an era when our universe was just one billion years old. With Spitzer's sensitive infrared eyes, astronomers can finally snap infrared portraits and even "weigh" many of these otherwise invisible galaxies.

"A few billion years after the big bang, 90 percent of the stars being born were occurring in these types of faint galaxies. By identifying this population, we hope to gain insights into the environments where the universe's first stars formed," says Dr. Ranga Ram Chary, of the Spitzer Science Center, Pasadena, Calif.
Finding Hidden Galaxies

How did astronomers find these elusive galaxies? Like a searchlight directing people to a high-profile event, astronomers followed an afterglow from huge explosions, called "gamma ray bursts" to the faint distant galaxies. They suspect that gamma ray bursts appear when a very massive star dies and becomes a black hole.

Gamma ray bursts are fleeting events -- lasting anywhere from a fraction of a second, to a few minutes. This is not enough time for astronomers to directly identify their source. However, as the gamma ray light fades, a lingering afterglow can be seen at other wavelengths of light. In fact, Chary's team used ground-based telescopes to follow the infrared afterglow from several of these events back to their dim host galaxies, months after the initial explosions occurred.

The afterglow occurs when energetic electrons spiral around magnetic fields, and release light. In its explosive death, material shooting out of the massive star smashes into surrounding gas. This violent collision heats nearby gas and energizes its electrons.

Once coordinates of the faint galaxies were determined, Chary's team then used Spitzer's supersensitive infrared array camera to snap a picture of the faint galaxy. The amount of light from the galaxies allowed Chary to weigh the galaxies. They found these distant galaxies were cosmic "lightweights", or not very massive compared to mature galaxies we see nearby.

"Understanding the mass and chemical makeup of the universe's first galaxies and then taking snapshots of galaxies at different ages, gives us a better idea of how gas, dust and metals-- the material that went into making our Sun, solar system, and Earth --has changed throughout the Universe's history," says Chary.

Unlike the galaxies of today, Chary says that galaxies living in the one billion year old universe were much more pristine -- comprised primarily of hydrogen and helium gas and containing less than 10% of the heavier elements we see in the local Universe, and even on Earth. The stars that formed and lived in these galaxies eventually forged heavier chemical elements in their cores. In death, the stars spit their chemical creations into space. Some of that material went into making another generation of stars and eventually planets in the galaxies while a fraction of the metals were ejected entirely out of the galaxy.

Chary's paper was published in the December 10, 2007 issue of the Astrophysical Journal. Co-authors on this paper include Dr. Edo Berger, of Princeton University, Princeton, NJ, and Dr. Len Cowie, of the University of Hawaii.

Written by Linda Vu, Spitzer Science Center

Thursday, March 20, 2008

Action replay of powerful stellar explosion

Credits: Chandra: NASA/ CXC/ Princeton/ C.Badenes et al.
MCELS: NOAO/ AURA/ NSF/ S.Points, C.Smith & MCELS team
Light echo: NOAO/ CTIO/ Harvard/ A.Rest et al.

About this image: This combination of X-ray and optical images shows the aftermath of a powerful supernova explosion in the Large Magellanic Cloud (LMC), a small galaxy about 160 000 light-years from Earth.

The debris from this explosion, the supernova remnant SNR 0509-67.5, is shown in a Chandra X-ray Observatory image (upper inset), where the lowest energy X-rays are shown in red, the intermediate energies are green and the highest energies are blue. In 2004, scientists used Chandra to show that SNR 0509-67.5 was likely caused by a Type Ia supernova, using an analysis of the elements, such as silicon and iron that were detected. A Type Ia is thought to result from a white dwarf star in a binary system that reaches a critical mass and explodes.

The light echo image (lower inset), from the Cerro Tololo Inter-American Observatory (CTIO) 4-m telescope, shows light from the original supernova explosion that has bounced off dust clouds in the neighbouring regions of the LMC (the light echoes are shown in blue and stars in orange). The light from these echoes travels a longer path than the light that travels straight toward us, and so can be seen hundreds of years after the supernova itself. This image is one of a sequence of five images taken between 2001 and 2006 that are shown separately in a time-lapse movie.

The large optical image is from the Magellanic Cloud Emission Line Survey (MCELS), obtained with the 0.9m telescope at CTIO. Emission lines of hydrogen (H-alpha) are red, singly-ionised sulphur is green and doubly-ionised oxygen is blue. The image highlights regions of star formation in the LMC, including supernova remnants and giant structures carved out by multiple supernovas.

For the first time astronomers have used two methods - X-ray observations of a supernova remnant and optical observations of the expanding light echoes from the explosion - to estimate the energy of a supernova blast. In two separate papers, astronomers concluded that the supernova occurred about 400 years ago (in Earth's time frame), and was unusually bright and energetic. This is the best ever determination of the power of a supernova explosion long after it was visible from Earth.

In the new optical study, spectra of the light echo, obtained from the Gemini Observatory, were used to confirm that the supernova was a Type Ia and to unambiguously determine the particular class of explosion and therefore its energy. In the new X-ray study, spectra from Chandra and ESA's XMM-Newton Observatory were then independently used to calculate the amount of energy involved in the original explosion, using an analysis of the supernova remnant and state-of-the-art explosion models.

The X-ray work also concluded that the explosion was an especially energetic and bright variety of Type Ia supernova, confirming the validity of the explosion models.

Astronomers have made the best ever determination of the power of a supernova explosion that was visible from Earth long ago. By observing the remnant of a supernova and a light echo from the initial outburst, they have established the validity of a powerful new method for studying supernovas.

Using data from NASA's Chandra X-ray Observatory, ESA's XMM-Newton Observatory, and the Gemini Observatory, two teams of researchers studied the supernova remnant and its light echo, located in the Large Magellanic Cloud (LMC), a small galaxy about 160 000 light-years from Earth. They concluded that the supernova occurred about 400 years ago (in Earth’s time frame), and was unusually bright and energetic.

This result is the first time two methods - X-ray observations of a supernova remnant and optical observations of the expanding light echoes from the explosion - have both been used to estimate the energy of a supernova explosion. Up until now, scientists had only made such an estimate using the light seen soon after a star exploded, or using remnants that are several hundred years old, but not from both.

"People didn't have advanced telescopes to study supernovas when they went off hundreds of years ago," said Armin Rest of Harvard University, who led the light echo observations using Gemini. "But we've done the next best thing by looking around the site of the explosion and constructing an action replay of it."

The explosion's energy was estimated by studying an echo of the original light of the explosion. Just as sound bounces off walls of a canyon, so too can light waves create an echo by bouncing off dust clouds in space. The light from these echoes travels a longer path than the light that travels straight toward us, and so can be seen hundreds of years after the supernova itself.

First seen by the Cerro-Tololo Inter-American Observatory in Chile, the light echoes were observed in greater detail by Gemini Observatory in Chile. The optical spectra of the light echo were used to confirm that the supernova was a Type Ia and to unambiguously determine the particular class of explosion and therefore its energy.

The Chandra data, along with XMM-Newton data obtained in 2000, was then independently used to calculate the amount of energy involved in the original explosion, using an analysis of the supernova remnant and state-of-the-art explosion models. Their conclusion confirmed the results from the optical data, namely that the explosion was an especially energetic and bright variety of Type Ia supernova. This agreement provides strong evidence that the detailed explosion models are accurate.

Credits: ESA
An assembly of 51 mirrors, carefully sized, formed and nested one inside another, makes XMM-Newton the most sensitive X-ray telescope ever built. ESA's XMM-Newton derives its name from its X-ray multi-mirror design and honours Sir Isaac Newton. This unique X-ray observatory was launched by Ariane 5 from the European spaceport in French Guiana on 10 December 1999.

"Having these two methods agree lets us breathe a sigh of relief," said Carlos Badenes of Princeton University who led the Chandra and XMM-Newton study. "It looks like we're on the right track with trying to understand these big explosions. Their stellar debris really can retain a memory of what created them hundreds of years earlier."

Both methods estimated a similar time since the explosion of about 400 years. An extra constraint on the age comes from the lack of recorded historical evidence for a recent supernova in the LMC. Because this star appears in the southern hemisphere, it likely would have been seen by navigators who noted similarly bright celestial events if it had occurred less than about 400 years ago.

Because Type Ia supernovas have nearly uniform intrinsic brightness, they are used as important tools by scientists to study the expansion of the universe and the nature of dark energy.

"It's crucial to know that the basic assumptions about these explosions are correct, so they're not used just as black-boxes to measure distances," said Badenes.

This work is also being extended to other supernova remnants and light echoes.

"This is the first case where the conclusions that are drawn from the supernova remnant about the original explosion can be directly tested by looking at the original event itself," said Rest. "We'll be able to learn a lot about supernovas in our own galaxy by using this technique."

Notes for editors:

These results appear in two papers recently accepted in The Astrophysical Journal. The first discusses the spectrum obtained by Gemini, led by Rest. The second, with Badenes as first author, details the Chandra and XMM observations of SNR 0509-67.5.

XMM-Newton, ESA’s space-borne X-ray observatory is the biggest scientific satellite ever built in Europe. Its telescope mirrors are the most sensitive ever developed in the world, and with its sensitive detectors, it sees much more than any previous X-ray satellite.

XMM-Newton science operations are handled at ESA’s European Space and Astronomy Centre (ESAC). The satellite was designed and built to return data for at least a decade. It has detected more X-ray sources than any previous satellite and is helping solve many cosmic mysteries of the violent Universe, from what happens in and around black holes to the formation of galaxies in the early Universe. The satellite uses over 170 wafer-thin cylindrical mirrors spread over three telescopes.

Its orbit takes it almost a third of the way to the Moon, so that astronomers can enjoy long, uninterrupted views of celestial objects. NASA's Marshall Space Flight Center, Alabama, USA manages the Chandra program for the agency's Science Mission Directorate. The Smithsonian Astrophysical Observatory controls science and flight operations from the Chandra X-ray Center in Massachusetts, USA.

Looking for Water on Mars

(A) CRISM spectra from several images compared to lab spectra of clay minerals, (B) mineral indicator map of CRISM image 43EC (~10 km across) draped over MOLA terrain with 10X vertical exaggeration where several of the spectra were collected, and (C) a HiRISE image showing the transition from the smectite we see in many regions to hydrated silica we see surrounding this on the higher edges.

The Nili Fossae are valleys that have cut into the ancient crust of Mars,
exposing clay minerals.

Credit: NASA/JPL/University of Arizona

We are investigating the surface mineralogy of Mars in order to provide clues to its geologic history including when and where the water was present. The Compact Reconnaissance Imaging Spectrometer for Mars (CRISM) is currently flying on the Mars Reconnaissance Orbiter (MRO) and collecting multiple new images of Mars each day.

CRISM is mapping Mars with 100-200 meters/pixel images with 72 channels across the visible and near-infrared wavelength region. CRISM is also collecting a few more detailed images of targeted spots each day at 18 m/pixel with 544 channels. CRISM is expanding the mineral identifications made on Mars with the European Mars Express/OMEGA (Observatoire pour la Mineralogie, L'Eau, les Glaces et l'Activite) at 300-1500 m/pixel surface resolution. The High Resolution Imaging Science Experiment (HiRISE) camera on MRO is taking pictures at submeter resolution, which can be combined with the spectral data from CRISM and OMEGA to gain information about the surface textures.

Our group is working on identification of clay minerals in CRISM images as these minerals tell us about water on Mars. Clay minerals typically form in marine sediments. They also form as volcanic ash and tephra are altered in the presence of water. Hydrothermal activity produces clay minerals as well. We are finding clays in the most ancient terrains that formed 4 billion years ago on Mars. These indicate that there were widespread bodies of neutral water on Mars at that time. Two regions on Mars that show high abundances of these clay minerals are called Mawrth Valles and Nili Fossae. Both are under consideration as landing sites for future missions, including the Mars Science Lab (MSL).

The Mawrth Vallis region contains one of the largest and most diverse outcrops of clays. Detailed analyses of the CRISM spectra in this region indicate the presence of expansive deposits of clays called smectites, as well as smaller outcrops of kaolinite, hydrated silica and mica. Smectite clays are also common in California. They expand readily to accept more water and contract making huge cracks when the ground dries. These are likely the clays responsible for shifting our homes here in California during wet and dry seasons so that our doors don't close properly. They also tend to make the ground very hard and are the reason why we need to add soil amendments to our gardens to make most plants grow well.

Reflectance spectra exhibit dips or "bands" due to absorption of energy at the frequency of molecular vibrations for species of interest. For detection of clay minerals, we are investigating absorptions due to water and OH in the mineral structure. The frequencies of these mineral absorption bands depend on the mineral structure and which metal cations (Fe, Mg, Al) are bound to the molecules. We match spectra from CRISM to spectra of minerals in the lab in order to identify the specific types of clay minerals present as shown in Figure 1 A below. We plot certain combinations of channels from the CRISM image to generate mineral indicator maps as shown in Figure 1 B. Here the Fe/Mg-smectite is orange, the Al-phyllosilicate is blue, and the hydrated silica/mica is green. We also use HiRISE images to look in more detail at specific locations. An example is shown in Figure 1C where we see a transition from the Fe/Mg smectite at the bottom left to the Al-phyllosilicate and hydrated silica material at the upper right.

The identification of clay minerals on Mars with CRISM and OMEGA implies liquid water was present on Mars. These clay layers are very old and were buried long ago by mantles of volcanic material. We see the clays under this layer in places where the volcanic material has been eroded away. We continue to search for more pockets of these clays that are visible on the surface in order to gain an understanding of the extent and character of the clay deposits and the aqueous events that created them. We're following the water on Mars in the search for evidence of life.

By Janice L. Bishop
Carl Sagan Center, SETI Institute

Space.com

Wednesday, March 19, 2008

Hubble Finds First Organic Molecule on an Exoplanet

Science Credit: NASA, ESA, and M. Swain (Jet Propulsion Laboratory)
Artwork Credit: NASA, ESA, and G. Bacon (STScI)


NASA's Hubble Space Telescope (HST) has made the first detection ever of an organic molecule in the atmosphere of a Jupiter-sized planet orbiting another star. This breakthrough is an important step in eventually identifying signs of life on a planet outside our solar system.

The molecule found by Hubble is methane, which under the right circumstances can play a key role in prebiotic chemistry — the chemical reactions considered necessary to form life as we know it.

This discovery proves that Hubble and upcoming space missions, such as NASA's James Webb Space Telescope, can detect organic molecules on planets around other stars by using spectroscopy, which splits light into its components to reveal the "fingerprints" of various chemicals.

"This is a crucial stepping stone to eventually characterizing prebiotic molecules on planets where life could exist," said Mark Swain of NASA's Jet Propulsion Laboratory (JPL), Pasadena, Calif., who led the team that made the discovery. Swain is lead author of a paper appearing in the March 20 issue of Nature.

The discovery comes after extensive observations made in May 2007 with Hubble's Near Infrared Camera and Multi-Object Spectrometer (NICMOS). It also confirms the existence of water molecules in the planet's atmosphere, a discovery made originally by NASA's Spitzer Space Telescope in 2007. "With this observation there is no question whether there is water or not — water is present," said Swain.

The planet now known to have methane and water is located 63 light-years away in the constellation Vulpecula. Called HD 189733b, the planet is so massive and so hot it is considered an unlikely host for life. HD 189733b, dubbed a "hot Jupiter," is so close to its parent star it takes just over two days to complete an orbit. These objects are the size of Jupiter but orbit closer to their stars than the tiny innermost planet Mercury in our solar system. HD 189733b's atmosphere swelters at 1,700 degrees Fahrenheit, about the same temperature as the melting point of silver.

Though the star-hugger planet is too hot for life as we know it, "this observation is proof that spectroscopy can eventually be done on a cooler and potentially habitable Earth-sized planet orbiting a dimmer red dwarf–type star," Swain said. The ultimate goal of studies like these is to identify prebiotic molecules in the atmospheres of planets in the "habitable zones" around other stars, where temperatures are right for water to remain liquid rather than freeze or evaporate away.

The observations were made as the planet HD 189733b passed in front of its parent star in what astronomers call a transit. As the light from the star passed briefly through the atmosphere along the edge of the planet, the gases in the atmosphere imprinted their unique signatures on the starlight from the star HD 189733.

The astronomers were surprised to find that the planet has more methane than predicted by conventional models for "hot Jupiters." "This indicates we don't really understand exoplanet atmospheres yet," said Swain.

"These measurements are an important step to our ultimate goal of determining the conditions, such as temperature, pressure, winds, clouds, etc., and the chemistry on planets where life could exist. Infrared spectroscopy is really the key to these studies because it is best matched to detecting molecules," said Swain.

Swain's co-authors on the paper include Gautam Vasisht of JPL and Giovanna Tinetti of University College, London/European Space Agency.

Location of HD 189733 on the Sky

Credit: NASA, ESA, A. Fujii, and Z. Levay (STScI)

Methane Absorption Spectrum

Credit: NASA, ESA, and A. Feild (STScI)

Methane Absorption by the Atmosphere of Extrasolar Planet 189733b

Credit: NASA, ESA, and A. Feild (STScI)

Rings Aglow

Credit: NASA/JPL/Space Science Institute

Saturn's softly glowing rings shine in scattered sunlight.

The B ring presents a remarkable difference in brightness between the near and far arms (bottom and top of the image, respectively). The strong variation in brightness could be due to the presence of wake-like features in the B ring.

See Expanse of Ice for a labeled Cassini map of the rings.

This view looks toward the unilluminated side of the rings from about 5 degrees above the ringplane. Images taken using red, green and blue spectral filters were combined to create this natural color view. The images were acquired at a distance of approximately 574,000 kilometers (357,000 miles) from Saturn. At the center of the image, the Sun-ring-spacecraft, or phase, angle is 114 degrees, and the image scale is 34 kilometers (21 miles) per pixel in the radial, or outward from Saturn, direction.

The Cassini-Huygens mission is a cooperative project of NASA, the European Space Agency and the Italian Space Agency. The Jet Propulsion Laboratory, a division of the California Institute of Technology in Pasadena, manages the mission for NASA's Science Mission Directorate, Washington, D.C. The Cassini orbiter and its two onboard cameras were designed, developed and assembled at JPL. The imaging operations center is based at the Space Science Institute in Boulder, Colo.

For more information about the Cassini-Huygens mission visit http://saturn.jpl.nasa.gov . The Cassini imaging team homepage is at http://ciclops.org .

Monday, March 17, 2008

Galatic Plane in Cygnus

Credit: MSX

Cygnus, also known as the northern cross, is a constellation in the northern hemisphere. This image shows the galactic plane as it cuts through a portion of the constellation. The glowing filaments are clouds of dust and gas between the stars. The bright compact regions are areas of star formation.

For this false-color Midcourse Space Experiment (MSX) composite, the 8.28 µm band was mapped to the blue channel, the green channel is a combination of the 12.13 µm band and the 14.65 µm band, and the 21.3 µm band was mapped to the red channel. This image covers about 6.5 x 4.5 degrees in the sky.

Infrared Legacy

Friday, March 14, 2008

The Mercury You've Never Seen

MESSENGER snapped these 36 images as part of a mosaic revealing the crescent Mercury seen by the spacecraft as it approached. MESSENGER acquired the lower left image first, some 55 minutes before the spacecraft swooped within 125 miles (200 km) of the surface. The name under each of these context images represents the time elapsed (in seconds) since the mission's launch. Credit: NASA/JHUAPL/CIW

Planetary scientists are starting to make sense out of the 500 megabytes of data returned by the MESSENGER spacecraft during its January 14 flyby of Mercury.

Thirty-three years ago, the Mariner 10 spacecraft made its third and final flyby of Mercury. Most of what we know about the innermost planet came from those three tours. The problem: Due to a quirk of its orbital geometry, Mariner 10 imaged just 45 percent of Mercury.

The MESSENGER spacecraft is beginning to fill in the rest of the picture. MESSENGER — short for MErcury Surface, Space ENvironment, GEochemistry, and Ranging — zipped past Mercury January 14. It didn't zip quite the way scientists anticipated, however. On Monday, at the 39th Lunar and Planetary Science Conference in Houston, David Smith of NASA's Goddard Space Flight Center announced that Mercury perturbed MESSENGER's path more than expected. The result means Mercury's mass has a slightly different distribution than what scientists deduced from Mariner 10.

Smith's was one of more than a dozen reports on MESSENGER delivered at the conference. Louise Prockter of Johns Hopkins University Applied Physics Laboratory described the imaging results. She says MESSENGER imaged 21 percent of the planet that hadn't been seen before, raising the total observed to 66 percent.

Thomas Watters of the Center for Earth and Planetary Studies at the Smithsonian Institution's National Air and Space Museum confirmed preliminary MESSENGER findings that "lobate scarps" — cliffs created by crustal faulting — are Mercury's dominant tectonic feature. One scarp, dubbed "Beagle Rupes," extends more than 375 miles (600 kilometers). The new images also show many of the scarps seen by Mariner 10 are longer than thought.

Watters also said the longest lobate scarps concentrate in Mercury's southern hemisphere, and MESSENGER seems to have found slightly more such scarps in equal-sized areas than did Mariner 10. Watters still thinks the scarps formed when Mercury contracted early in its history — but that it might have contracted more than scientists originally believed.

As the MESSENGER team tries to unravel Mercury's many mysteries, they await another big dose of data. In October, the spacecraft returns to Mercury for another visit, and will see the opposite hemisphere on display in January. These and a third flyby in September 2009 will serve as prelude to when MESSENGER begins orbiting Mercury in March 2011. Expect to hear plenty more about the still-enigmatic inner planet for years to come.

Richard Talcott
www.astronomy.com
Release March 11, 2008

Thursday, March 13, 2008

Spitzer Finds Organics and Water Where New Planets May Grow

ssc2008-06c: Protoplanetary Disk
Credit: NASA/JPL-Caltech

This artist's concept shows a very young star encircled by a disk of gas and dust, the raw materials from which rocky planets such as Earth are thought to form.

Researchers using NASA's Spitzer Space Telescope have discovered large amounts of simple organic gases and water vapor in a possible planet-forming region around an infant star, along with evidence that these molecules were created there. They've also found water in the same zone around two other young stars.

By pushing the telescope's capabilities to a new level, astronomers now have a better view of the earliest stages of planetary formation, which may help shed light on the origins of our own solar system and the potential for life to develop in others.

John Carr of the Naval Research Laboratory, Washington, and Joan Najita of the National Optical Astronomy Observatory, Tucson, Ariz., developed a new technique using Spitzer's infrared spectrograph to measure and analyze the chemical composition of the gases within protoplanetary disks. These are flattened disks of gas and dust that encircle young stars. Scientists believe they provide the building materials for planets and moons and eventually, over millions of years, evolve into orbiting planetary systems like our own.

"Most of the material within the disks is gas," said Carr, "but until now it has been difficult to study the gas composition in the regions where planets should form. Much more attention has been given to the solid dust particles, which are easier to observe."

In their project, Carr and Najita took an in-depth look at the gases in the planet-forming region in the disk around the star AA Tauri. Less than a million years old, AA Tauri is a typical example of a young star with a protoplanetary disk.

With their new procedures, they were able to detect the minute spectral signatures for three simple organic molecules--hydrogen cyanide, acetylene and carbon dioxide--plus water vapor. In addition, they found more of these substances in the disk than are found in the dense interstellar gas called molecular clouds from which the disk originated. "Molecular clouds provide the raw material from which the protoplanetary disks are created," said Carr. "So this is evidence for an active organic chemistry going on within the disk, forming and enhancing these molecules."

Spitzer's infrared spectrograph detected these same organic gases in a protoplanetary disk once before. But the observation was dependent on the star's disk being oriented in just the right way. Now researchers have a new method for studying the primordial mix of gases in the disks of hundreds of young star systems.

Astronomers will be able to fill an important gap--they know that water and organics are abundant in the interstellar medium but not what happens to them after they are incorporated into a disk. "Are these molecules destroyed, preserved or enhanced in the disk?" said Carr. "Now that we can identify these molecules and inventory them, we will have a better understanding of the origins and evolution of the basic building blocks of life--where they come from and how they evolve." Carr and Najita's research results appear in the March 14 issue of Science.

Taking advantage of Spitzer's spectroscopic capabilities, another group of scientists looked for water molecules in the disks around young stars and found them--twice. "This is one of the very few times that water vapor has been directly shown to exist in the inner part of a protoplanetary disk--the most likely place for terrestrial planets to form," said Colette Salyk, a graduate student in geological and planetary sciences at the California Institute of Technology in Pasadena. She is the lead author on a paper about the results in the March 20 issue of Astrophysical Journal Letters.

Salyk and her colleagues used Spitzer to look at dozens of young stars with protoplanetary disks and found water in many. They honed in on two stars and followed up the initial detection of water with complementary high-resolution measurements from the Keck II Telescope in Hawaii. "While we don't detect nearly as much water as exists in the oceans on Earth, we see essentially only the disk's surface, so the implication is that the water is quite abundant," said Geoffrey Blake, professor of cosmochemistry and planetary sciences at Caltech and one of the paper's co-authors.

"This is a much larger story than just one or two disks," said Blake. "Spitzer can efficiently measure these water signatures in many objects, so this is just the beginning of what we will learn."

"With upcoming Spitzer observations and data in hand," Carr added, "we will develop a good understanding of the distribution and abundance of water and organics in planet-forming disks."

NASA's Jet Propulsion Laboratory, Pasadena, Calif., manages the Spitzer Space Telescope mission for NASA's Science Mission Directorate, Washington. Science operations are conducted at the Spitzer Science Center at Caltech, also in Pasadena. Caltech manages JPL for NASA.

The National Optical Astronomy Observatory, Tucson, Ariz., is operated by the Association of Universities for Research in Astronomy, under a cooperative agreement with the National Science Foundation. The W.M. Keck Observatory is funded by Caltech, the University of California and NASA, and is managed by the California Association for Research in Astronomy, Kamuela, Hawaii.

ssc2008-06a: Spectrum AA Tauri
Credit: NASA/JPL-Caltech/Naval Research Laboratory

This plot of infrared data shows the signatures of water vapor and simple organic molecules in the disk of gas and dust surrounding a young star.

The data on the top line were captured by NASA's Spitzer Space Telescope's spectrograph, which collects light and sorts it according to color, or wavelength. In this case, infrared light from gases around the star AA Tauri was broken up into the wavelengths listed on the horizontal axis of the plot. The sharp spikes are called spectral lines, and each molecule has its own unique pattern, much like a fingerprint. The pattern of spikes reveals the signature of water vapor along with carbon dioxide, hydrogen cyanide, and acetylene--some of the basic building blocks of life.

By comparing the observed data with a model, shown on the lower line, astronomers can determine the physical and chemical details of the region. The model is constructed by adjusting the relative spectral contributions of each chemical component until the theoretical line matches the observed data. The calculations that went into the model provide information on how much of a given material is present, what its temperature is and how much area it covers.

ssc2008-06b: Spectrum AS 205N
Credit: NASA/JPL-Caltech

This plot of infrared data shows the strong signature of water vapor in the disk of gas and dust surrounding a young star.

The data on the top line were captured by NASA's Spitzer Space Telescope's spectrograph, which collects light and sorts it according to color, or wavelength. In this case, infrared light from gases around the star AS 205 N was broken up into the wavelengths listed on the horizontal axis of the plot. The sharp spikes are called spectral lines, and each molecule has its own unique pattern, much like a fingerprint. The pattern of spikes reveals the signature of water vapor, along with smaller amounts of carbon dioxide and hydroxyl.

By comparing the observed data with a model, shown on the lower line, astronomers can determine the physical and chemical details of the region. The model is constructed by adjusting the relative spectral contributions of each chemical component until the theoretical line matches the observed data. The calculations that went into the model provide information on how much of a given material is present, what its temperature is and how much area it covers.

Rosemary Sullivant 818-354-2274
Jet Propulsion Laboratory, Pasadena, Calif.

Wednesday, March 12, 2008

An Oxygen Factory in a Nearby Galaxy

Credit NASA/CXC/NCSU/K.J.Borkowski et al.

This Chandra X-ray Observatory image shows the debris of a massive star explosion in the Large Magellanic Cloud, a small galaxy about 160,000 light years from Earth. The supernova remnant (SNR) shown here, N132D, is the brightest in the Magellanic clouds, and belongs to a rare class of oxygen-rich remnants. Most of the oxygen that we breathe on Earth is thought to have come from explosions similar to this one.

The colors in this image show low energy X-rays (red), intermediate energy X-rays (green) and high energy X-rays (blue). Substantial amounts of oxygen are detected in this image, particularly in the green regions near the center of the image. The location of these oxygen-rich areas, detected in the Chandra image, is generally well matched with the oxygen-rich areas detected in Hubble Space Telescope images (not shown here). However, the expanding, ellipse-shaped shell of oxygen seen in N132D is not seen in either G292.0+1.8 or Puppis A, two oxygen-rich SNRs in the galaxy with similar ages to N132D (about 3,000 years, ten times older than Cas A). The origin of this shell is unknown, but it might have been created by a `nickel bubble' shortly after the supernova explosion, caused by radioactive energy input from nickel that was created by the explosion. The existence of such bubbles is predicted by theoretical work.

The ultimate goal of these observations is to constrain the mass of the star that exploded and to learn more about how massive stars explode and spread heavy elements like oxygen into surrounding space.

Chandra

Tuesday, March 11, 2008

Mysterious Craters Seen on Mercury

The two craters at the bottom of the frame are located in Mercury's giant Caloris Basin, a thousand mile wide depression formed billions of years ago when Mercury collided with a comet or asteroid. For scale, the larger of the two is about 40 miles wide. Both craters have dark rims or "halos" and the one on the left is partially filled with an unknown shiny material. Credit: NASA

Craters come in all shapes and sizes, some more bizarre than others. Recent photos of Mercury have revealed two new categories of crater that scientists are puzzling over how to explain.

When NASA's MESSENGER spacecraft flew by the planet Jan. 14 it snapped pictures of several craters with strange dark halos and one crater with a spectacularly shiny bottom.

"The halos are really exceptional," said MESSENGER science team member Clark Chapman of the Southwest Research Institute in Boulder, Colorado. "We've never seen anything like them on Mercury before and their formation is a mystery."

Two of the craters are located in Mercury's giant Caloris Basin, a thousand-mile-wide depression formed billions of years ago when Mercury was struck by a comet or asteroid. The larger of the two is about 40 miles wide. Both craters have dark rims or "halos," and one is partially filled with an unknown shiny material.

Chapman offered two possible explanations for the halos:

1. The Layer Cake Theory: There could be a layer of dark material under the surface of Caloris Basin, resulting in chocolate-colored rims around craters that penetrate to just the right depth. If such a subterranean layer exists, however, it cannot be unique to the Basin. "We've found a number of dark halos outside of Caloris as well."

2. The Impact Glass Model: Thermal energy from the impacts melted some of Mercury's rocky surface. Perhaps molten rock splashed to the edge of the craters where it re-solidified as a dark, glassy substance. Similar "impact melts" are found around craters on Earth and the moon. If this hypothesis is correct, future astronauts on Mercury exploring the crater rims would find themselves crunching across fields of tiny glass shards.

Chapman noted that the moon also has some dark haloed craters. "Tycho is a well-known example," he said. But lunar halos tend to be subtle and/or fragmentary. "The ones we see on Mercury are much more eye-catching and distinct."

The difference may be gravity. Lunar gravity is low. Any dark material flying out of a crater on the moon travels a great distance, spreading out in a diffusion that can be difficult to see. The surface gravity of Mercury, on the other hand, is more than twice as strong as the moon's. On Mercury, debris can't fly as far; it lands in concentrated form closer to the impact site where it can catch the attention of the human eye.

None of these explanations account for the shiny-bottomed crater.

"That is an even bigger mystery," Chapman said. Superficially, the bright patch resembles an expanse of ice glistening in the sun, but that's not possible. The surface temperature of the crater at the time of the photo was around 400 degrees Celsius. Perhaps the shiny material is part of another subsurface layer, bright mixed with dark; that would be the Marbled Layer Cake Theory.

"I haven't heard any really convincing explanations from our science team," he said. "We don't yet know what the material is, why it is so bright, or why it is localized in this particular crater."

Fortunately, MESSENGER may have gathered the data researchers need to solve the puzzle. Spectrometers onboard the spacecraft scanned the craters during the flyby; the colors they measured should eventually reveal the minerals involved.

"The data are still being calibrated and analyzed," Chapman said.

If they don't solve the mystery, scientists hope MESSENGER's two upcoming flybys — one in Oct. 2008 and another in Sept. 2009 — will do the trick.

Eventually, Chapmain said, "we'll get to the bottom of this mystery," and probably many more mysteries yet to be revealed.


Friday, March 07, 2008

Avalanches on Mars

Amazingly, this HiRISE image has captured at least four Martian avalanches,
or debris falls, in action.
Credit: NASA/JPL-Caltech/University of Arizona

Falling debris on the Red Planet is captured by a NASA spacecraft

A NASA spacecraft in orbit around Mars has taken the first ever image of active avalanches near the Red Planet's north pole. The image shows tan clouds billowing away from the foot of a towering slope, where ice and dust have just cascaded down.

The High Resolution Imaging Experiment (HiRISE) on NASA's Mars Reconnaissance Orbiter took the photograph February 19. It is one of approximately 2,400 HiRISE images being released today.

Ingrid Daubar Spitale of the University of Arizona, Tucson, who works on targeting the camera and has studied hundreds of HiRISE images, was the first person to notice the avalanches. "It really surprised me," she says. "It's great to see something so dynamic on Mars. A lot of what we see there hasn't changed for millions of years."

The camera is looking repeatedly at selected places on Mars to track seasonal changes. However, the main target of the image was not the steep slope.

"We were checking for springtime changes in the carbon-dioxide frost covering a dune field, and finding the avalanches was completely serendipitous," says Candice Hansen, deputy principal investigator for HiRISE at NASA's Jet Propulsion Laboratory.

The full image reveals features as small as a desk in a strip of terrain 3.7 miles (6 kilometers) wide and more than 10 times that long, at 84° north latitude. Reddish layers known to be rich in water ice make up the face of a steep slope more than 2,300 feet (700 meters) tall, running the length of the image.

"We don't know what set off these landslides," says Patrick Russell of the University of Berne, Switzerland, a HiRISE team collaborator. "We plan to take more images of the site through the changing martian seasons to see if this kind of avalanche happens all year or is restricted to early spring."

More ice than dust probably makes up the material that fell from the upper portion of the scarp. Imaging of the site during coming months will track any changes in the new deposit at the base of the slope. That will help researchers estimate what proportion is ice.

"If blocks of ice broke loose and fell, we expect the water in them will be changing from solid to gas," Russell says. "We'll be watching to see if blocks and other debris shrink in size. What we learn could give us a better understanding of one part of the water cycle on Mars."

Provided by JPL

Seeing through the Dark

Mapping the interior of interstellar clouds in great detail

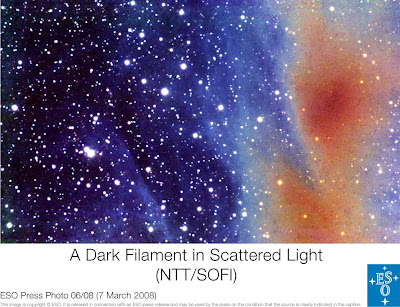
Astronomers have measured the distribution of mass inside a dark filament in a molecular cloud with an amazing level of detail and to great depth. The measurement is based on a new method that looks at the scattered near-infrared light or 'cloudshine' and was made with ESO's New Technology Telescope. Associated with the forthcoming VISTA telescope, this new technique will allow astronomers to better understand the cradles of newborn stars.

ESO PR Photo 05a/08

Part of a filament in the Corona Australis molecular cloud. The image is a composite of J-, H-, and K-band near-infrared observations that were made with the SOFI instrument on ESO's NTT telescope in August 2006. The observations were made to test, how easily the scattered light can be observed and how good it is as a tracer of cloud structure. The J-, H-, and K-band intensities are coded with blue, green, and red colours. The gradual saturation of the near-infrared bands is visible as a change of colour. In diffuse regions the shorter wavelength J-band is strong and the colour is bluish. When the J-band saturates the colour changes first to green and finally, in the centre of the filament, the red colour corresponding to the K-band becomes the strongest. In the most saturated regions the surface brightness data can only be used to derive a lower limit for the total amount of dust on the line of sight.

The vast expanses between stars are permeated with giant complexes of cold gas and dust opaque to visible light. Yet these are the future nurseries of stars to be.

"One would like to have a detailed knowledge of the interiors of these dark clouds to better understand where and when new stars will appear," says Mika Juvela, lead author of the paper in which these results are reported.

Because the dust in these clouds blocks the visible light, the distribution of matter within interstellar clouds can be examined only indirectly. One method is based on measurements of the light from stars that are located behind the cloud [1] .

"This method, albeit quite useful, is limited by the fact that the level of details one can obtain depends on the distribution of background stars," says co-author Paolo Padoan.

In 2006, astronomers Padoan, Juvela, and colleague Veli-Matti Pelkonen, proposed that maps of scattered light could be used as another tracer of the cloud's inner structure, a method that should yield more advantages. The idea is to estimate the amount of dust located along the line of sight by measuring the intensity of the scattered light.

Dark clouds are feebly illuminated by nearby stars. This light is scattered by the dust contained in the clouds, an effect dubbed 'cloudshine' by Harvard astronomers Alyssa Goodman and Jonathan Foster. This effect is well known to sky lovers, as they create in visible light wonderful pieces of art called 'reflection nebulae'. The Chameleon I complex nebula is one beautiful example.

When making observations in the near-infrared, art becomes science. Near-infrared radiation can indeed propagate much farther into the cloud than visible light and the maps of scattered light can be used to measure the mass of the material inside the cloud.

To put this method to the test and use it for the first time for a quantitative estimation of the distribution of mass within a cloud, the astronomers who made the original suggestion, together with Kalevi Mattila, made observations in the near-infrared of a filament in the Corona Australis cloud [2] . The observations were made in August 2006 with the SOFI instrument on ESO's New Technology Telescope at La Silla, in the Chilean Atacama Desert. The filament was observed for about 21 hours.

Their observations confirm that the scattering method is providing results that are as reliable as the use of background stars while providing much more detail.

"We can now obtain very high resolution images of dark clouds and so better study their internal structure and dynamics," says Juvela. "Not only is the level of details in the resulting map no longer dependent on the distribution of background stars, but we have also shown that where the density of the cloud becomes too high to be able to see any background stars, the new method can still be applied."

"The presented method and the confirmation of its feasibility will enable a wide range of studies into the interstellar medium and star formation within the Milky Way and even other galaxies," says co-author Mattila.

"This is an important result because, with current and planned near-infrared instruments, large cloud areas can be mapped with high resolution," adds Pelkonen. "For example, the VIRCAM instrument on ESO's soon-to-come VISTA telescope has a field of view hundreds of times larger than SOFI. Using our method, it will prove amazingly powerful for the study of stellar nurseries."

Notes

[1]: When the light from the background stars passes through the cloud, it is absorbed and scattered, resulting in the background stars appearing redder than they really are. The effect is proportional to the amount of obscuring material and is therefore largest for stars that are situated behind the cloud's densest parts. By measuring the degree of this 'reddening' experienced by stars seen through different areas of the cloud, it is thus possible to chart the distribution of dust in the cloud. The finer the net of background stars is, the more detailed this map will be and the better the information about the internal structure of the cloud. And that is exactly the problem. Even small clouds are so opaque that very few background stars can be seen through them. Only large telescopes and extremely sensitive instruments are able to observe a sufficient number of stars in order to produce significant results (see ESO 01/01).

[2]: Located in the constellation of the same name ('Southern Crown'), the Corona Australis molecular cloud is shaped like a 45 light year long cigar. Located about 500 light years away, it contains the equivalent of about 7000 Suns. On the sky, the dark cloud is surrounded by many beautiful 'reflection nebulae'.

[3]: Observations of a star-forming cloud with ESO's VLT and based on near-infrared scattering is available as ESO Press Photo 26/03.

Science Contact
Mika Juvela
Helsinki University Observatory
E-mail: mika.juvela (at) helsinki.fi
Phone: +358-9-19122909