Pages

Wednesday, December 17, 2025

Astronomers Create First Map of the Sun's Outer Boundary

This artist's conception shows the boundary in the Sun's atmosphere where the speed of the outward solar wind becomes faster than the speed of magnetic waves. The area appears to shift between spiky and frothy, and is the point of no return for material that escapes the Sun's magnetic grasp. Deep dives into the Alfvén surface using NASA's Parker Solar Probe combined with far-away measurements, have allowed scientists to track the evolution of this structure throughout the solar cycle and produce a map of this previously uncharted territory. Credit: CfA/ Melissa Weiss.
Low Resolution Image


Using NASA’s Parker Solar Probe and other near-Earth spacecraft, scientists from the Center for Astrophysics | Harvard & Smithsonian have made and validated the first 2D maps of the Sun’s outer surface, leading to unprecedented insight into how and where the Sun “loses its grip” on its outer atmosphere.

Cambridge, MA (December 11, 2025)— Astronomers have produced the first continuous, two-dimensional maps of the outer edge of the Sun’s atmosphere, a shifting, frothy boundary that marks where solar winds escape the Sun’s magnetic grasp. By combining the maps and close-up measurements, scientists from the Center for Astrophysics | Harvard & Smithsonian (CfA) showed that the boundary grows larger, rougher and spikier as the Sun becomes more active. The findings could help scientists improve models showing how the Sun affects Earth, and better predict atmospheric complexity for other stars.

“Parker Solar Probe data from deep below the Alfvén surface could help answer big questions about the Sun’s corona, like why it’s so hot. But to answer those questions, we first need to know exactly where the boundary is,” said Sam Badman, an astrophysicist at the CfA, and the lead author of the paper.

The scientists have directly validated these maps using deep dives into the Sun’s atmosphere made by NASA’s Parker Solar Probe. The findings are published today in the Astrophysical Journal Letters (ApJL).

The boundary in the Sun’s atmosphere where the solar wind’s outward speed becomes faster than the speed of magnetic waves, known as the Alfvén surface, is the “point of no return” for material that escapes the Sun and enters interplanetary space; once material travels beyond this point, it cannot travel back to the Sun. This surface is the effective “edge” of the Sun’s atmosphere, and provides scientists with an active laboratory for studying and understanding how solar activity impacts the rest of the solar system, including life and technology on and around Earth.

Using Parker’s Solar Wind Electrons Alphas and Protons (SWEAP) instrument, developed by the CfA in conjunction with the University of California, Berkeley, the scientists collected data from deep into the Sun’s sub-Alfvénic surface.

“There are still a number of fascinating physics questions about the Sun’s corona that we don’t fully understand,” said Michael Stevens, an astronomer at the CfA and the principal investigator of Parker’s SWEAP instrument. “This work shows without a doubt that Parker Solar Probe is diving deep with every orbit into the region where the solar wind is born. We are now headed for an exciting period where it will witness firsthand how those processes change as the Sun goes into the next phase of its activity cycle.”

“Before, we could only estimate the Sun’s boundary from far away without a way to test if we got the right answer, but now we have an accurate map that we can use to navigate it as we study it,” added Badman “And, importantly, we also are able to watch it as it changes and match those changes with close-up data. That gives us a much clearer idea of what’s really happening around the Sun.”

Scientists previously knew this boundary changes dynamically with solar cycles, moving away from the Sun and becoming larger, more structured, and more complex during solar maximum, and the opposite during solar minimum, but until now didn’t have confirmation of what exactly those changes looked like.

Badman added, “As the Sun goes through activity cycles, what we’re seeing is that the shape and height of the Alfvén surface around the Sun is getting larger and also spikier. That’s actually what we predicted in the past, but now we can confirm it directly.”

The new maps and corresponding data can help scientists answer important questions about the physics happening deep in the Sun’s atmosphere; that knowledge can in turn be used to develop better solar wind and space-weather models, sharpening forecasts of how solar activity moves through and shapes the environment around Earth and other planets in the solar system.

It can also help them to answer longheld questions about the lives of stars elsewhere in the galaxy and the universe, from how they’re born to how they behave throughout their lives, including how that behavior influences the habitability of their orbiting planets.

The team’s findings offer a new window into the workings of our closest star and lay the foundation for ever deeper discoveries. According to Badman, the coordinated multi-spacecraft approach, which combined the observational powers of close-up probes and distant observing stations including the Solar Orbiter, a project of NASA and the European Space Agency (ESA), and NASA’s Wind spacecraft, will continue to serve as a model for future breakthrough studies in heliophysics. During the next solar minimum, the team will again dive into the Sun’s corona, with an aim to study how it evolves over a complete solar cycle.


Resource

Badman, S. T. et al, “Multi-spacecraft measurements of the evolving geometry of the Solar Alfvén surface over half a solar cycle,” Astrophysical Journal Letters, 2025 Dec 11, doi: 10.3847/2041-8213/ae0e5c


About the Center for Astrophysics | Harvard & Smithsonian

The Center for Astrophysics | Harvard & Smithsonian is a collaboration between Harvard and the Smithsonian designed to ask—and ultimately answer—humanity's greatest unresolved questions about the nature of the universe. The Center for Astrophysics is headquartered in Cambridge, MA, with research facilities across the U.S. and around the world.


Media Contacts:

Amy C. Oliver, FRAS
Public Affairs Officer
Center for Astrophysics | Harvard & Smithsonian
+1 520 879 4406

amy.oliver@cfa.harvard.edu


Astronomers find first direct evidence of “Monster Stars” from the cosmic dawn

While measuring chemical signatures in galaxy GS 3073, scientists determined that the ratio of nitrogen to oxygen was too high to be explained by ordinary stars. Instead, the extreme levels of nitrogen point to primordial monster stars between 1,000 and 10,000 times the mass of the Sun. This simulated image shows the birth of a primordial quasar, or extraordinarily bright black hole, that was made possible by one of these giant stars. Credit: Nandal et al.

Scientists have found the first observational evidence of supermassive “first stars” that formed in rare, turbulent streams of cold gas in the early universe. This new data is helping scientists confirm theories about how quasars, or extremely bright black holes, 9174mwere able to form less than a billion years after the Big Bang. Credit: Nandal et al.
Download video here (174 Mb)


Using the James Webb Space Telescope, an international team of researchers led the Center for Astrophysics | Harvard & Smithsonian have discovered chemical fingerprints of gigantic primordial stars that were among the first to form after the Big Bang.

Cambridge, MA (December 9, 2025)— For two decades, astronomers have puzzled over how supermassive black holes, which are some of the brightest objects in the universe, could exist less than a billion years after the Big Bang. Normal stars simply couldn't create such massive black holes quickly enough.

Now, using NASA’s James Webb Space Telescope (JWST), an international team of astronomers has found the first compelling evidence that solves this cosmic mystery: “monster stars” weighing between 1,000 and 10,000 times the mass of our Sun existed in the early universe. The breakthrough came from examining chemical signatures in a galaxy called GS 3073.

A new study led by scientists from the Center for Astrophysics | Harvard & Smithsonian (CfA) and the University of Portsmouth in England has discovered an extreme imbalance of nitrogen to oxygen that cannot be explained by any known type of star.

In 2022, researchers published work in Nature predicting that supermassive stars naturally formed in rare, turbulent streams of cold gas in the early universe, explaining how quasars (extraordinarily bright black holes) could exist less than a billion years after the Big Bang.

“Our latest discovery helps solve a 20-year cosmic mystery,” said Daniel Whalen from the University of Portsmouth's Institute of Cosmology and Gravitation. “With GS 3073, we have the first observational evidence that these monster stars existed.

These cosmic giants would have burned brilliantly for a brief time before collapsing into massive black holes, leaving behind the chemical signatures we can detect billions of years later. A bit like dinosaurs on Earth, they were enormous and primitive. And they had short lives, living for just a quarter of a million years, a cosmic blink of an eye.”

The key to the discovery was measuring the ratio of nitrogen to oxygen in GS 3073. The galaxy contains a nitrogen-to-oxygen ratio of 0.46, far higher than can be explained by any known type of star or stellar explosion.

Devesh Nandal, a Swiss National Science Foundation postdoctoral fellow at the CfA’s Institute for Theory and Computation said, “Chemical abundances act like a cosmic fingerprint, and the pattern in GS 3073 is unlike anything ordinary stars can produce. Its extreme nitrogen matches only one kind of source we know of: primordial stars thousands of times more massive than our Sun. This tells us the first generation of stars included truly supermassive objects that helped shape the early galaxies and may have seeded today’s supermassive black holes.”

The researchers modeled how stars between 1,000 and 10,000 solar masses evolve and what eleme,brnts they produce. They found a specific mechanism that creates massive amounts of nitrogen:

  • These enormous stars burn helium in their cores, producing carbon;

  • The carbon leaks into a surrounding shell where hydrogen is burning;

  • The carbon combines with hydrogen to create nitrogen through the carbon/nitrogen/oxygen (CNO) cycle;

  • Convection currents distribute the nitrogen throughout the star; and,

  • Eventually, this nitrogen-rich material is shed into space, enriching the surrounding gas.

The process continues for millions of years during the star's helium-burning phase, creating the nitrogen excess observed in GS 3073.

The models, published in the Astrophysical Journal Letters, also predict what happens when these monster stars die. They don't explode. Instead, they collapse directly into massive black holes weighing thousands of solar masses.

Interestingly, GS 3073 contains an actively feeding black hole at its center, potentially the very remnant of one of these supermassive first stars. If confirmed, this would solve two mysteries at once: where the nitrogen came from and how the black hole formed.

The study also found that this nitrogen signature only appears in a specific mass range. Stars smaller than 1,000 solar masses or larger than 10,000 solar masses don't produce the right chemical pattern for the signature, suggesting a "sweet spot" for this type of enrichment.

These findings open a new window into the universe's first few hundred million years, a period astronomers call the "cosmic Dark Ages" when the first stars ignited and began transforming the simple chemistry of the early universe into the rich variety of elements we see today.

The researchers predict that JWST will find more galaxies with similar nitrogen excesses as it continues surveying the early universe. Each new discovery will strengthen the case for these ultra-massive first stars.


Resource:

Nandal, D. et al, “1000-10,000 M ⊙ Primordial Stars Created the Nitrogen Excess in GS 3073 at z = 5.55,” The Astrophysical Journal Letters, doi: 10.3847/2041-8213/ae1a63


About the Center for Astrophysics | Harvard & Smithsonian

The Center for Astrophysics | Harvard & Smithsonian is a collaboration between Harvard and the Smithsonian designed to ask—and ultimately answer—humanity's greatest unresolved questions about the nature of the universe. The Center for Astrophysics is headquartered in Cambridge, MA, with research facilities across the U.S. and around the world.


Media Contacts:

Amy C. Oliver, FRAS
Public Affairs Officer
Center for Astrophysics | Harvard & Smithsonian
+1 520 879 4406

amy.oliver@cfa.harvard.edu


Tuesday, December 16, 2025

Galactic gas makes a getaway

A spiral galaxy seen nearly edge-on. Its disk is filled with red and blue lights from star-forming nebulae and clusters of hot stars, respectively, as well as thick dark clouds of dust that block the strong white light from its centre. A faint, glowing halo of gas surrounds the disc, fading into the black background. A bluish plume of gas also extends from the galaxy’s core to the lower-right of the image. Credit: ESA/Hubble & NASA, S. Veilleux, J. Wang, J. Greene

A sideways spiral galaxy shines in today’s ESA/Hubble Picture of the Week. Located about 60 million light-years away in the constellation Virgo (The Maiden), NGC 4388 is a resident of the Virgo galaxy cluster. The Virgo cluster contains more than a thousand galaxies and is the nearest large galaxy cluster to the Milky Way.

NGC 4388 is tilted at an extreme angle relative to our point of view, giving us a nearly edge-on vantage point. This perspective reveals a curious feature that wasn’t visible in a previous Hubble image of this galaxy released in 2016: a plume of gas from the galaxy’s nucleus, here seen billowing out from the galaxy’s disc towards the lower-right corner of the image. But where did this outflow come from, and why does it glow?

The answer likely lies in vast stretches that separate the galaxies of the Virgo cluster. Though the space between the galaxies appears to be empty, this space is actually occupied by hot wisps of gas called the intracluster medium. As NGC 4388 journeys within the cluster, it plunges through the intracluster medium. The pressure from the hot intracluster gas whisks away the gas from within NGC 4388’s disc, causing it to trail behind as NGC 4388 moves.

The source of the energy that ionises this gas cloud and causes it to glow is more uncertain. Researchers suspect that some of the energy comes from the centre of the galaxy, where a supermassive black hole has spun the gas around it into a superheated disc. The blazing radiation from this disc might ionise the gas closest to the galaxy, while shock waves might be responsible for ionising the filaments of gas farther out.

This image incorporates new data including several additional wavelengths of light to bring the ionised gas cloud into view. The data used to create this image come from several observing programmes that aim to illuminate galaxies with active black holes at their centres.


Painting Galaxy Clusters by Numbers (and Physics)

MS 0735.6+7421 - Perseus Cluster - M87 - Abell 2052 - Cygnus A
Credit: X-ray: NASA/CXC/Univ. of Chicago/H. McCall


JPEG (168.9 kb) - Large JPEG (10.5 MB) - Tiff (34.6 MB) - More Images

MS 0735.6+7421 - Perseus Cluster - M87 - Abell 2052 - Cygnus A
Astronomical Images of Objects Processed Using X-arithmetic Technique (Labeled) Credit: X-ray: NASA/CXC/Univ. of Chicago/H. McCall; Image processing: NASA/CXC/SAO/N. Wolk

A Tour of X-arithmetic - More Videos


Galaxy clusters are the most massive objects in the universe held together by gravity, containing up to several thousand individual galaxies and huge reservoirs of superheated, X-ray-emitting gas. The mass of this hot gas is typically about five times higher than the total mass of all the galaxies in galaxy clusters. In addition to these visible components, 80% of the mass of galaxy clusters is supplied by dark matter. These cosmic giants are bellwethers not only for the galaxies, stars and black holes within them, but also for the evolution and growth of the universe itself.

It is no surprise then that NASA’s Chandra X-ray Observatory has observed many galaxy clusters over the lifetime of the mission. Chandra’s X-ray vision allows it to see the enormous stockpiles of hot cluster gas, with temperatures as high as 100 million degrees, with exquisite clarity. This blazing gas tells stories about past and present activity within galaxy clusters.

Many of these galaxy clusters host supermassive black holes at their centers, which periodically erupt in powerful outbursts. These explosions generate jets that are visible in radio wavelengths, which inflate bubbles full of energetic particles; these bubbles carry energy out into the surrounding gas. Chandra’s images have revealed a wealth of other structures formed during these black hole outbursts, including hooks, rings, arcs, and wings. However, appearances alone don’t tell us what these structures are or how they formed.

To tackle this problem, a team of astronomers developed a novel image-processing technique to analyze X-ray data, allowing them to identify features in the gas of galaxy clusters like never before, classifying them by their nature rather than just their appearance. Prior to this technique, which they call “X-arithmetic,” scientists could only identify the nature of some of the features and in a much less efficient way, via studies of the amounts of X-ray energy dispersed at different wavelengths. The authors applied X-arithmetic to 15 galaxy clusters and galaxy groups (these are similar to galaxy clusters but with fewer member galaxies). By comparing the outcome from the X-arithmetic technique to computer simulations, researchers now have a new tool that will help in understanding the physical processes inside these important titans of the universe.

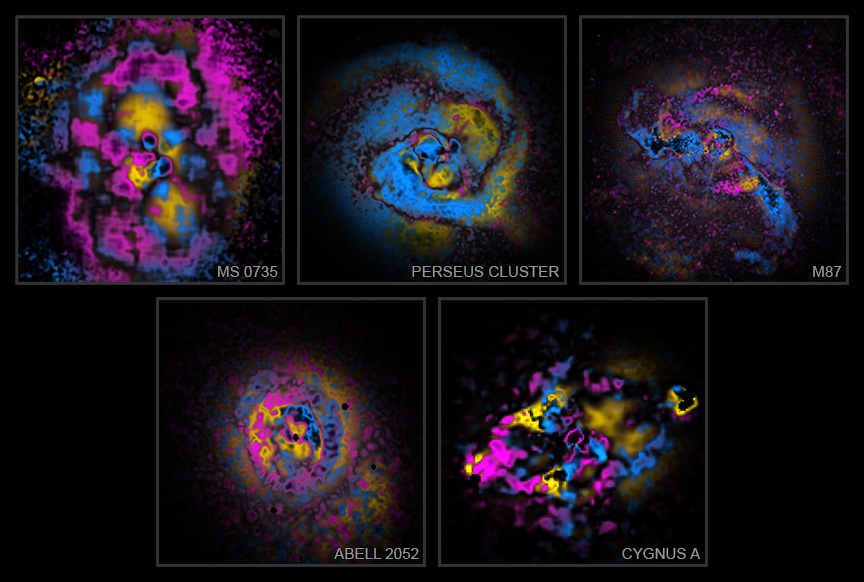
A new paper looks at how these structures appear in different parts of the X-ray spectrum. By splitting Chandra data into lower-energy and higher-energy X-rays and comparing the strengths of each structure in both, researchers can classify them into three distinct types, which they have colored differently. A pink color is given to sound waves and weak shock fronts, which arise from pressure disturbances traveling at close to the speed of sound, compressing the hot gas into thin layers. The bubbles inflated by jets are colored yellow, and cooling or slower-moving gas is blue. The resulting images, “painted” to reflect the nature of each structure, offer a new way to interpret the complex aftermath of black hole activity using only X-ray imaging data. This method works not only on Chandra (and other X-ray) observations, but also on simulations of galaxy clusters, providing a tool to bridge data and theory.

The images in this new collection show the central regions of five galaxy clusters in the sample: Abell 2052 and Cygnus A in the top row and MS 0735+7421, the Perseus Cluster, and M87 in the Virgo Cluster on the bottom row. All of these objects have been released to the public before by the Chandra X-ray Center, but this is the first time this special technique has been applied. The new treatment highlights important differences between the galaxy clusters and galaxy groups in the study.

The galaxy clusters in the study often have large regions of cooling or slow-moving gas near their centers, and only some show evidence for shock fronts. The galaxy groups, on the other hand, are different. They show multiple shock fronts in their central regions and smaller amounts of cooling and slow-moving gas compared to the sample of galaxy clusters.

This contrast between galaxy clusters and galaxy groups suggests that black hole feedback — that is, the interdependent relationship between outbursts from a black hole and its environment — appears stronger in galaxy groups. This may be because feedback is more violent in the groups than in the clusters, or because a galaxy group has weaker gravity holding the structure together than a galaxy cluster. The same outburst from a black hole, with the same power level, can therefore more easily affect a galaxy group than a galaxy cluster.

There are still many open questions about these black hole outbursts. For example, scientists would like to know how much energy they put into the gas around them and how often they occur. These violent events play a key role in regulating the cooling of the hot gas and controlling the formation of stars in clusters. By revealing the physics underlying the structures they leave behind, the X-arithmetic technique brings us closer to understanding the influence of black holes on the largest scales.

A paper describing this new technique and its results has been published in The Astrophysical Journal and is led by Hannah McCall from the University of Chicago. The other authors are Irina Zhuravleva (University of Chicago), Eugene Churazov (Max Planck Institute for Astrophysics, Germany), Congyao Zhang (University of Chicago), Bill Forman and Christine Jones (Center for Astrophysics | Harvard & Smithsonian), and Yuan Li (University of Massachusetts at Amherst).

NASA's Marshall Space Flight Center in Huntsville, Alabama, manages the Chandra program. The Smithsonian Astrophysical Observatory's Chandra X-ray Center controls science operations from Cambridge, Massachusetts, and flight operations from Burlington, Massachusetts.


Visual Description:

This release includes two sets of images featuring galaxy clusters. The first set of five images are traditional composite renderings. The second set of images features the same galaxy clusters rendered with a new image-processing technique called "X-arithmetic".

The traditional composite renderings share many visual similarities with digital photography; the images are relatively crisp, and feature cloud-like objects with blended colors, set against black backgrounds, dotted with distant specks of light. The X-arithmetic images are more visually similar to color MRI scans; they feature pixelated objects with distinct patches of vibrant color, set against neutral black backgrounds.

The first image in the two sets features the seemingly spherical galaxy cluster Abell 2052. In the composite rendering, the cluster resembles a pink rose in a cloud of powder blue haze. In the X-arithmetic rendering, interwoven pockets of hot pink, neon blue, and golden yellow appear brighter near the center, and somewhat muted near the outer edges.

The second image in the two sets features Cygnus A, a galaxy cluster with jets blasting in opposite directions out of a central black hole. In the composite image, the black hole appears as bright white light, the cluster resembles a neon blue cloud, and the jets exiting the cluster are surrounded by plumes resembling red smoke. In the X-arithmetic rendering, Cygnus A is depicted as a marbled ball of pixelated pockets in neon pink, blue, and golden yellow.

The third image in the sets features the galaxy cluster MS 0735. In the composite rendering, a vertical red cloud squiggle with a bright yellow dot in the center, is surrounded by a faint blue haze. In the X-arithmetic rendering, large pockets of yellow are surrounded by irregular hot pink shapes and dappled pockets of blue, which grow more granular near the outer edges.

The fourth pair of images feature the Perseus Cluster. The composite rendering resembles the view down a swirling cone of pink cotton candy, with a collection of dark blue filaments at the distant center. In the X-arithmetic rendering, the cluster resembles a corkscrew swirl of neon blue water, dotted with pink flecks, and blobs of golden yellow.

The fifth and final pair of images feature the galaxy cluster M87. In the composite rendering, the cluster is presented as ethereal overlapping clouds in purple, red, and white, with a golden orange embryonic shape at the core. The X-arithmetic rendering of the same cluster resembles a faint yellow cloud, digitally spattered with blue and pink pixels.


Fast Facts for MS 0735.6+7421:

Credit: X-ray: NASA/CXC/Univ. of Chicago/H. McCall
Release Date: December 9, 2025
Scale: Image is about 4.0 arcmin (2.8 million light-years) across.
Category: Groups and Clusters of Galaxies
Coordinates (J2000): RA 07h 41m 50.20s | Dec +74° 14´ 51.00"
Constellation: Camelopardalis
Observation Dates: 9 observations from Nov 2003 to Jan 2015
Observation Time: 149 hours 27 minute (6 days 5 hours 27 minutes)
Obs. ID: 4197, 10468-10471, 10822, 10918, 10922, 16275
Instrument:
ACIS
References: McCall, H. et al, 2025, ApJ, 989,159; DOI 10.3847/1538-4357/adea67
Color Code: X-ray: pink, yellow, blue
Distance Estimate: About 2.6 billion light-years from Earth


Fast Facts for Perseus Cluster:

Credit: X-ray: NASA/CXC/Univ. of Chicago/H. McCall
Release Date: December 9, 2025
Scale: Image is about 6 arcmin (410,000 light-years) across.
Category: Groups and Clusters of Galaxies
Coordinates (J2000): RA 3h 19m 47.60 | Dec +41° 30´ 37.00"
Constellation: Perseus
Observation Dates: 16 observations from Aug 2002 to Dec 2009
Observation Time: 330 hours 14 minutes (13 days 18 hours 14 minutes)
Obs. ID: 3209, 4289, 4946-4949, 6139, 4951-4953, 6139, 6145, 6146, 11713-11716
Instrument: ACIS
References: McCall, H. et al, 2025, ApJ, 989,159; DOI 10.3847/1538-4357/adea67
Color Code: X-ray: pink, yellow, blue
Distance Estimate: About 240 million light-years from Earth


Fast Facts for M87:

Credit: X-ray: NASA/CXC/Univ. of Chicago/H. McCall
Release Date: December 9, 2025v Scale: Image is about 15 arcmin (230,000 light-years) across.
Category: Groups and Clusters of Galaxies
Coordinates (J2000): RA 12h 30m 49.19s | Dec +12° 22´ 47.86"
Constellation: Virgo
Observation Dates: 10 observations from Jul 2003 to Apr 2010
Observation Time: 174 hours 26 minutes (7 days 6 hours 26 minutes)
Obs. ID: 2707, 3717, 5826-5828, 6186, 7210-7212, 11783
Instrument: ACIS
References: McCall, H. et al, 2025, ApJ, 989,159; DOI 10.3847/1538-4357/adea67
Color Code: X-ray: pink, yellow, blue
Distance Estimate: About 54 million light-years from Earth


Fast Facts for Abell 2052:

Credit: X-ray: NASA/CXC/Univ. of Chicago/H. McCall
Release Date: December 9, 2025
Scale: Image is about 4.4 arcmin (600,000 light-years) across.
Category: Groups and Clusters of Galaxies
Coordinates (J2000): RA 15h 16m 44.40s | Dec +07° 01´ 20.00"
Constellation: Serpens
Observation Dates: 10 observations from Mar, 2006 to Jun, 2009
Observation Time: 171 hours 28 minutes (7 days 3 hours 28 minutes)
Obs. ID: 5807, 10477-10480, 10879, 10914-10917
Instrument: ACIS
References: McCall, H. et al, 2025, ApJ, 989,159; DOI 10.3847/1538-4357/adea67
Color Code: X-ray: pink, yellow, blue
Distance Estimate: About 480 million light-years from Earth


Fast Facts for Cygnus A:

Credit: X-ray: NASA/CXC/Univ. of Chicago/H. McCall
Release Date: December 9, 2025
Scale: Image is about 3.4 arcmin (740,000 light-years) across.
Category: Groups and Clusters of Galaxies
Coordinates (J2000): RA 19h 59m 28.3s | Dec +44° 44´ 02"
Constellation: Cygnus
Observation Dates: 26 observations from Feb 2005 to May 2017
Observation Time: 221 hours 5 minutes (9 days 5 hours 5 minutes)
Obs. ID: 5830, 5831, 6225, 6226, 6228, 6229, 6250, 6252, 17133-17136, 17507-17514, 18688, 18871, 19989, 19996, 20077, 20079
Instrument: ACIS
References: McCall, H. et al, 2025, ApJ, 989,159; DOI 10.3847/1538-4357/adea67
Color Code: X-ray: pink, yellow, blue
Distance Estimate: About 760 million light-years from Earth


Monday, December 15, 2025

Michelangelo in Space: A Planet Carving the Fomalhaut Debris Disk?

This image combines observations from the Hubble Space Telescope and the Atacama Large Millimeter/submillimeter Array to show the dusty debris disk surrounding the star Fomalhaut. Credit:
ALMA (ESO/NAOJ/NRAO). Visible light image: the NASA/ESA Hubble Space Telescope A. Fujii/Digitized Sky Survey 2. Acknowledgment: Davide De Martin (ESA/Hubble); CC BY 4.0


Title:ALMA Reveals an Eccentricity Gradient in the Fomalhaut Debris Disk
Authors: Joshua B. Lovell et al.
First Author’s Institution: Center for Astrophysics | Harvard & Smithsonian
Status: Published in ApJ

Step 1: Understanding How to Carve Your Debris Disk

Let’s start with our solar system: the Kuiper belt, a large ring of icy asteroids, is believed to have been sculpted into its current shape by Neptune. Neptune may have previously scattered objects in the Kuiper Belt through gravitational interactions, but some of them (like Pluto) remain in an orbital resonance with Neptune. In the same way that Neptune shapes the Kuiper Belt, today’s authors believe a planet could be shaping an exo-Kuiper Belt around the star Fomalhaut.
.
What on Neptune is an orbital resonance, though? A planet orbiting a star has an orbital period, and the gravitational forces between nearby (astronomically speaking) objects can push these objects into a state where their orbital periods are multiples of each other. For example, Pluto and Neptune have a 2:3 orbital resonance, meaning Pluto completes two orbits for every three that Neptune does. The same can happen for the asteroids and planetesimals in the Kuiper Belt, so the same should happen in other star systems!
.
Step 2: Make Your Observations

If we understand how debris disks carved by exoplanets look — and we think we do — then we should be able to infer the existence of exoplanets! Today’s authors have used observations from the Atacama Large Millimeter/submillimeter Array (ALMA) of the debris disk around Fomalhaut and made some very clever calculations. We’ve known about this disk for a while, which is why today’s authors have studied it with a new analysis technique they developed.

Planeteismals — basically big rocks from a few to hundreds of kilometers across — that orbit in this disk do so with a certain eccentricity, and typically things in the same orbit would have the same eccentricity. But today’s authors were clever — they checked if there was an eccentricity gradient, meaning the planetesimals’ eccentricities depend on their semi-major axis (i.e., the mean orbit radius); we would typically not expect any eccentricity gradient for bodies orbiting a star unperturbed. The authors discovered that the gradient for planetesimals around Fomalhaut is negative, which implies the presence of a planet when you look at the maths behind gravitational interactions between planets and planetesimals.

A negative eccentricity gradient means the planetesimals gather up at the point on the orbit farthest from the star (the apocenter), and since there are more planetesimals in that region, they appear brighter in the ALMA data (see Fig. 1 left); the ring also appears slightly wider. If the eccentricity gradient were positive, the same thing would happen at the point on the orbit closest to the star (the pericenter). The authors term this phenomenon the “eccentric velocity divergence.”


Figure 1: Left: The observed intensity of the Fomalhaut debris disk with ALMA. Middle: the authors’ model that fits the ALMA data the best. Right: The residual (data – model) between model and data. White means there is a close match to the data (which is better). Credit: Lovell et al. 2025


When the authors ran their eccentric velocity divergence calculations for the Fomalhaut disk model, they compared it to observations using a Markov Chain Monte Carlo algorithm.

Figure 1 shows their best-fitting model, which fits remarkably well, based on the residual (i.e., the difference between model and data) you can see on the right — including the slightly wider ring at the apocenter!

The authors tested other scenarios with different gradients and allowed for the planetesimals to oscillate their eccentricity around their orbit, but they didn’t find a better-fitting scenario.

Step 3: Find a Carving Planet

Okay, so those were the details. The authors investigated a few scenarios to see what could be causing the observed debris disk and its negative eccentricity gradient, as well as an intermediate ring sitting between the main disk and the star that recently was seen with JWST. The authors tested two scenarios: one where a planet sits between the rings and evacuates the nearby region, and another where a planet is interior to the inner ring and clears the gap through orbital resonances (kind of like Neptune!). An illustration can be seen in Figure 2.

Figure 2: Illustration of possible planet-based scenarios that could create the observed debris disk around Fomalhaut. One features a planet between the observed debris disk rings, and another is where the planet is interior to both and carves the gap with orbital resonances. Credit: J. Williams


A planet was previously thought to exist around Fomalhaut, but it is now accepted there is not one we can currently observe. The authors point out that the possible planet sculpting this debris disk could be the same planet we thought existed previously, but at a lower mass (1–16 Earth masses; almost a Neptune mass). We can’t observe a planet with these parameters yet, but maybe with future observing facilities!

Finally, the authors stress, however, that it might not be a planet causing the observed structure — it could instead be the gravity of the planetesimals in the disk. Unfortunately, existing models are not equipped to explore this scenario, which is why the authors are planning to develop tools to investigate this next.

Original astrobite edited by Sandy Chiu.


About the author, Joe Williams:

I’m a third-year PhD student at the University of Exeter in the UK, and I study protoplanetary discs — mainly the tiny dust grains and their ices! In my spare time, I’m a climber, crocheter, and reader of sci-fi and fantasy books. My favourite sci-fi series is The Expanse!


Editor’s Note: Astrobites is a graduate-student-run organization that digests astrophysical literature for undergraduate students. As part of the partnership between the AAS and astrobites, we occasionally repost astrobites content here at AAS Nova. We hope you enjoy this post from astrobites; the original can be viewed at astrobites.org.


Sunday, December 14, 2025

New study sheds light on Milky Way's mysterious chemical history

This image shows the gas disc in a computer simulation of a Milky Way-like galaxy from the Auriga suite. Colours represent the ratio of magnesium (Mg) to iron (Fe), revealing that the galactic centre (pink) is poor in Mg, while the outskirts (green) are Mg-rich. These chemical patterns provide important clues about how the galaxy formed. Credit: Matthew D. A. Orkney (ICCUB-IEEC) /Auriga project.
Licence type:Attribution (CC BY 4.0)


Clues about how galaxies like our Milky Way form and evolve and why their stars show surprising chemical patterns have been revealed by a new study.

The research, published today in Monthly Notices of the Royal Astronomical Society, explores the origins of a puzzling feature in the Milky Way: the presence of two distinct groups of stars with different chemical compositions, known as the "chemical bimodality".

When scientists study stars near the Sun, they find two main types based on their chemical makeup, specifically, the amounts of iron (Fe) and magnesium (Mg) they contain. These two groups form separate "sequences" in a chemical diagram, even though they overlap in metallicity (how rich they are in heavy elements like iron). This has long puzzled astronomers.

The new study led by researchers at the Institute of Cosmos Sciences of the University of Barcelona (ICCUB) and the Centre national de la recherche scientifique (CNRS) uses advanced computer simulations (called the Auriga simulations) to recreate the formation of galaxies like the Milky Way in a virtual universe. By analysing 30 simulated galaxies, the team looked for clues about how these chemical sequences form.

Understanding the chemical history of the Milky Way helps scientists piece together how our gaaxy, and others like it, came to be. This includes our sister galaxy, Andromeda, in which no bimodality has yet been detected. It also provides clues about the conditions in the early universe and the role of cosmic gas flows and galaxy mergers.

"This study shows that the Milky Way's chemical structure is not a universal blueprint," said lead author Matthew Orkney, a researcher at ICCUB and the Institut d’Estudis Espacials de Catalunya (IEEC).

"Galaxies can follow different paths to reach similar outcomes, and that diversity is key to understanding galaxy evolution."

The study reveals that galaxies like the Milky Way can develop two distinct chemical sequences through various mechanisms. In some cases, this bimodality arises from bursts of star formation followed by periods of little activity, while in others it results from changes in the inflow of gas from the galaxy's surroundings.

Contrary to previous assumptions, the collision with a smaller galaxy known as Gaia-Sausage-Enceladus (GSE) is not a necessary condition for this chemical pattern to emerge. Instead, the simulations show that metal-poor gas from the circumgalactic medium (CGM) plays a crucial role in forming the second sequence of stars.

Moreover, the shape of these chemical sequences is closely linked to the galaxy's star formation history.

As new telescopes like the James Webb Space Telescope (JWST) and upcoming missions such as PLATO and Chronos provide more detailed data on stars and galaxies, researchers will be able to test these findings and refine our picture of the cosmos.

"This study predicts that other galaxies should exhibit a diversity of chemical sequences. This will soon be probed in the era of 30m telescopes where such studies in external galaxies will become routine," said Dr Chervin Laporte, of ICCUB-IEEC, CNRS-Observatoire de Paris and Kavli IPMU.

"Ultimately, these will also help us further refine the physical evolutionary path of our own Milky Way."


Media Contacts:

Sam Tonkin
Royal Astronomical Society
Mob: +44 (0)7802 877 700

press@ras.ac.uk

Dr Robert Massey
Royal Astronomical Society
Mob: +44 (0)7802 877 699

press@ras.ac.uk


Science Contacts:

Matthew Orkney
University of Barcelona

m.d.a.orkney@gmail.com


Images & video

Milky Way-like galaxy simulation

Caption: Computer simulation of a Milky Way-like galaxy from the Auriga suite, cycling between views of the stars, the gas coloured by iron (Fe) abundance, and the gas coloured by magnesium (Mg) abundance. The galaxy has developed a large, flat gas disc that forms a thin disc of young and blue stars. The gas disc was thicker in earlier stages, producing an older and redder population of stars in a thicker stellar disc. A scale bar in the lower-left corner indicates the size of the galaxy. For comparison, the Sun lies about 8 kiloparsecs (kpc) from the centre of our own Milky Way. Credit: Matthew D. A. Orkney (ICCUB-IEEC) /Auriga project

Auriga suite still

Caption: This image shows the gas disc in a computer simulation of a Milky Way-like galaxy from the Auriga suite. Colours represent the ratio of magnesium (Mg) to iron (Fe), revealing that the galactic centre (pink) is poor in Mg, while the outskirts (green) are Mg-rich. These chemical patterns provide important clues about how the galaxy formed. Credit: Matthew D. A. Orkney (ICCUB-IEEC) /Auriga project.


Further information

The paper ‘The Milky Way in context: The formation of galactic discs and chemical sequences from a cosmological perspective’ by M. D. A. Orkney et al. has been published in Monthly Notices of the Royal Astronomical Society. DOI: 10.1093/mnras/staf1551.

This research has been led by researchers from the Institute of Cosmos Sciences of the University of Barcelona (ICCUB), the Institute of Space Studies of Catalonia (IEEC) and the CNRS with the collaboration of scientists from Liverpool John Moores University and the Max-Planck-Institut für Astrophysik.


Notes for editors

About the Royal Astronomical Society

The Royal Astronomical Society (RAS), founded in 1820, encourages and promotes the study of astronomy, solar-system science, geophysics and closely related branches of science.

The RAS organises scientific meetings, publishes international research and review journals, recognises outstanding achievements by the award of medals and prizes, maintains an extensive library, supports education through grants and outreach activities and represents UK astronomy nationally and internationally. Its more than 4,000 members (Fellows), a third based overseas, include scientific researchers in universities, observatories and laboratories as well as historians of astronomy and others.

The RAS accepts papers for its journals based on the principle of peer review, in which fellow experts on the editorial boards accept the paper as worth considering. The Society issues press releases based on a similar principle, but the organisations and scientists concerned have overall responsibility for their content.

Keep up with the RAS on Instagram, Bluesky, LinkedIn, Facebook and YouTube.

Submitted by Sam Tonkin on

Saturday, December 13, 2025

NASA’s Webb Detects Thick Atmosphere Around Broiling Lava World

This artist’s concept shows what the hot super-Earth exoplanet TOI-561 b and its star could look like based on observations from NASA’s James Webb Space Telescope and other observatories. Webb data suggests that the planet is surrounded by a thick atmosphere above a magma ocean. Illustration: NASA, ESA, CSA, Ralf Crawford (STScI)

An artist’s concept shows what a thick atmosphere above a vast magma ocean on exoplanet TOI-561 b could look like. Measurements captured by NASA's James Webb Space Telescope suggest that in spite of the intense radiation it receives from its star, TOI-561 b is not a bare rock. Illustration: NASA, ESA, CSA, Ralf Crawford (STScI)

An emission spectrum captured by NASA's James Webb Space Telescope in May 2024 shows the brightness of different wavelengths of near-infrared light emitted by exoplanet TOI-561 b. Comparing the data to models suggests that the planet is surrounded by a volatile-rich atmosphere. Illustration: NASA, ESA, CSA, Ralf Crawford (STScI); Science: Johanna Teske (Carnegie Science Earth and Planets Laboratory), Anjali Piette (University of Birmingham), Tim Lichtenberg (Groningen), Nicole Wallack (Carnegie Science Earth and Planets Laboratory)


Researchers using NASA’s James Webb Space Telescope have detected the strongest evidence yet for an atmosphere on a rocky planet outside our solar system, as NASA leads the world in exploring the universe from the Moon to Mars and beyond. Observations of the ultra-hot super-Earth TOI-561 b suggest that the exoplanet is surrounded by a thick blanket of gases above a global magma ocean. The results help explain the planet’s unusually low density and challenge the prevailing wisdom that relatively small planets so close to their stars are not able to sustain atmospheres.

With a radius roughly 1.4 times Earth’s, and an orbital period less than 11 hours, TOI-561 b falls into a rare class of objects known as ultra-short period exoplanets. Although its host star is only slightly smaller and cooler than the Sun, TOI-561 b orbits so close to the star — less than one million miles (one-fortieth the distance between Mercury and the Sun) — that it must be tidally locked, with the temperature of its permanent dayside far exceeding the melting temperature of typical rock.

“What really sets this planet apart is its anomalously low density,” said Johanna Teske, staff scientist at Carnegie Science Earth and Planets Laboratory and lead author on a paper published Thursday in The Astrophysical Journal Letters. “It’s not a super-puff, but it is less dense than you would expect if it had an Earth-like composition.”

One explanation the team considered for the planet’s low density was that it could have a relatively small iron core and a mantle made of rock that is not as dense as rock within Earth. Teske notes that this could make sense: “TOI-561 b is distinct among ultra-short period planets in that it orbits a very old (twice as old as the Sun), iron-poor star in a region of the Milky Way known as the thick disk. It must have formed in a very different chemical environment from the planets in our own solar system.” The planet's composition could be representative of planets that formed when the universe was relatively young.

But an exotic composition can’t explain everything. The team also suspected that TOI-561 b might be surrounded by a thick atmosphere that makes it look larger than it actually is. Although small planets thathave spent billions of years baking in blazing stellar radiation are not expected to have atmospheres, some show signs that they are not just bare rock or lava.

To test the hypothesis that TOI-561 b has an atmosphere, the team used Webb’s NIRSpec (Near-Infrared Spectrograph) to measure the planet’s dayside temperature based on its near-infrared brightness. The technique, which involves measuring the decrease in brightness of the star-planet system as the planet moves behind the star, is similar to that used to search for atmospheres in the TRAPPIST-1 system and on other rocky worlds.

If TOI-561 b is a bare rock with no atmosphere to carry heat around to the nightside, its dayside temperature should be approaching 4,900 degrees Fahrenheit (2,700 degrees Celsius). But the NIRSpec observations show that the planet’s dayside appears to be closer to 3,200 degrees Fahrenheit (1,800 degrees Celsius) — still extremely hot, but far cooler than expected.

To explain the results, the team considered a few different scenarios. The magma ocean could circulate some heat, but without an atmosphere, the nightside would probably be solid, limiting flow away from the dayside. A thin layer of rock vapor on the surface of the magma ocean is also possible, but on its own would likely have a much smaller cooling effect than observed.

“We really need a thick volatile-rich atmosphere to explain all the observations,” said Anjali Piette, coauthor from the University of Birmingham, United Kingdom.

“Strong winds would cool the dayside by transporting heat over to the nightside. Gases like water vapor would absorb some wavelengths of near-infrared light emitted by the surface before they make it all the way up through the atmosphere. (The planet would look colder because the telescope detects less light.) It’s also possible that there are bright silicate clouds that cool the atmosphere by reflecting starlight.”

While the Webb observations provide compelling evidence for such an atmosphere, the question remains: How can a small planet exposed to such intense radiation can hold on to any atmosphere at all, let alone one so substantial? Some gases must be escaping to space, but perhaps not as efficiently as expected.

“We think there is an equilibrium between the magma ocean and the atmosphere. At the same time that gases are coming out of the planet to feed the atmosphere, the magma ocean is sucking them back into the interior,” said co-author Tim Lichtenberg from the University of Groningen in the Netherlands. “This planet must be much, much more volatile-rich than Earth to explain the observations. It's really like a wet lava ball.”

These are the first results from Webb’s General Observers Program 3860, which involved observing the system continuously for more than 37 hours while TOI-561 b completed nearly four full orbits of the star. The team is currently analyzing the full data set to map the temperature all the way around the planet and narrow down the composition of the atmosphere.

“What’s really exciting is that this new data set is opening up even more questions than it’s answering,” said Teske.

The James Webb Space Telescope is the world’s premier space science observatory. Webb is solving mysteries in our solar system, looking beyond to distant worlds around other stars, and probing the mysterious structures and origins of our universe and our place in it. Webb is an international program led by NASA with its partners, ESA (European Space Agency) and CSA (Canadian Space Agency).


Related Information

Read more: Can Rocky Worlds Orbiting Red Dwarf Stars Maintain Atmospheres?

Explore more: ViewSpace Exoplanet Variety: Atmosphere

Explore more: How to Study Exoplanets: Webb and Challenges

Explore more: How Do We Learn About a Planet’s Atmosphere?

Read more: NASA’s Webb Hints at Possible Atmosphere Surrounding Rocky Exoplanet

More Webb News

More Webb Images

Webb Science Themes

Webb Mission Page

Related For Kids

What is the Webb Telescope?

SpacePlace for Kids


NASA’s Webb Identifies Earliest Supernova to Date, Shows Host Galaxy

NASA’s James Webb Space Telescope identified the source of a super bright flash of light known as a gamma-ray burst: a supernova that exploded when the universe was only 730 million years old. Webb’s high-resolution near-infrared images also detected the supernova’s host galaxy. Image: NASA, ESA, CSA, STScI, Andrew Levan (Radboud University); Image Processing: Alyssa Pagan (STScI)

This two-part illustration represents supernova GRB 250314A as it was exploding and three months after that, when Webb observed it. Webb confirmed the supernova occurred when the universe was only 730 million years old. The star clusters at top-left represent its host galaxy. Artwork: NASA, ESA, CSA, STScI, Leah Hustak (STScI)


With this observation, Webb also broke its own record: The previous chart-topping supernova exploded when the universe was 1.8 billion years old.

“Only Webb could directly show that this light is from a supernova — a collapsing massive star,” said Andrew Levan, the lead author of one of two new papers in Astronomy and Astrophysics Letters and a professor at Radboud University in Nijmegen, Netherlands, and the University of Warwick in the United Kingdom. “This observation also demonstrates that we can use Webb to find individual stars when the universe was only 5% of its current age.”

While a gamma-ray burst typically lasts for seconds to minutes, a supernova rapidly brightens over several weeks before it slowly dims. In contrast, this supernova brightened over months. Since it exploded so early in the history of the universe, its light was stretched as the cosmos expanded over billions of years. As light is stretched, so is the time it takes for events to unfold. Webb’s observations were intentionally taken three and a half months after the gamma-ray burst ended, since the underlying supernova was expected to be brightest at that time.

“Webb provided the rapid and sensitive follow-up we needed,” said Benjamin Schneider, a co-author and a postdoctoral researcher at the Laboratoire d'Astrophysique de Marseille in France.

Gamma-ray bursts are incredibly rare. Those that last a few seconds may be caused by two neutron stars, or a neutron star and a black hole colliding. Longer bursts like this one, which lasted around 10 seconds, are frequently linked to the explosive deaths of massive stars.

Immediate, nimble investigation of the source

The first alert chimed March 14. The news of the gamma-ray burst from a very distant source came from the SVOM mission (Space-based multi-band astronomical Variable Objects Monitor), a Franco-Chinese telescope that launched in 2024 and was designed to detect fleeting events.

Within an hour and a half, NASA’s Neil Gehrels Swift Observatory pinpointed the X-ray source’s location on the sky. That enabled subsequent observations that would pin down the distance for Webb.

Eleven hours later, the Nordic Optical Telescope on the Canary Islands was queued up and revealed an infrared-light gamma-ray burst afterglow, an indication that the gamma ray might be associated with a very distant object.

Four hours later, the European Southern Observatory’s Very Large Telescope in Chile estimated the object existed 730 million years after the big bang.

“There are only a handful of gamma-ray bursts in the last 50 years that have been detected in the first billion years of the universe,” Levan said. “This particular event is very rare and very exciting.”

Shockingly similar to nearby supernovae

Since this is the earliest, farthest supernova to be detected to date, researchers compared it to what they know in great detail — modern, nearby supernovae. The two turned out to be very similar, which surprised them.

Why? Little is still known about the first billion years of the universe. Early stars likely contained fewer heavy elements, were more massive, and led shorter lives. They also existed during the Era of Reionization, when gas between galaxies was largely opaque to high-energy light.

“We went in with open minds,” said Nial Tanvir, a co-author and a professor at the University of Leicester in the United Kingdom. “And lo and behold, Webb showed that this supernova looks exactly like modern supernovae.” Before researchers can determine why such an early supernova is similar to nearby supernovae, more data is needed to pinpoint tiny differences.

First look at supernova’s host galaxy

“Webb’s observations indicate that this distant galaxy is similar to other galaxies that existed at the same time,” said Emeric Le Floc’h, a co-author and astronomer at the CEA Paris-Saclay (Commissariat à l'Énergie Atomique et aux Énergies Alternatives) in France. Since the galaxy’s light is blended into a few pixels, making the galaxy look like a reddened smudge, what we can learn about it is still limited. Seeing it at all is a breakthrough.

The researchers have already laid plans to reenlist Webb in the international effort to learn more about gamma-ray bursts emitted by objects in the early universe. The team has been approved to observe events with Webb and now have a new aim: to learn more about galaxies in the distant universe by capturing the afterglow of the gamma-ray bursts themselves. “That glow will help Webb see more and give us a ‘fingerprint’ of the galaxy,” Levan said.

This research team observed supernova GRB 250314A with a rapid-turnaround Director's Discretionary Time program.

The James Webb Space Telescope is the world’s premier space science observatory. Webb is solving mysteries in our solar system, looking beyond to distant worlds around other stars, and probing the mysterious structures and origins of our universe and our place in it. Webb is an international program led by NASA with its partners, ESA (European Space Agency) and CSA (Canadian Space Agency).


Related Information

Read more: NASA’s Webb Opens New Window on Supernova Science

Explore more: ViewSpace Take a Tour of Cassiopeia A

Explore more: ViewSpace Star Death: Crab Nebula

Explore more: Massive Stars: Engines of Creation

Read more: Supernova Encore: NASA’s Webb Spots a Second Lensed Supernova in a Distant Galaxy

 More Webb News

More Webb Images

Webb Science Themes

Webb Mission Page

Related For Kids

What is the Webb Telescope?

SpacePlace for Kids


Friday, December 12, 2025

Flaring black hole whips up ultra-fast winds

Artist’s impression of the flaring, windy black hole in NGC 3783 (portrait)
Credit: ESA - Acknowledgements: ATG Europe
Licence:
CC BY-SA 3.0 IGO or ESA Standard Licence
(content can be used under either licence)

An artist's impression of XMM-Newton.
Credit: ESA-C. Carreau
Licence:
CC BY-SA 3.0 IGO or ESA Standard Licence
(content can be used under either licence)

XRISM spacecraft
Credit: JAXA
ESA Standard Licence


Leading X-ray space telescopes XMM-Newton and XRISM have spotted an extraordinary blast from a supermassive black hole. In a matter of hours, the gravitational monster whipped up powerful winds, flinging material out into space at eye-watering speeds of 60 000 km per second.

The gigantic black hole lurks within NGC 3783, a beautiful spiral galaxy imaged recently by the NASA/ESA Hubble Space Telescope. Astrono.mers spotted a bright X-ray flare erupt from the black hole before swiftly fading away. As i,brt faded, fast winds emerged, raging at one-fifth of the speed of light.

“We’ve not watched a black hole create winds this speedily before,” says lead researcher Liyi Gu at Space Research Organisation Netherlands (SRON). “For the first time, we’ve seen how a rapid burst of X-ray light from a black hole immediately triggers ultra-fast winds, with these winds forming in just a single day.”

Devouring material

To study NGC 3783 and its black hole, Gu and colleagues simultaneously used the European Space Agency’s XMM-Newton and the X-Ray Imaging and Spectroscopy Mission (XRISM), a JAXA-led mission with ESA and NASA participation.

The black hole in question is as massive as 30 million Suns. As it feasts on nearby material, it powers an extremely bright and active region at the heart of the spiral galaxy. This region, known as an Active Galactic Nucleus (AGN), blazes in all kinds of light, and throws powerful jets and winds out into the cosmos.

“AGNs are really fascinating and intense regions, and key targets for both XMM-Newton and XRISM,” adds Matteo Guainazzi, ESA XRISM Project Scientist and co-author of the discovery.

“The winds around this black hole seem to have been created as the AGN’s tangled magnetic field suddenly ‘untwisted’ – similar to the flares that erupt from the Sun, but on a scale almost too big to imagine.”

A little less alien

The winds from the black hole resemble large solar eruptions of material known as coronal mass ejections, which form as the Sun hurls streams of superheated material into space. In this way, the study shows that supermassive black holes sometimes act like our own star, making these mysterious objects seem a little less alien.

In fact, a coronal mass ejection following an intense flare was spotted at the Sun as recently as 11 November, with the winds associated with this event thrown out at initial speeds of 1500 km per second.

“Windy AGNs also play a big role in how their host galaxies evolve over time, and how they form new stars,” adds Camille Diez, a team member and ESA Research Fellow.

“Because they’re so influential, knowing more about the magnetism of AGNs, and how they whip up winds such as these, is key to understanding the history of galaxies throughout the Universe.”

A joint discovery

XMM-Newton has been a pioneering explorer of the hot and extreme Universe for over 25 years, while XRISM has been working to answer key open questions about how matter and energy move through the cosmos since it launched in September 2023.

The two X-ray space telescopes worked together to uncover this unique event and understand the black hole’s flare and winds. XMM-Newton tracked the evolution of the initial flare with its Optical Monitor, and assessed the extent of the winds using its European Photon Imaging Camera (EPIC). XRISM spotted the flare and winds using its Resolve instrument, also studying the winds’ speed, structure, and figuring out how they were launched into space.

“Their discovery stems from successful collaboration, something that’s a core part of all ESA missions,” says ESA XMM-Newton Project Scientist Erik Kuulkers.

“By zeroing in on an active supermassive black hole, the two telescopes have found something we’ve not seen before: rapid, ultra-fast, flare-triggered winds reminiscent of those that form at the Sun. Excitingly, this suggests that solar and high-energy physics may work in surprisingly familiar ways throughout the Universe.”


Notes for editors


SRON news release

For more information, please contact:
ESA Media Relations

media@esa.int